Scientific working - Histograms and skewed distribution
1/9
There's no tags or description
Looks like no tags are added yet.
Name | Mastery | Learn | Test | Matching | Spaced | Call with Kai |
|---|
No analytics yet
Send a link to your students to track their progress
10 Terms
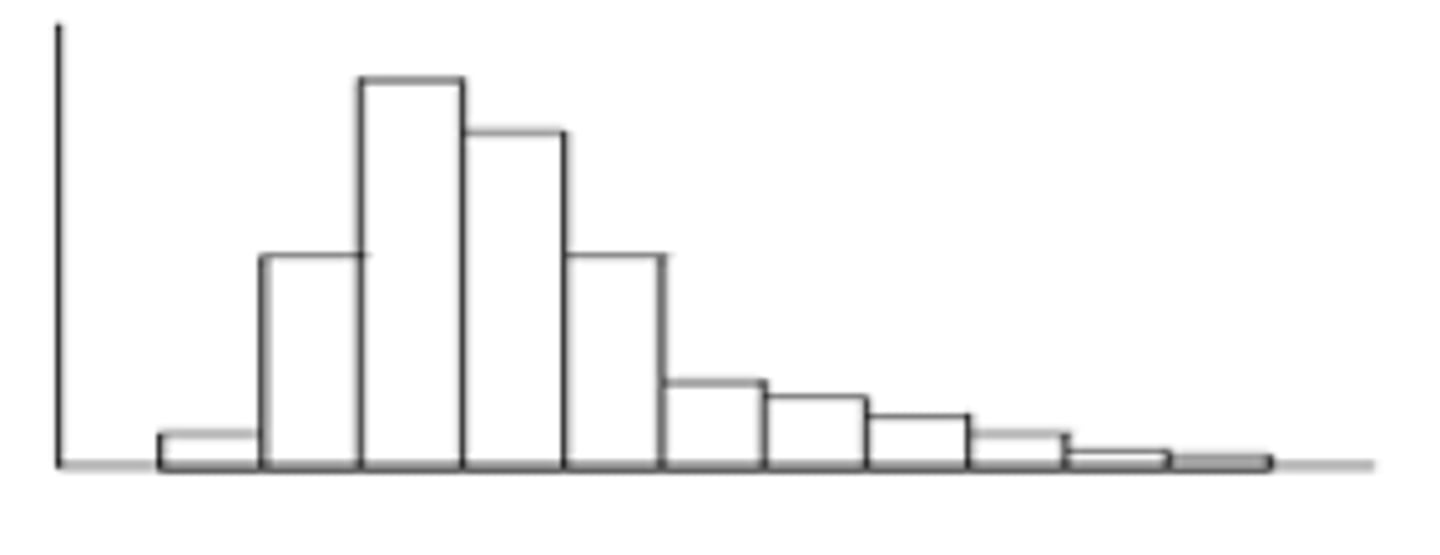
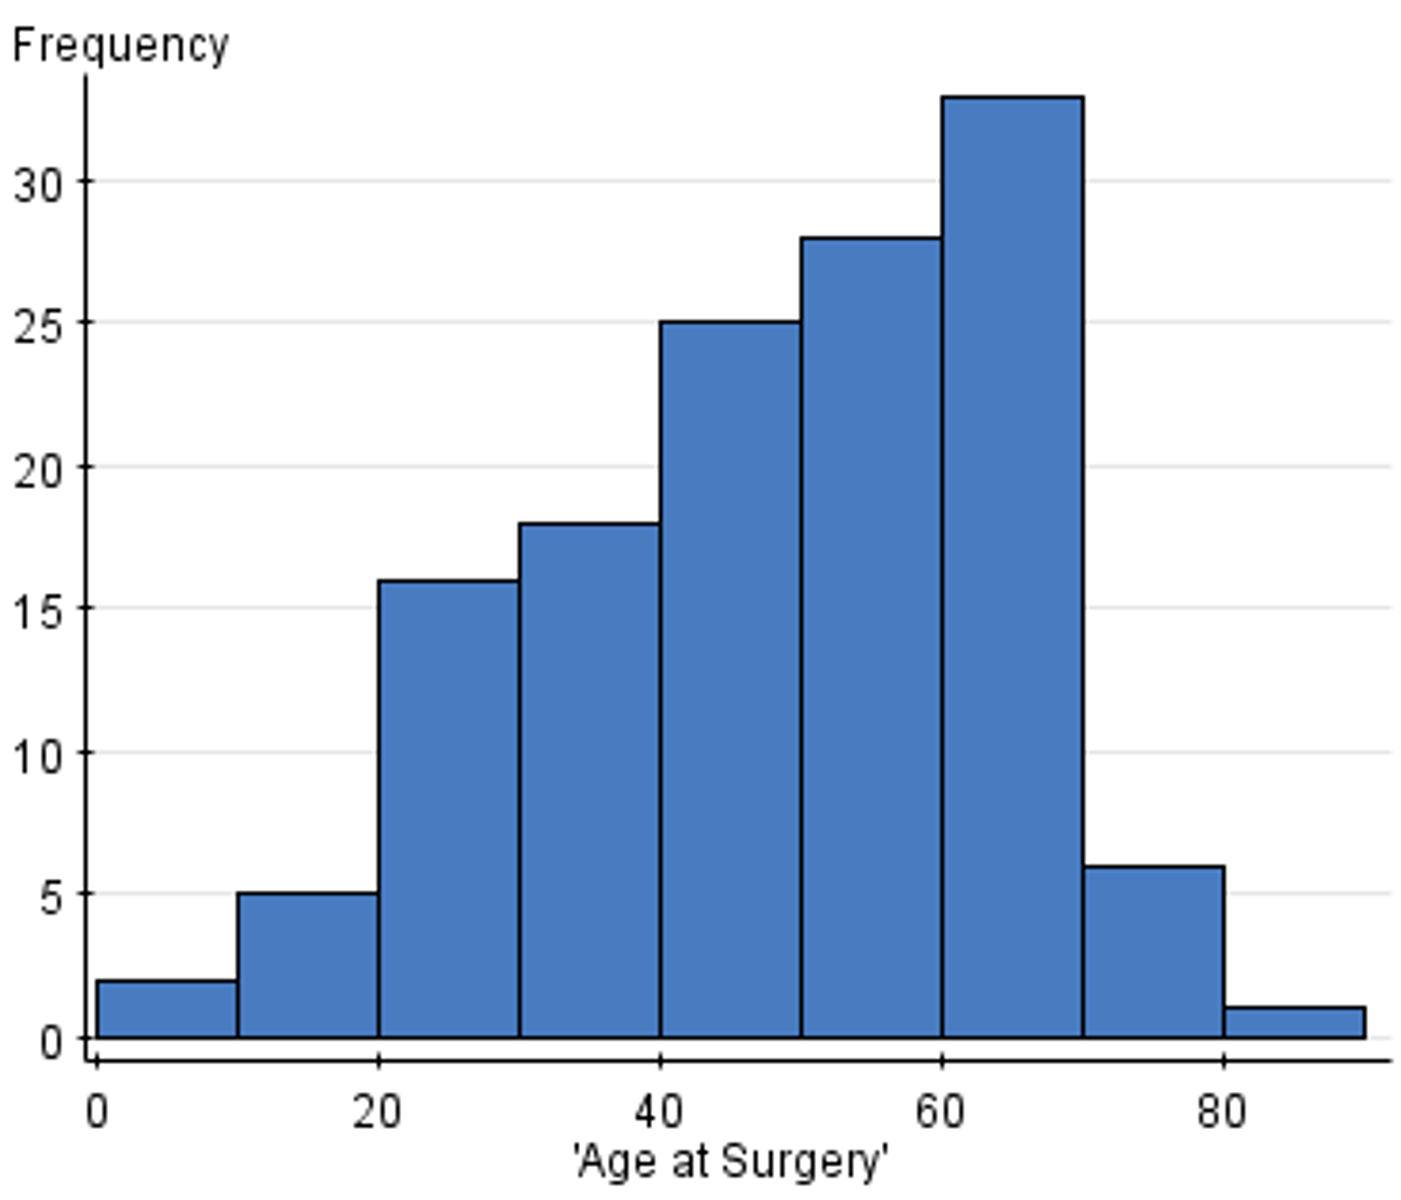
What is a histogram?
A bar graph depicting a frequency distribution
What are the rules for histograms?
- Frequency on y axis
- Bars must touch
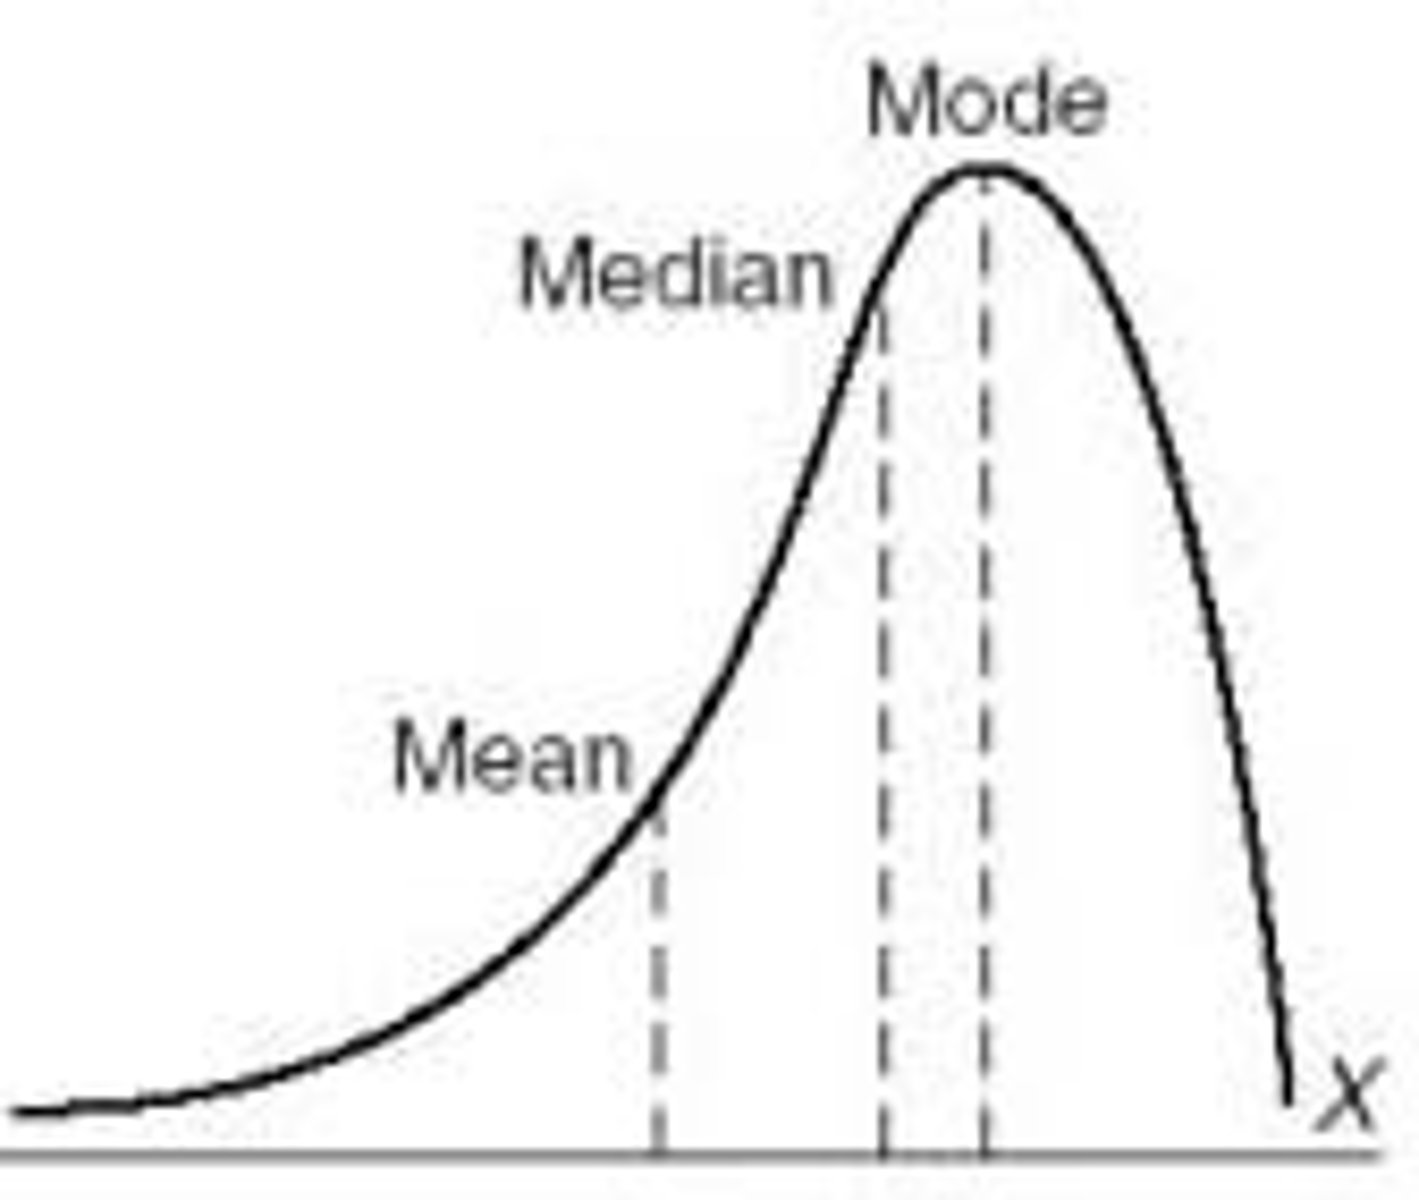
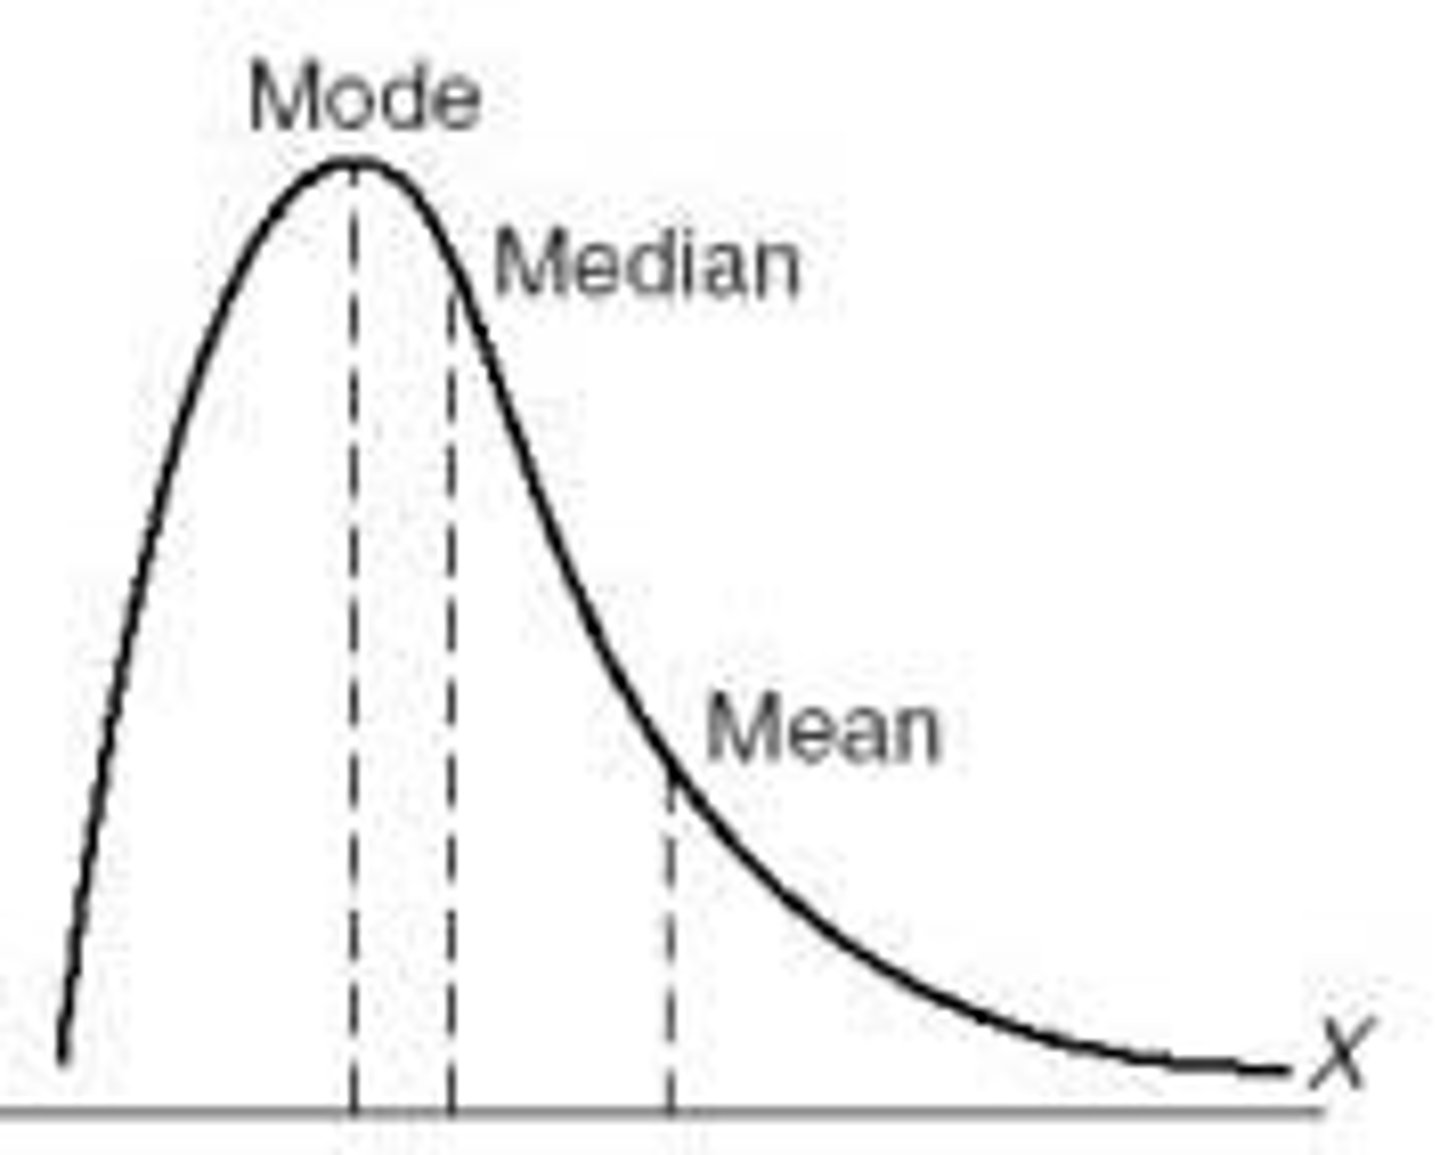
What is a skewed distribuion?
Where scores that are extreme can really affect the mean causing it be a lot higher or lower
How do we avoid skewed distribution?
Using the median rather than the mean
What type of skewed distribution is there?
Positive and negative
What can result in a skewed distribution?
Collecting data from an unrepresentative population
Describe a negative skew.
Most of the data values are at the upper end
(Y axis going up to heaven and skew is away from y axis because it was too negative/bad)
Describe a positive skew.
Most of the data values are at the lower end
(Y axis going up to heaven and skew is towards y axis because it is positive and good)
Histogram with a negative skew.
Histogram with a positive skew.