Statistics in Psychology: Belief Bias, Simpson’s Paradox, and Data Analysis Tools, Elementary Statistics: Scales, Central Tendency, and Variability for Data Analysis, Elementary Statistics: Normal Distribution, Z-Scores, and Probability, Elementary S…
1/602
There's no tags or description
Looks like no tags are added yet.
Name | Mastery | Learn | Test | Matching | Spaced | Call with Kai |
|---|
No analytics yet
Send a link to your students to track their progress
603 Terms
Why is statistics important in psychology?
Statistics help us trust our data and analyze it critically, addressing biases in our instincts.
What is belief bias?
Belief bias is the tendency to accept ideas or arguments that align with one's values, beliefs, and prior knowledge.
What is a common issue with common sense in psychology?
There is no common standard for common sense, leading to varied interpretations and beliefs.
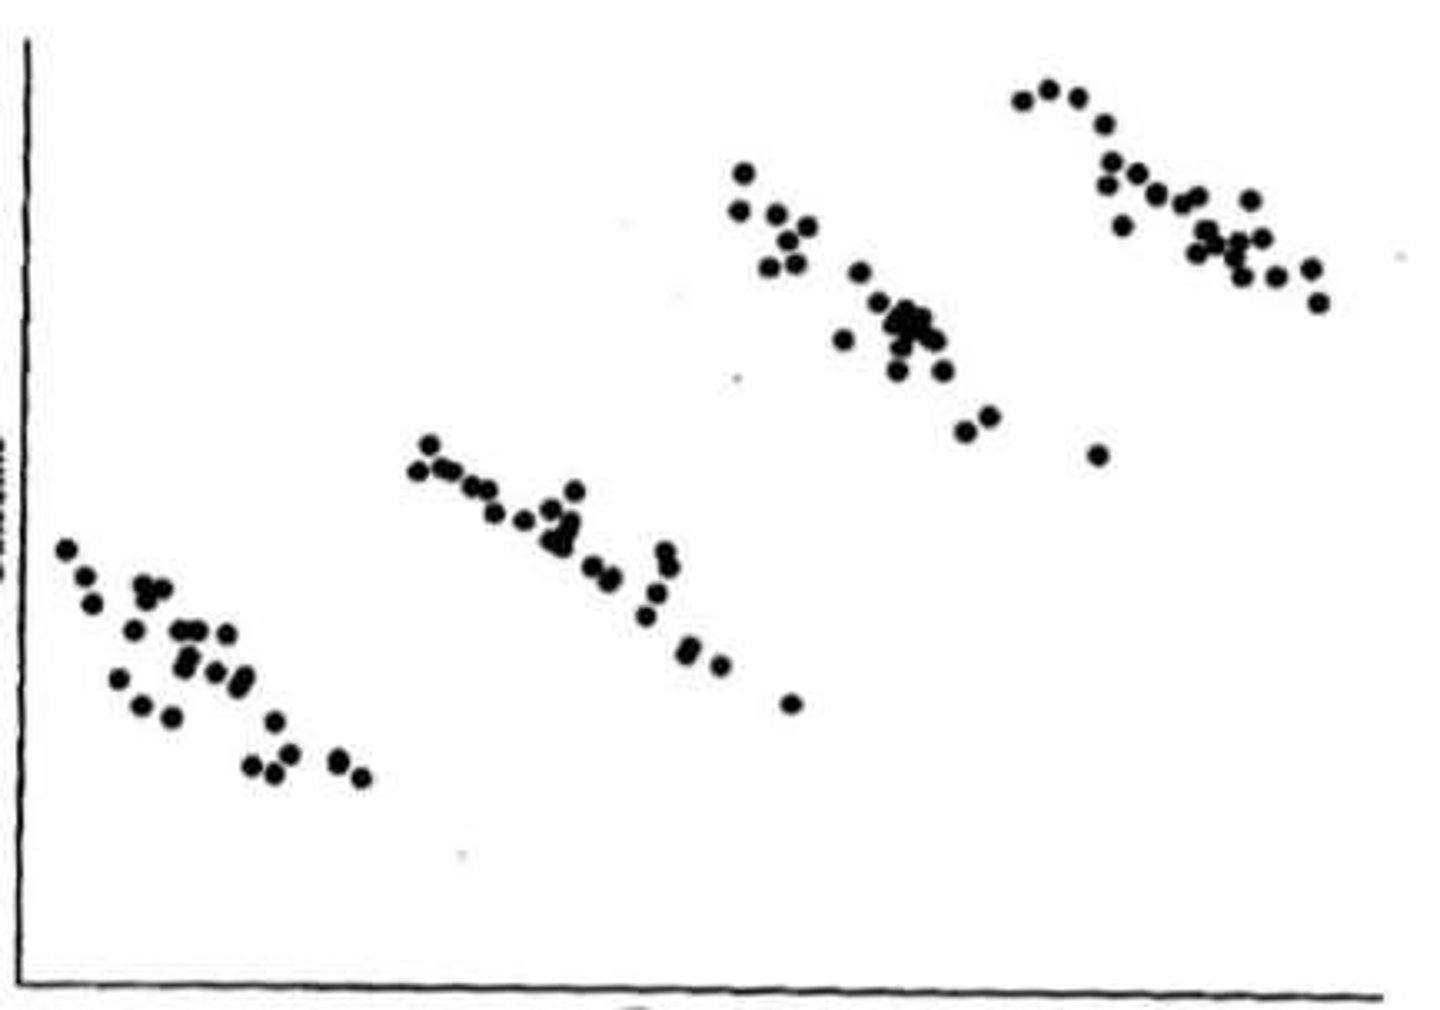
What is Simpson's Paradox?
Simpson's Paradox is a phenomenon where a trend appears in several groups of data but disappears or reverses when the groups are combined.
What is the take-home message regarding biases and statistics?
We can't trust our instincts due to biases, so we need to think critically about statistical analyses.
What are the two main types of statistics used in psychology?
Descriptive statistics, which summarize data, and inferential statistics, which extend conclusions beyond the immediate data.
What do descriptive statistics provide?
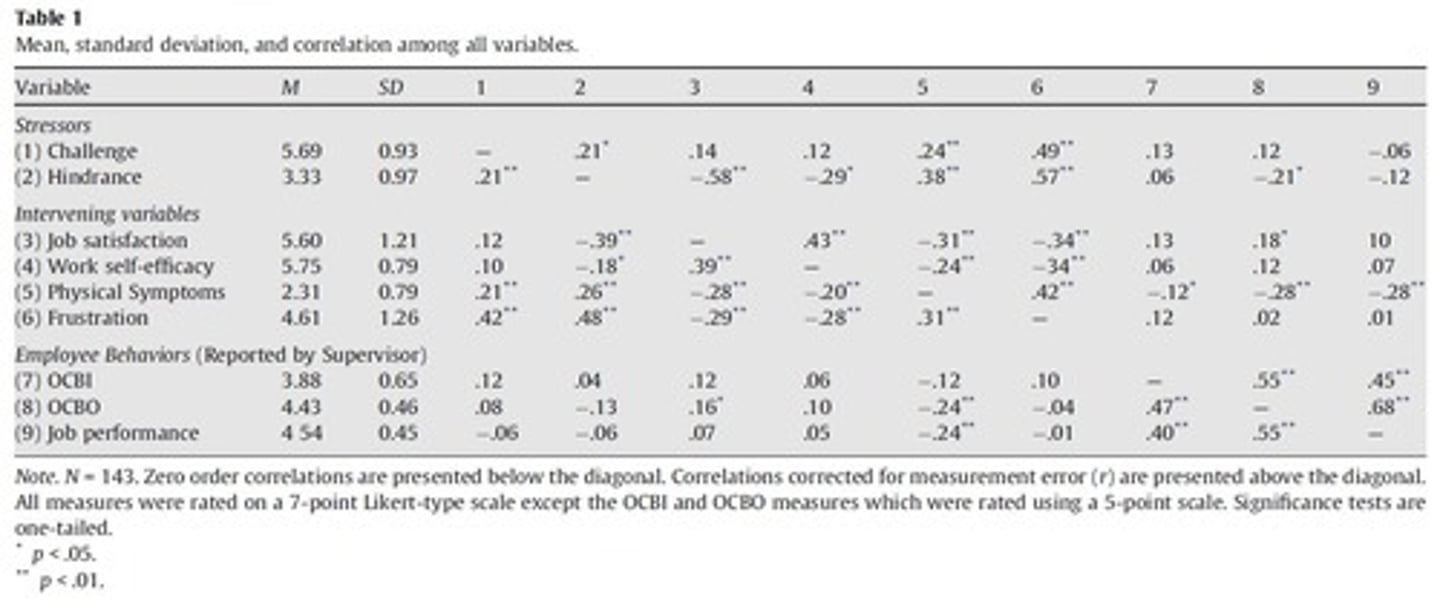
Descriptive statistics provide simple summaries about the sample and the measures, such as mean and standard deviation.
What do inferential statistics do?
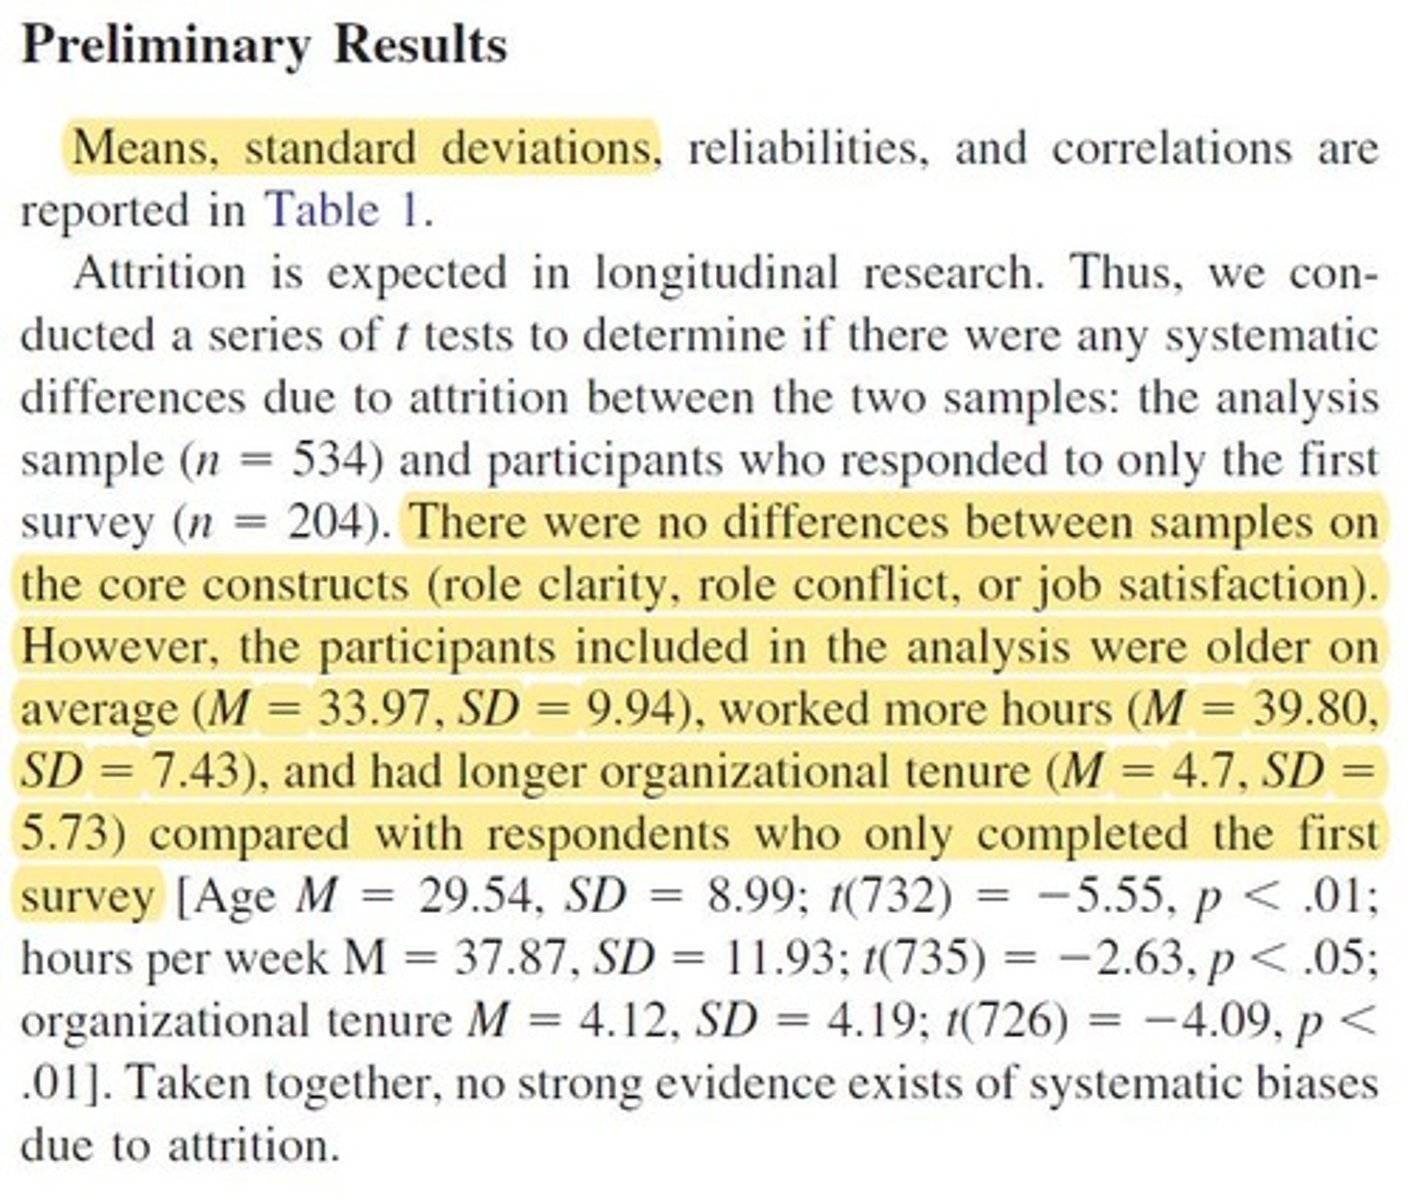
Inferential statistics infer properties of a population using statistical analysis of a sample.
What are some examples of inferential statistical methods?
Regression analysis and ANOVA (Analysis of Variance) are examples of inferential statistical methods.
What was the study by Evans, Barston, and Pollard (1983) about?
The study explored the conflict between logic and belief in syllogistic reasoning.
What is the significance of thinking critically about statistics?
Thinking critically about statistics ensures that we do not blindly trust any statistical analysis and helps us understand our data better.
Nominal Scale
A scale of measurement where categories are mutually exclusive, such as sex (female vs. male) or political party (Republican vs. Democrat).
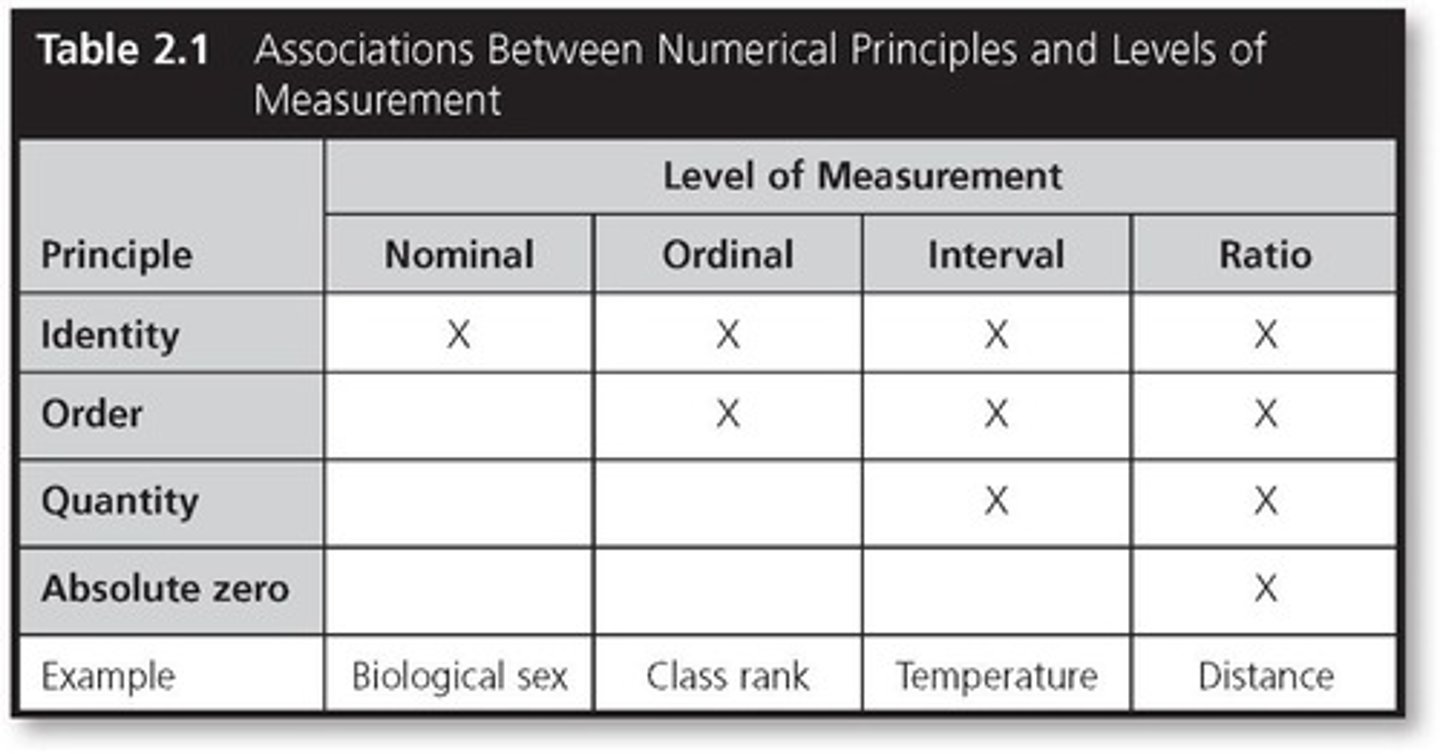
Ordinal Scale
A scale of measurement that ranks items in order, starting with 1, but does not provide information about the distance between ranks.
Interval Scale
A scale of measurement where the distance between any two adjacent points is the same, but zero does not indicate the absence of the quantity.
Ratio Scale
A scale of measurement that has equal intervals and a true zero, allowing for meaningful ratios, such as weight or time.
Categories
Groups into which data can be classified, such as sex, political party, or documentation status.
Levels
The values that a particular categorical variable can take, such as male or female for the variable sex.
Mutually Exclusive Categories
Categories that do not overlap, where an item belongs to one category only.
Practical Distinction
A workable classification where categories are not strictly mutually exclusive, such as university employee type.
Unclear Categories
Categories that are problematic due to overlap, such as types of musicians.
Top-ten List
An example of an ordinal scale where the lowest rank is always the total number of items, such as 10.
Likert Scale
An interval scale used in psychology to measure attitudes, with responses ranging from strongly disagree to strongly agree.
Temperature
An example of an interval scale where the difference between temperatures is consistent, but zero is arbitrary.
True Zero
A mathematically relevant value of zero that indicates the absence of the quantity being measured.
Equal Intervals
A characteristic of ratio scales where the difference between points is always the same.
Meaningful Ratios
A feature of ratio scales where ratios such as 'twice as much' are valid.
Angle in Degrees
An example of a ratio scale where 90 degrees is twice as wide as 45 degrees.
Time in Milliseconds
An example of a ratio scale where 100 ms is twice as long as 50 ms.
Weight
An example of a ratio scale where 300 lbs. is twice as heavy as 150 lbs.
Data Analysis Methods
The choice of methods depends on the type of scale being used for measurement.
Race Groups Analysis
An example question regarding the analysis method to examine if race groups affect hiring decisions.
ANOVA
Analysis of Variance, a statistical method used to compare means among three or more groups.
Chi-square test of independence/association
A statistical test to determine if there is a significant association between two categorical variables.
Operationalization
Transforming a meaningful yet somewhat ambiguous concept into a precise measurement.
Continuous variables
Variables characterized by the logical possibility of having another value between any two values you can think of.
Discrete variables
Variables that do not have values in between certain points.
Dependent variable (DV)
The outcome variable that is measured in an experiment, which is affected by the independent variable.
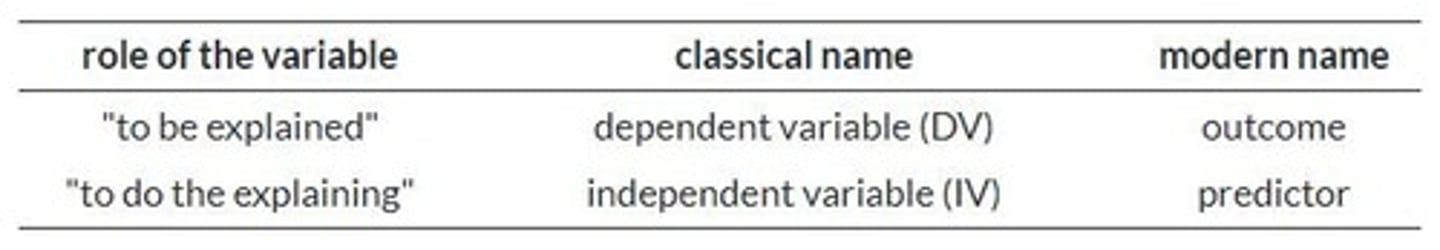
Independent variable (IV)
The variable that is manipulated or controlled in an experiment to test its effects on the dependent variable.
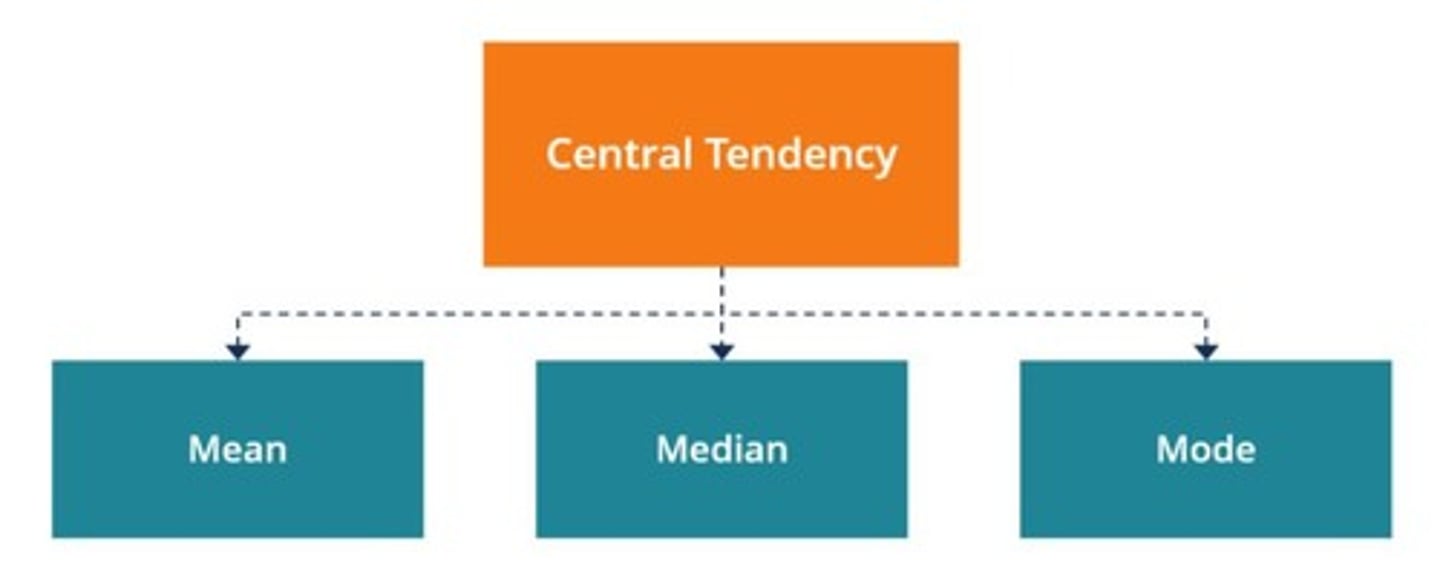
Central Tendency
A descriptive summary of a dataset through a single numerical value that reflects the 'center' of the data distribution.
Descriptive Statistics
Statistics used to describe the basic features of the data, providing simple summaries about the sample and the measures.
Inferential Statistics
Statistics that try to reach conclusions that extend beyond the immediate data alone, inferring properties of a population using a statistical analysis of the sample.
Mean
The most familiar measure of central tendency, computed by summing all values and dividing by the number of values.
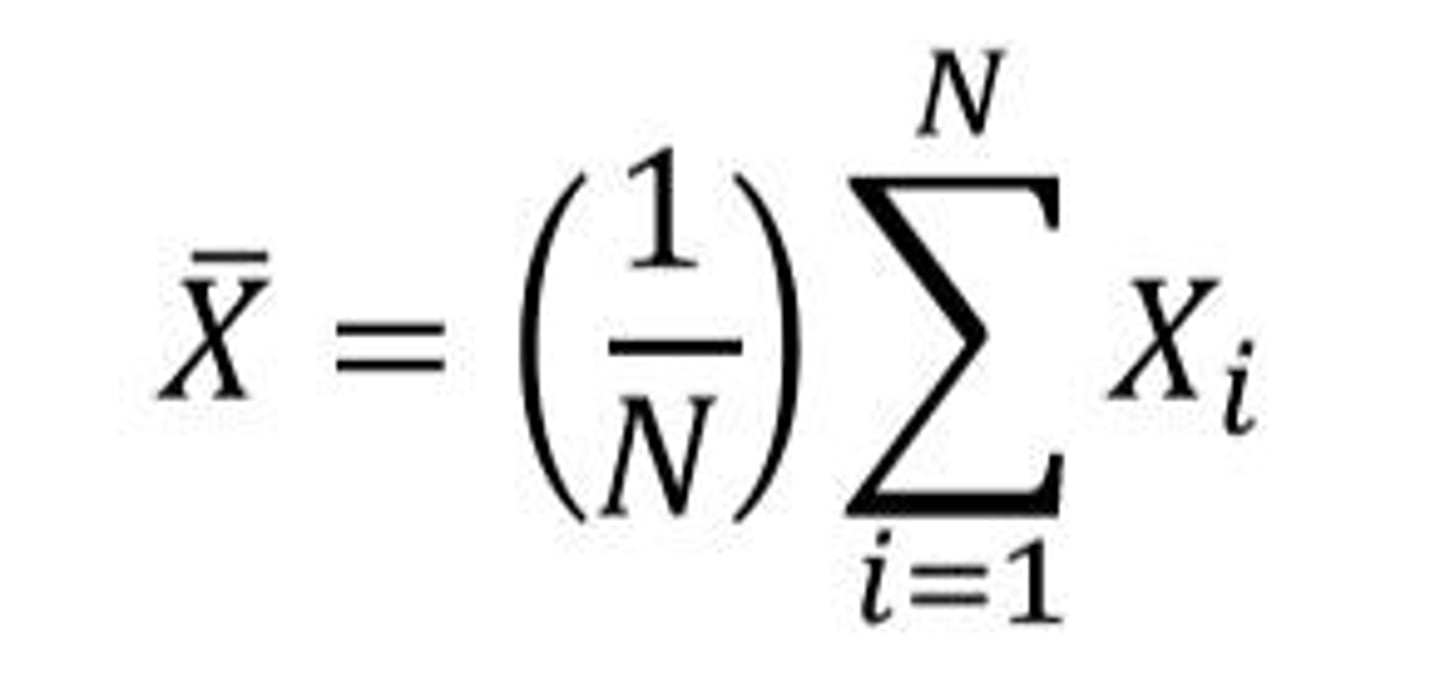
Statistical Notation
A system of symbols used to represent mathematical concepts and operations in statistics.
Skew
A measure of the asymmetry of the probability distribution of a real-valued random variable.
Kurtosis
A measure of the 'tailedness' of the probability distribution of a real-valued random variable.
Variability
A measure of how spread out the values in a data set are.
Order of Operations
Please Excuse My Dear Aunt Sally: Parentheses, Exponents, Multiplication, Division, Addition, Subtraction
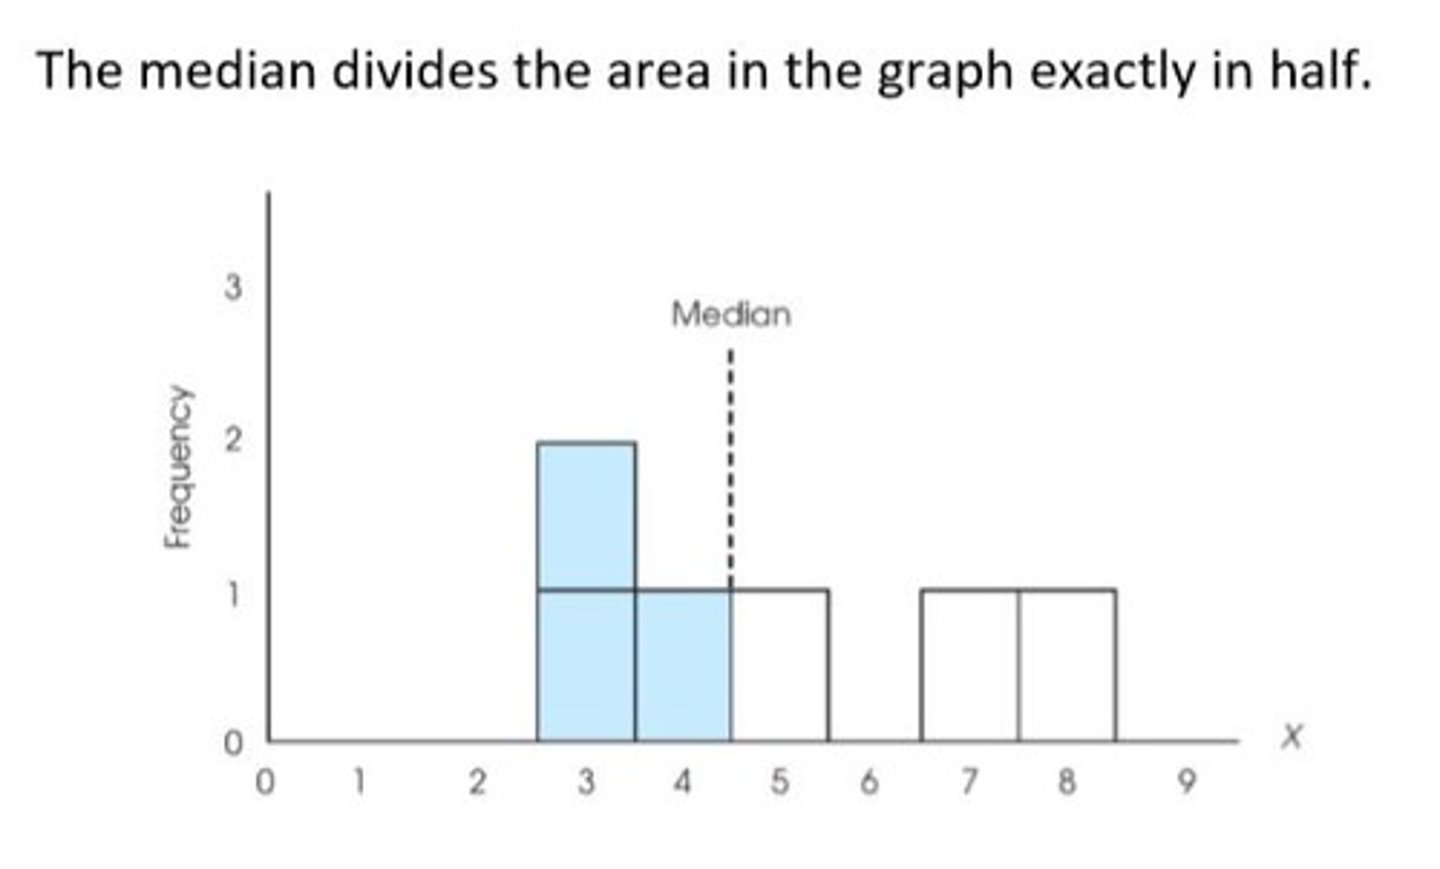
Median
The middle value in a set of scores, where half of the scores are larger and half are smaller.
How To Find the Median
1. List values in order (either highest to lowest or lowest to highest). 2. Find the 'middle-most' score.
Median (for Even Number)
If the total sample number is even, average the middle two scores.
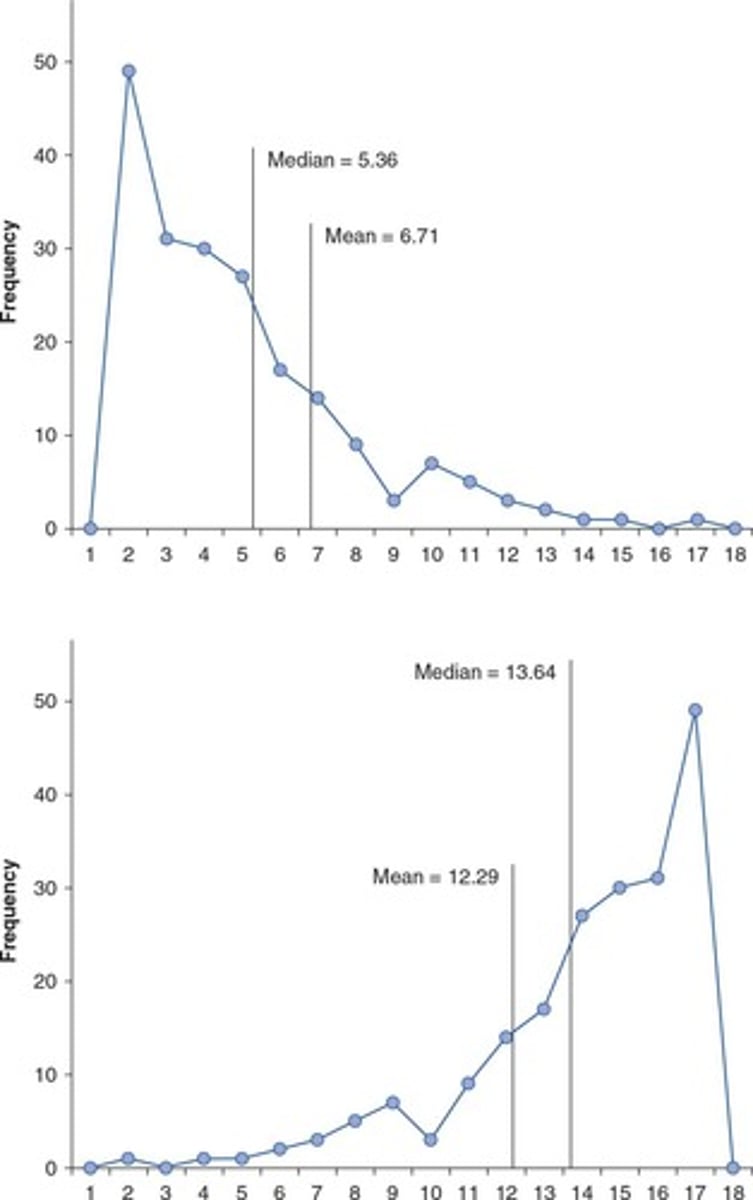
Comparing the Mean to the Median
The median is the 'middle value' while the mean is the 'center of gravity' of the data set.
Sensitivity of the Mean
The mean is very sensitive to extreme scores.
Mode
The value that occurs most frequently in the data set.
When to Use Mode
Typically used with nominal (categorical) data.
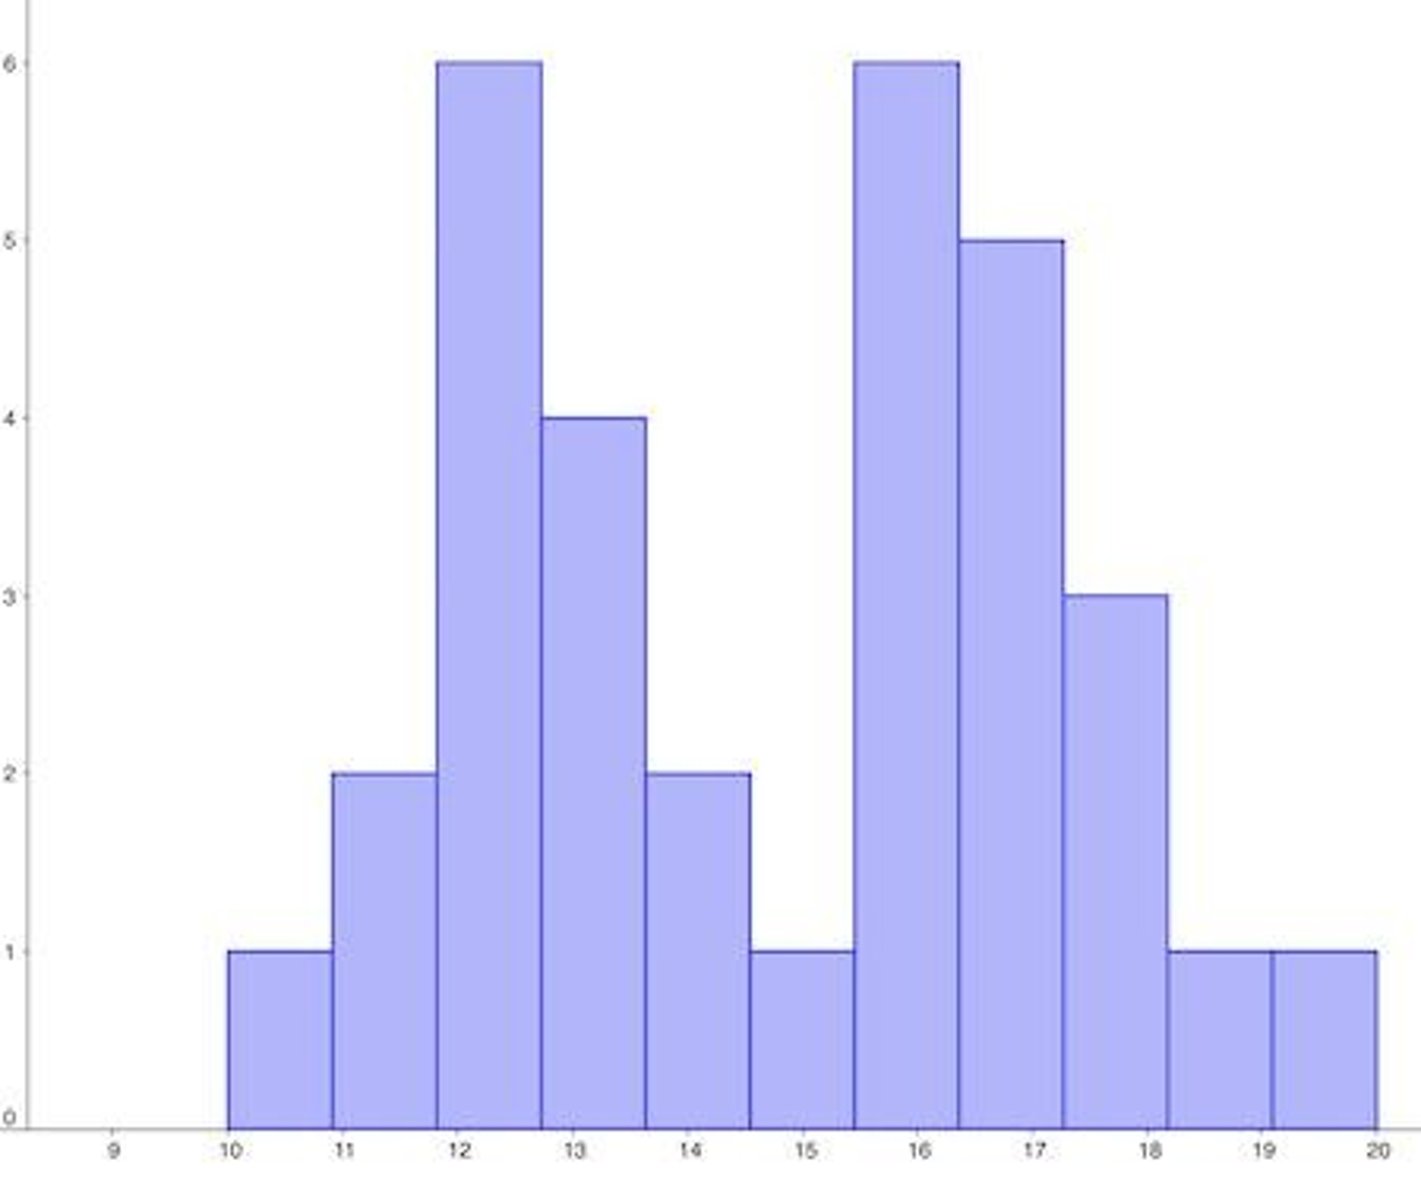
Bimodal Data Set
A data set that has more than one mode.
Scales and Central Tendency - Nominal
Cannot use either mean or median; best to use mode.
Scales and Central Tendency - Ordinal
Can use median if you use the order information; mean is not appropriate.
Scales and Central Tendency - Interval
Can use mean and median; mean is very sensitive to extreme, outlying values.
Scales and Central Tendency - Ratio
Can use mean and median; mean is very sensitive to extreme, outlying values.
Example of Mean Calculation
Mean: $58,333; Median: $60,000.
Example of Extreme Scores
Mean: $25,043,750; Median: $62,500.
Finding the Mean
Sum all values and divide by the count of values.
Median for Even Number
If the total sample number is even, average the middle two scores.
Comparing Mean to Median
The median is the 'middle value', while the mean is sensitive to extreme scores and represents the 'center of gravity' of the data set.
Skew and Kurtosis
Shapes of distributions that describe the asymmetry and peakedness of the data distribution.
Measures of Variability
Describes the spread or dispersion of data.
ΣX
The sum of all X values in a dataset.
ΣY
The sum of all Y values in a dataset.
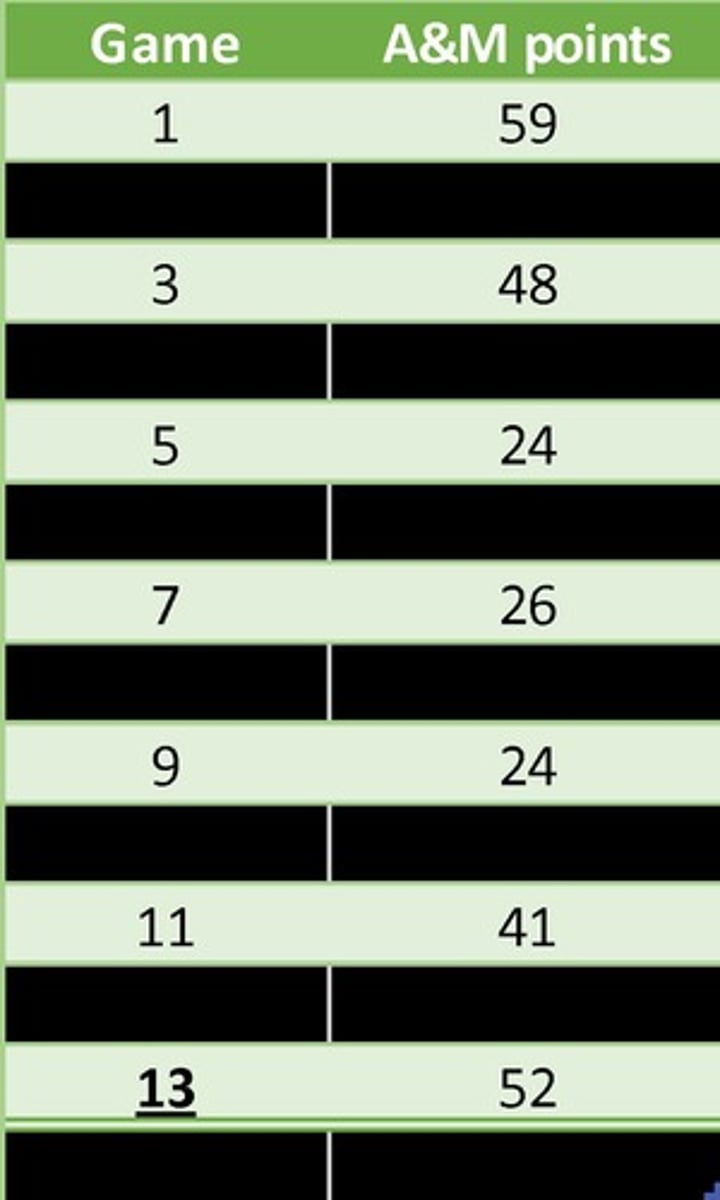
Data Example
Fall, 2018 A&M Football Scores used for practice calculations.
Mean Sensitivity
The mean is sensitive to extreme scores, which can skew the representation of the data.
Typical Value
A value that best represents an entire set of scores.
Exam Average Interpretation
If the average score on an exam is 90 out of 100, it reflects the typical performance of the test-takers.
Sample Size
The number of observations in a dataset, which can affect statistical calculations.
Data Distribution
The way in which data values are spread or arranged.
Distribution
The distribution is skewed to the left (negative skew).
Finding the mode
No formula or trick to finding the mode; just count up how many times each value appears.
Mode Usage
Typically used with nominal (categorical) data.
Range
The most general measure of variability; computed by subtracting the lowest score from the highest score.
Range Formula
r = h - l, where r = range, h = highest score in data set, l = lowest score in data set.
Interquartile Range (IQR)
The distance between the 75th and the 25th percentile scores.
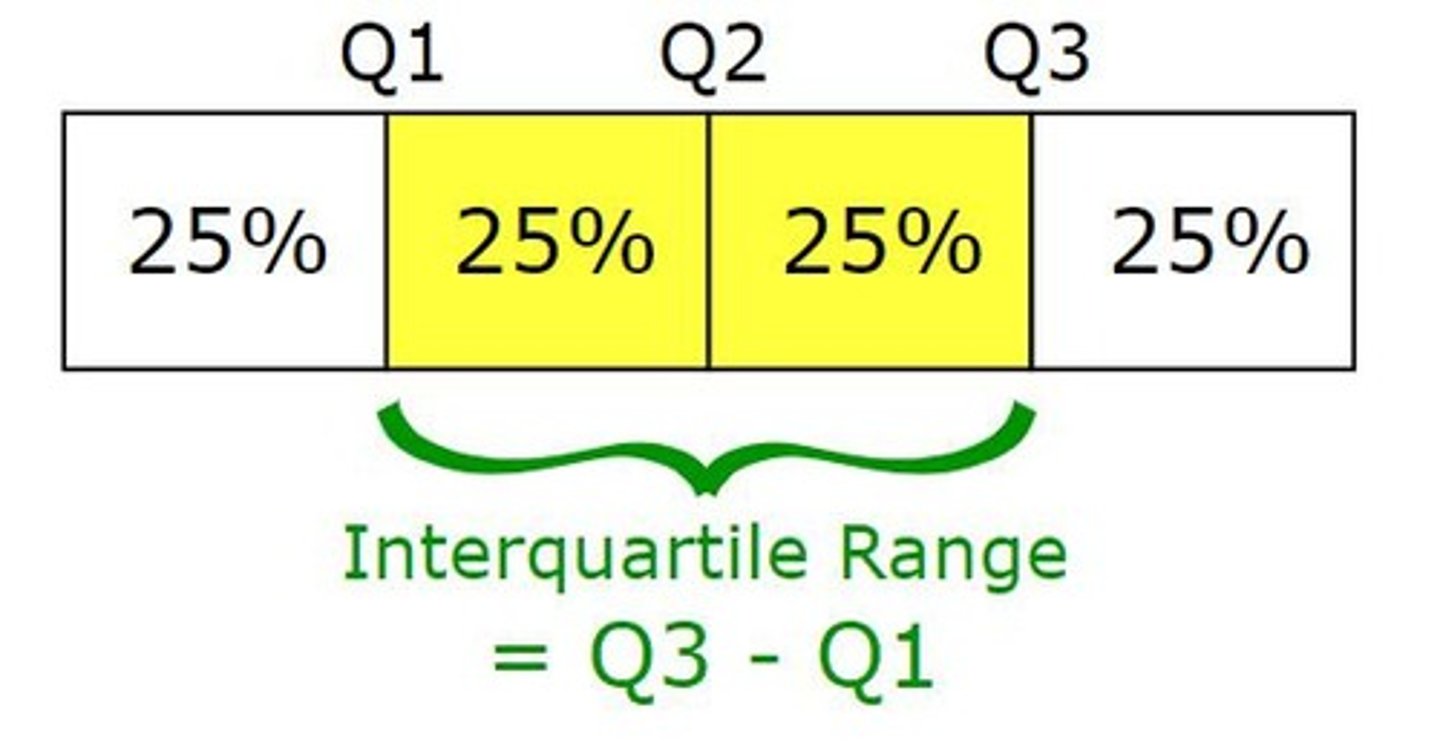
Percentile
A percentile score is a score at which X% of the scores recorded are below that score.
Standard Deviation
The most frequently reported measure of variability; represents the average amount of variability in a set of scores.
Sum of squares
This is known as the sum of squares.
Variance
The result is known as the variance.
n-1
By making the denominator of our formula smaller, the standard deviation will be bigger.
Correction for small sample sizes
This corrects the downward bias introduced by small sample sizes on estimating variation.
Unbiased estimates
Unbiased estimates are (on average) equal to the population parameter.
Square root in formula
It is because we square the 'distance' of each data point from the mean when calculating variability.
Reporting mean and standard deviation
In your assignments (as it's done in journal articles), you almost always need to report the mean and standard deviation together.
Variance as a measure of variability
Third measure of variability.
Standard deviation vs. variance
If you know the standard deviation, then you know the variance.
Interquartile range
Tells where the 'middle half' of the data.
Standard deviation interpretation
Can be easily interpreted because it's expressed in the same units as the raw data.
Variance usage
Almost never used but it's buried 'under the hood' of a very large number of statistical tools.
Small sample sizes
Small samples are unlikely to capture the extreme values that exist in a population.
Mathematical penalty
Think of it as a mathematical 'penalty' for small sample sizes.
Extreme values
This will make the standard deviation seem smaller.
Calculation of SD
You have SEVEN steps for the calculation of SD.
Step 1 in SD calculation
List all the scores.
Step 5 in SD calculation
Sum all those squared deviations.