Part 1
1/26
There's no tags or description
Looks like no tags are added yet.
Name | Mastery | Learn | Test | Matching | Spaced | Call with Kai |
|---|
No analytics yet
Send a link to your students to track their progress
27 Terms
Sample Groups
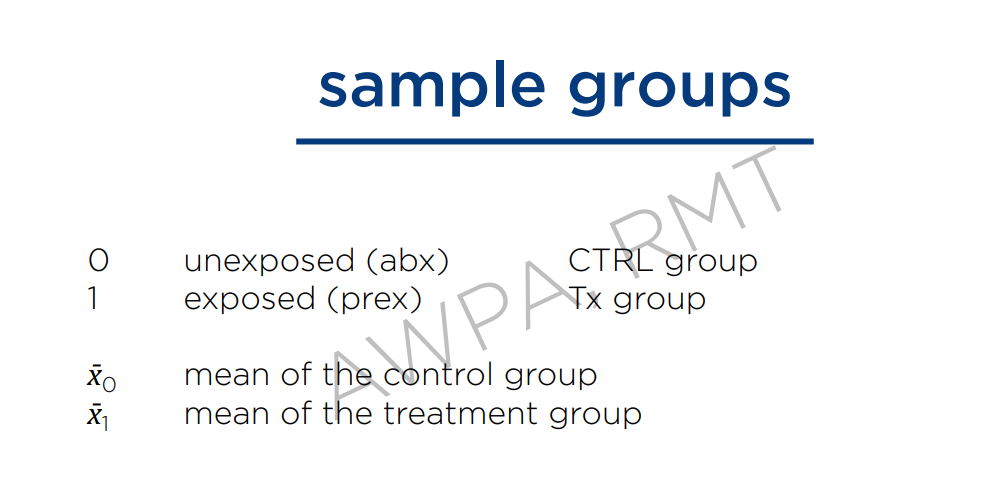
In research there are 2 sample groups
Control group
Is denoted by 0, because it is the unexposed, wala siyang minamanipulate. There is a absence of variables.
Treatment group
Is denoted by 1, exposed group, there is presence of manipulation.
Example;
"The Effect of Vitamin C Supplementation on Cold Recovery Time"
100 people who recently caught a cold.
Treatment Group:
50 participants are given 500 mg of Vitamin C daily for one week.
Control Group:
The other 50 participants are given a placebo (a sugar pill that looks identical to the Vitamin C pill) daily for one week.
Continuation
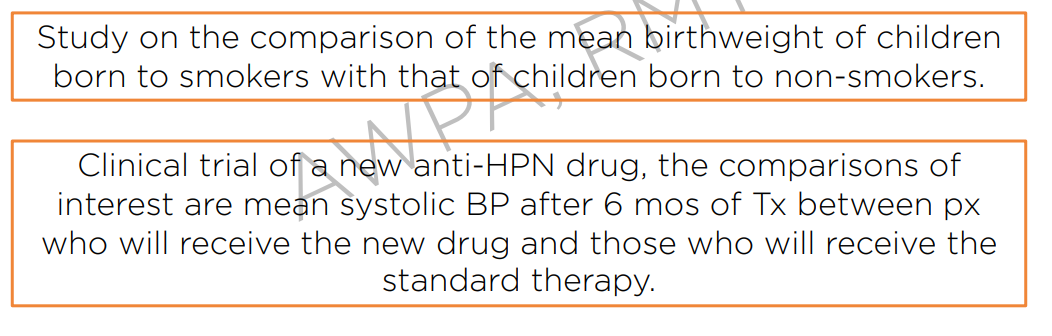
Identify control group and treatment group;
Controlled : Children born to non-smokers
Treatment : Children born to smokers.
Controlled : Patient ho will receive the standard therapy
Treatment: Patient who will receive the new anti- HPN drug
Continuation
There are factors to consider in Hypothesis testing;
How much better or worse off are exposed individuals compared to unexposed?
We must compare the results of the unexposed groups, and the exposed groups.
Do the data provide evidence that the exposure actually affects the outcome or does the observed difference between the outcomes appeared by chance?
You must provide an evidence that will support your claim that there is indeed a difference between the outcomes or results of the treatment or controlled group.
What evidence are you going to use?
P- value, because you use this to either approve or reject the null.
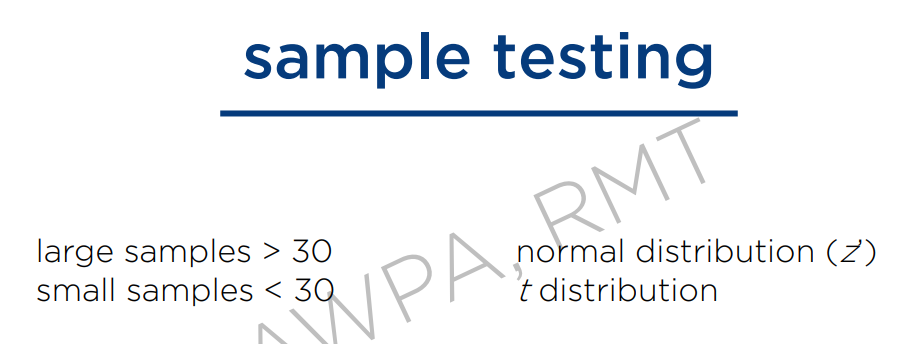
Sample testing
Above 30 = Large sample size
This will now use the z table, or also known as the standard normal distribution table.
Below 30 = Small sample size
This will now use the t table, also known as students t distribution table.
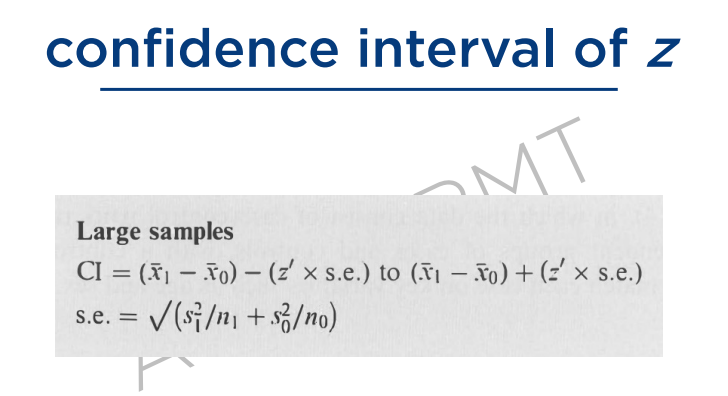
Confidence interval of z
This formula is still confidence interval but there is a difference, what is it?
Mean of the control and the treatment.
Controlled sample group and Treatment sample group
We are talking about 2 means, we must know the difference between the 2 means, that’s why it is subtracted. But why did we add are standard errors, why is it not the same as the mean that it was subtracted, even if we are talking about the difference of the means?
Why Add the Standard Errors?
Standard error is like a "fuzziness" or "uncertainty" in the measurement.
Each group (control and treatment) has its own fuzziness.
To figure out how fuzzy the difference is, you combine the fuzziness of both groups by adding their standard errors (but mathematically, using squares and square roots).
Why Not Subtract Standard Errors?
Fuzziness (uncertainty) from both groups adds up—it doesn't cancel out.
Think of it like this:
If two people are guessing the height of a building and both are unsure, their uncertainties combine.
You can't cancel out uncertainty, so you add it up.
Add the standard errors to account for the uncertainty from both groups.
This gives you a proper confidence interval for the difference.
Continuation
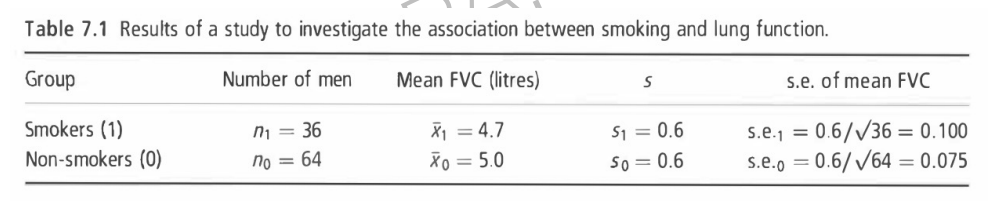
To investigate whether smoking reduces lung function, forced vital capacity (FVC) was measured in 100 men aged 25-29, of whom 36 were smokers and 64 non-smokers.
Controlled: The non-smokers (64 men)
Treatment: The smokers (36 men)
So lets derive the confidence interval of these 2 groups. Recall the CI formula.
Note if the study does not mention the confidence level, we’ll assume 95%.
For the standard error don’t forget the squared” part.
(4.7-5.0) - ( 1.96 × 0.125)
CI of z = Lower Limit = -0.545
Upper Limit = -0.055
Since we are talking about the reduction of the FVC, this is already evidence that there is a reduction of the FVC.
But at this point, we are still unsure whether the reduced is the smokers, or non-smokers.
So we will now go to the part wherein we will answer the question.
Consider this question, when you are trying to compare the difference between, your control and treatment group, you should be certain that the difference between those 2 means are 0.
Recently the difference of our mean was -0.3, it was not 0, 0 means no difference but since it is -0.3, we are sure that there is a difference.
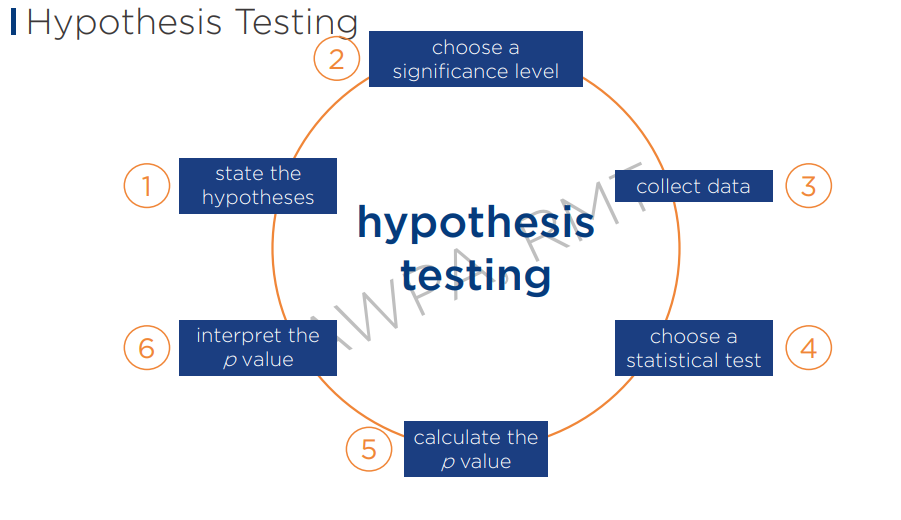
Hypothesis Testing
We will now try to test or to solve our hypothesis.
Deciding whether hypotheses on a study are valid to the sample population by means of statistical analysis
Hypothesis testing is also called as significance testing, this is where you will decide if your hypothesis will be accepted or rejected.
A statement about the probable relationship between two or more variables.
Hypothesis testing is you are trying to prove if there is a relationship between this and that.
Null (H 0)
Absence of relationship hypothesis research is trying to disprove.
Alternative (H 1)
Presence of relationship the researcher is trying to prove.
Continuation
State the Hypothesis
Null: There is no significant difference -
Alternative: There is a significant difference -
Choose a significance level
95% z’ = 1.96
Collect data
Falls under chapter 3
Choose a statistical test
Calculate the p value
p stands for probability, this will now be used as evidence, to approve or to reject the null hypothesis.
Interpret the p value
you will now use the p value to accept or reject the null
P Values
Probability of recording a difference between means of two groups in a population.
Remember: The smaller the p value, the stronger the evidence is against the n 0. (null)
Continuation
The most used CL is 95%, if you use 95% CL, the statistical p will be; 0.05
How did it become 0.05?
You calculate your test statistic by treating your CL as decimal, 0.95, now we will subtract your it to 1.0, because this is the perfect percent probability, and it is equal to 0.05
Your 0.05 will now be your basis for accepting or rejecting your null.
The smaller the p value, the stronger the evidence is against the n 0 (null).
If your p is smaller than 0.05, you will?
Reject the null.
Continuation
We have here the Null, and Alternative
H 0 = mean FVC is the same in smokers and non-smokers
There is no significant difference
In the null, there is an absence of relationship
H 1 = mean FVC in smokers and non-smokers are not the same
There is a significant difference
Between these 2, we are trying to disprove the null, we are trying to prove that indeed there is a difference in the FVC of smokers and non-smokers.
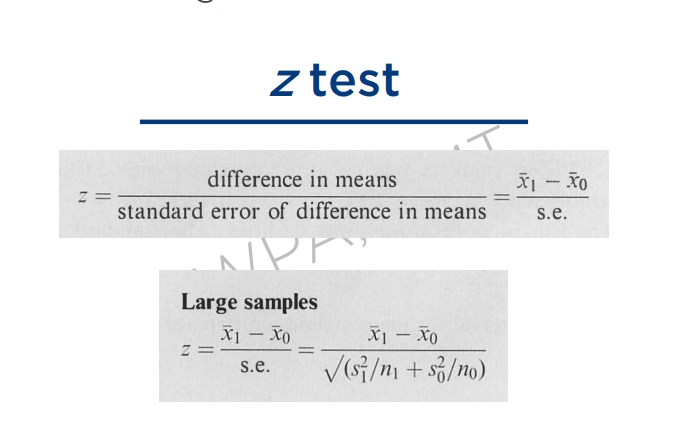
1st Statistical Tool - Z Test
Uses the z-score or the SND to determine whether two population means are different or to compare one mean to a hypothesized value where the standard deviations are known and the sample size is large. (more than 30)
If you sample size is MORE THAN 30, your statistical test is a Parametric test
Types of statistical tools
Parametric
Assumes that the data are normally distributed in a population
Uses the mean value .
Mean is the preferred measure in the central tendency.
more common, in larger samples
More than 30 samples
Non-parametric
Makes no assumptions about a population.
Data in your population are abnormally distributed.
Uses the median value
Less strict data, smaller samples
Less than 30 samples
Assumptions Z test
continuous data are used
Infinite
sample is random
homogeneity of variance (homoscedasticity)
This means there is same variance of the two groups.
appropriate sample size (>30)
population standard deviation is known
normal distribution of data
Continuation
z test formula
Recently we computed the CI of z
Now we will find the value of z
Values recently:
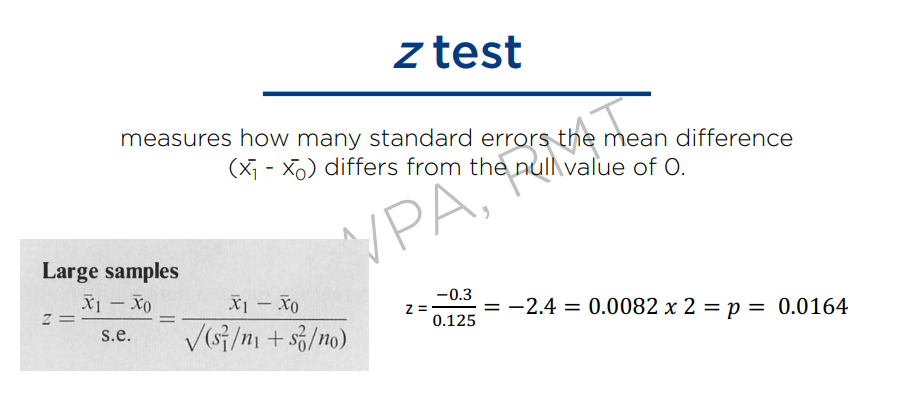
X1-X0 = -0.3
se = 0.125
z is = -2.4
Use the “Left table” (Provided by sir wyn)
This is now the area after the curve.
The value of -2.4 = 0.00820
Question, is this a one sided value or two sided?
One sided because it is only a negative, we still need to get the value of your positive 2.4. = 0.00820 why?
it has to be the same, the positive value will take the value of the negative.
The use of “Under table” is when we we are computing for the area under the curve.
Continuation
Now, we need to get a two sided p for us to test the hypothesis, so now we know that the + and - 2.4 is = 0.00820, what will be the value of your p?
0.0164. (Check picture for Sol)
Test the hypothesis
Try to test the hypothesis;
What hypothesis are we trying to disprove?
H 0 = mean FVC is the same in smokers and non-smokers
There is no significant difference between the mean FVC of smokers and non smokers
p= 0.0164
We know that the smaller the p value, the stronger the evidence is against the n 0 (null).
What is our statistical p?
0.05, it is because we used the CL of 95%.
If your p is = 0.0164 and your statistical p is = 0.05, do we accept or reject the null?
Reject the null, because your 0.0164 is less than 0.05.
Now we rejected the null, we can say that “There is a difference between the FVC of smokers and non-smokers.”
But the question is hinot nag iiba haira hin FVC?
The smokers
Types of Z-test
One sample z test. compares the sample mean to the population mean.
When we say one sample z test, how many groups are used? One.
And this group can either be a controlled or a treatment group.
And since we are comparing the means of two different groups, we have one group, that group is your control or treatment. What is the other group?
Population mean, this serves as a reference point for comparison.
Left Tailed Test: B
H 0 : μ = μ0
H 1 : μ<μ0
Your population mean is less than control mean of the population.
Positive
Where is population mean located? It lies where 0 is located.
Decision: z’ < z CI = reject the H 0
Right Tailed Test: A
H 0 : μ=μ0
H 1 : μ>μ0
Your population mean is more than control mean of the population.
Negative
Decision: z’ > z CI = reject the H 0
Two Tailed Test: C
Meaning your curve is symmetrical
H 0 : μ = μ0
H 1 : μ ≠ μ0
Your population mean is not equal to population control mean, therefore you population control mean is from which side? Negative or Positive?
Negative and positive
Decision: z’ > z CI = reject H 0
Continuation
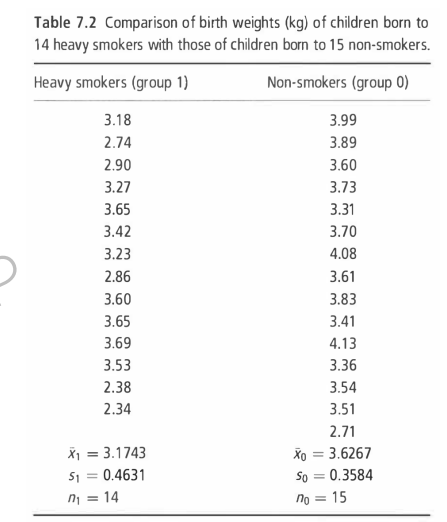
Study
Determine the difference of the means between birth weights of children born to 14 heavy smokers and to 15 non-smoker.
Controlled: Children of Non-smokers 15
Treatment: Children of Heavy Smokers 14
This study is a small study, because 14 + 15 = 29, the sample is not more than 30.
But what if it is 30? Is it large or small?. Large sample.
Continuation
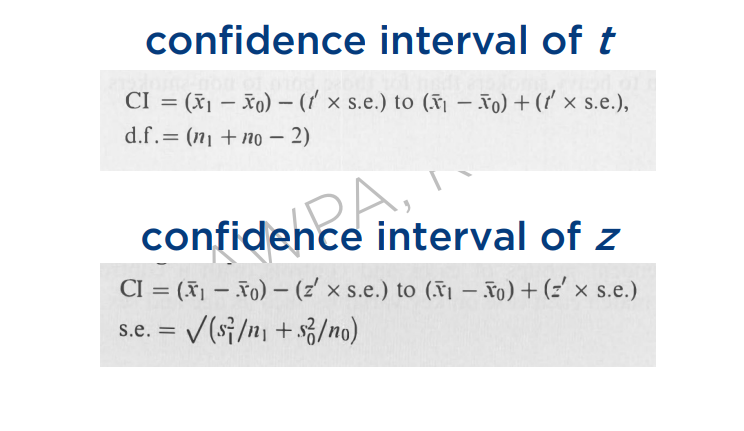
Lets compute for the confidence interval of t
Lets analyze first, lets compare it with the z
Your z became t, because we are not talking about the z.
We are now talking about the students t distribution table.
degrees of freedom present, because when we make use of t distribution table we always use this n -1.
Why is it minus 2?, because you are now talking about 2 means.
The mean of the treatment group and the mean of the controlled group.
Let’s Compute
How do you find the t using the t table?
On the left is the value of your df, you must know on how to get the df for you to get the value of your t.
On the top these are your confidence levels, study's confidence level is 95%
because it was not assumed.
the statistical p of 95 is = 0.05
so you will use 0.05 against 27 in this table, you will have the value of your t.
why 0.05 because we are looking for the two sided p.
d.f = (14 + 15 -2 ) = 27
for the s.e, you must add you 2 s, s1 and s0
CI = (3.1743-3.6267) - (2.052 x
Continuation
Let’s Compute
How do you find the t using the t table?
On the left is the value of your df, you must know on how to get the df for you to get the value of your t.
On the top these are your confidence levels, study's confidence level is 95%
because it was not assumed.
the statistical p of 95 is = 0.05
so you will use 0.05 against 27 in this table, you will have the value of your t. 2.052
why 0.05, because we are looking for the two sided p.
d.f = (14 + 15 -2 ) = 27
for the s.e, you must add you 2 s, s1 and s0, so how?
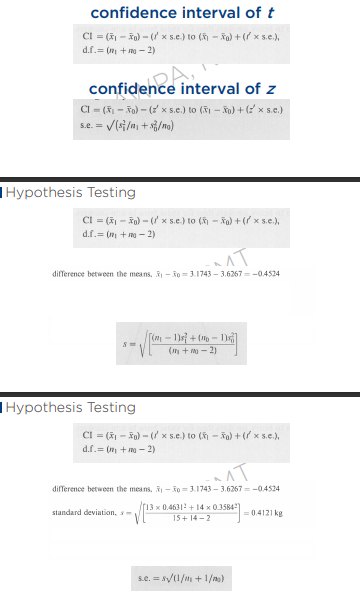
We need to find the standard deviation first (check ppt for formula).
s = 0.4121 kg
Now since we have the standard deviation, we can now solve for the standard error, which the formula is s.e = (s) 0.4121 √ (1/14 + 1/15) = 0.1531 kg
Take note, the formula is different from the standard error of z, why? because we are using the degrees of freedom, n-1 became a fraction
difference of means = (3.1743 - 3.6267) = -0.4524
Substitute Values:
CI = (3.1743-3.6267) - (2.052 × 0.1531) = -0.77 to;
CI = (3.1743-3.6267) + (2.052 × 0.1531) = -0.14 kg
But at this point we still do not know on who is the one that the weight is reducing.
This is where t test comes; in t test you are using the students t table, to determine the differences
T test
Uses the t value to determine whether two population means are different or to compare one mean to a hypothesized value where the standard deviations are not known and the sample size is small
Is a parametric test, because it assumes about the whole population.
this is the only statistical tool that is an exception to the sample rule.
so even if your sample is less than 30, your t test is still a parametric test because it assumes, data in your population are still normally distributed.
T- test assumption
Assumptions
continuous, interval, or ratio data are used
interval data, are known gaps
ratio data, (e.g weight, height )
if your study is about weight or height, you study is automatically a t test.
variables are categorical or nominal to define groups
categorical variable, they describe, so therefore they are also nominal.
sample is random
homogeneity of variance (homoscedasticity)
appropriate sample size (<30)
population standard deviation is unknown
in z test it is known
normal distribution of data
Hypothesis
To state the hypothesis;
Null (H 0) : there is no significant difference between birthrate of children born to smokers and non smokers.
Alternative (H 1): there is a significant difference ——
In here we are trying to disprove the null hypothesis.
Solving
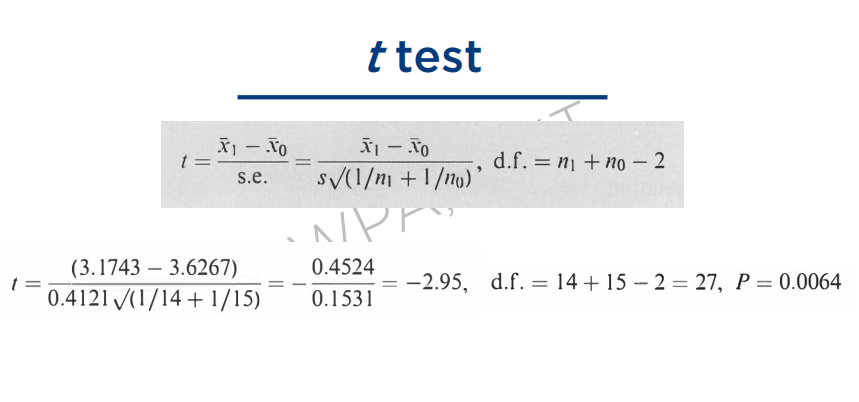
t test formula;
Your t is still derived the same way as your z is derived
The only difference is that, in computing for your s.e for your t test, you will always use the degrees of freedom.
Your t = -2.95
How will you find the value of your t?
We will not use the t-table anymore,
we cannot solve manually for p, so we need spss application to do it, so your p now is = 0.0064
Continuation
Let us try to disprove the null
null (H 0) = there is no significant difference between birthrate of children born to smokers and non smokers
p= 0.0064
Remember: the smaller the p value, the stronger the evidence is against the n 0 (null).
Question, what is our statistical p here? 0.05 because we used 95% Cl
We will not reject the null because 0.0064 is smaller than 0.005
There is a significant difference between the both weights of the children born to heavy smokers and non smokers.
But which among the two is reducing weight?
The heavy smokers.
Types of t test
Independent t test. compares means of two different groups (unpaired, two sample)
It is sometimes called as two sample t test.
It is two groups (Controlled, Treatment)
Studies one categorical variable.
One sample t test. compares a mean of one group to a specific or hypothetical value (Student’s t)
It is only one group, it could either be controlled or treatment.
To which group are we comparing our controlled or treatment group to?
Standard or hypothetical value.
Same as z
Paired sample t test. compares means of two different groups with two different categories (dependent).
Same as independent, it uses two groups but;
You are now comparing two categorical variables.
It is called as dependent because, those two variables which are comparing for each group, depend on each other.
In the study example, we can say that it is an independent t test, because it has a controlled, and treatment group.
But why independent? Why not paired?
Because you are only studying one categorical variable, that is the birth weight.