[MMW]: MODULE 2: DATA MANAGEMENT
1/46
There's no tags or description
Looks like no tags are added yet.
Name | Mastery | Learn | Test | Matching | Spaced |
|---|
No study sessions yet.
47 Terms
Descriptive Statistics
Deals with the organization, presentation, and analysis of data to describe, show, or summarize data in a meaningful way; includes measures of central tendency, variation, position, and graphical presentation.
Inferential Statistics
Concerned with making inferences from a sample and generalizing them to a population; involves comparing, testing hypotheses, and predicting outcomes.
Descriptive statistics summarize and present data, while inferential statistics use data to make predictions or generalizations about a larger population.
What is the difference between descriptive statistics and inferential statistics?
Data Presentation
summarizing, organizing, and communicating data using tables, diagrams, charts, and statistical graphs.
frequency distribution, line graph, bar graph, pie graph, and scatter plots.
Statistical tools (5)
Statistical graphs
used to determine patterns or trends of data.
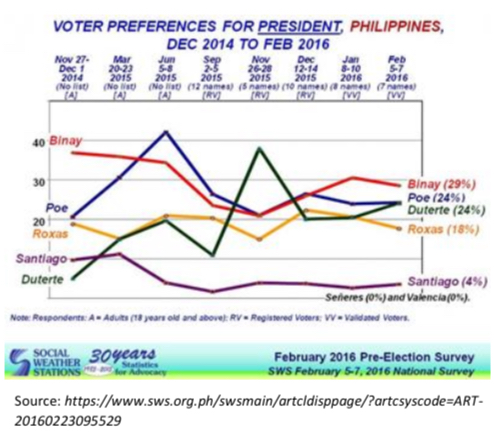
Time Series Graph
represents data over a specific period. It can be used to find out patterns or trends in the data. Two or more data sets can be compared.
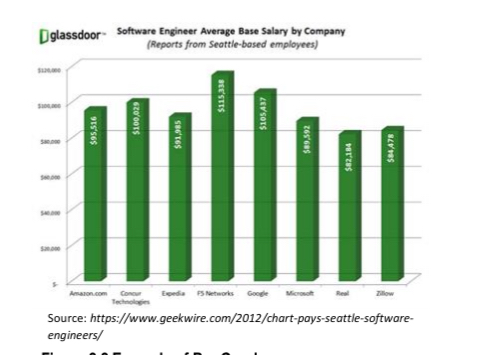
Bar Graph
uses horizontal or vertical bars whose heights or lengths represent frequencies. It can be used to compare the data for two or more groups.
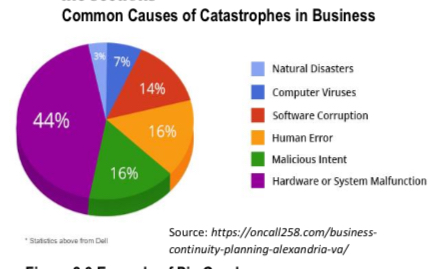
Pie Graph
a circular graph divided into sectors or wedges according to the percentage of the frequency. It can be used to show the relationship of the parts to the whole.
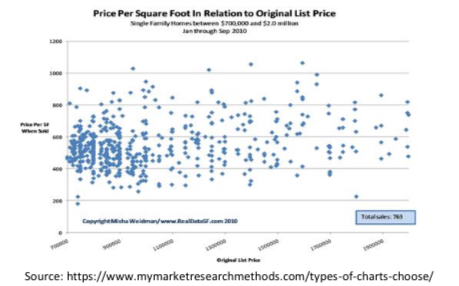
Scatter Plot
a graph of ordered pairs (x, y) that is used to describe the relationship between two variables.
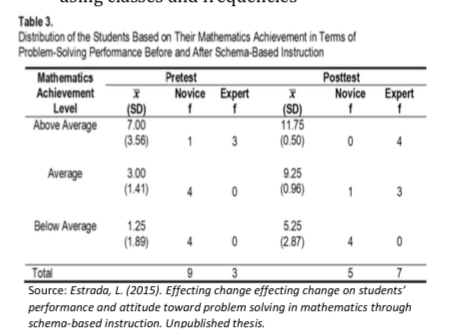
Frequency Distribution
organization of raw data in table form using classes and frequencies.
Parameter
a characteristic or measure obtained from all values in a population.
Statistic
a characteristic or measure obtained from the values of a sample of the population.
A parameter describes a whole population, while a statistic describes just a sample of that population.
What is the difference between parameter and statistic?
Mean (Arithmetic Average)
denoted by x̄ (sample ___) or μ (population ___). The ____ is computed by summing all the data values and dividing the sum by the number of values.
Weighted Mean
used when the values in a data set are not equally represented. Multiply each value by its corresponding weight, sum these products, and divide the sum by the sum of the weights.
Mode
the value that occurs most often in a data set. It is denoted by x̂. The data set can be unimodal (one mode), bimodal (two modes), multimodal (more than two modes), or have no mode at all.
Median
the middle value of a data set when the values are arranged in either ascending or descending order. It is denoted by x̃. If even number of values, the mean of the two middle values.
M, Mdn
In APA format, mean is symbolized by _ . Median is _.
Range (R)
the difference between the highest and lowest values in the data set.
Variance
the average of the squared distances of each value from the mean. Denoted by σ² for the population variance and s² for the sample variance.
Standard Deviation
the square root of the variance. Denoted by σ for the population _____ and s for the sample _____.
Hypothesis Testing
is a process in inferential statistics used to make decisions or draw conclusions from data. It’s like a court trial—assume something is true (null hypothesis) until evidence shows otherwise (alternative hypothesis).
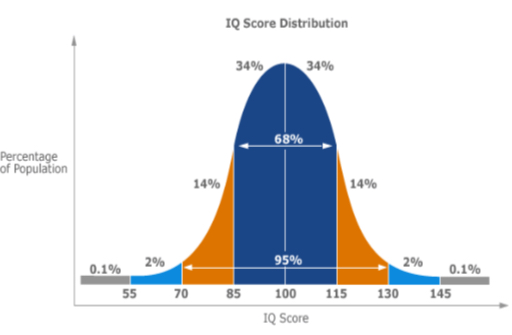
normal distribution
is a continuous, bell-shaped curve
One-tailed test
used when H₁ has > or <.
Two-tailed test
used when H₁ tests for difference (≠).
Nominal
Ordinal
Interval
Ratio
Scales of Measurement (5)
Nominal
Scales of Measurement: names/categories (e.g., shirt colors)
Ordinal
Scales of Measurement: ranked order (e.g., military ranks)
Interval
Scales of Measurement: equal spacing, no true zero (e.g., temperature °C)
Ratio
Scales of Measurement: equal spacing, true zero (e.g., weight, income)
Normality of data
Scale of measurement (nominal, ordinal, interval, ratio)
Purpose (relationship, comparison, difference)
Choosing a Statistical Test
The test depends on: (3)
1 State the null hypothesis and alternative hypothesis
2 Set the level of significance and determine the direction of the tests
3 Collect data
4 Calculate a test statistic and determine the critical value
5 Decide on the rejection or acceptance of null hypothesis
6 Draw a conclusion
Steps in Statistical Hypothesis Testing (6)
Hypothesis
is an assumption, a claim, or a proposed explanation for an observation or phenomenon.
Null Hypothesis
is a claim that indicates the absence of relationship or difference between two values, denoted by symbol Ho
Alternative Hypothesis
is a claim that indicates the presence of relationship or difference between values, denoted by symbol Ha or H1
Hypothesis Testing
is a decision-making process for evaluating or testing claims about a population based on information obtained from samples
Level of Significance
is the maximum probability of committing type I error, denoted by the Greek alphabet alpha (𝛼)
Type I Error
occurs when a true null hypothesis is rejected, a.k.a. Alpha error
Type II Error
occurs when a false null hypothesis is accepted or not rejected, a.k.a. Beta error
One-Tailed Test
is a test that indicates that the null hypothesis should be rejected when the test statistic value is in the critical region on one side of the mean, a.k.a. directional test
Two-Tailed Test
is a test that indicates the null hypothesis should be rejected when the test statistic value is in either of the two critical regions, a.k.a. non-directional test
Confidence Level
is the probability that a parameter lies within the specified interval estimate of the parameter
Critical Value
is a value that separates a critical region (rejection region) from acceptance region in a hypothesis test, usually presented in tables
Statistic
is a value obtained by using all data value of a sample from a population.
▪ Z-test for one sample mean
▪ T-test for one sample mean
▪ Paired t-test
▪ Independent t-test
▪ Pearson product moment correlation
coefficient or Pearson’s r
▪ Analysis of variance (ANOVA)
▪ Linear regression
Parametric Tests (7)
▪ Chi-square test
▪ Spearman rank correlation
▪ Wilcoxon sign-rank test
▪ Sign test
Nonparametric Tests (4)