Lab Methods Midterm
1/64
There's no tags or description
Looks like no tags are added yet.
Name | Mastery | Learn | Test | Matching | Spaced | Call with Kai |
|---|
No analytics yet
Send a link to your students to track their progress
65 Terms
M (molarity)
amount solute/volume solution
mol solute/L solution
F (formality)
= Molarity, used for strong electrolytes
mol solute/L solution
N (normality)
# equivalents solute/volume solution
# eq. solute/L solution
m (molality)
amount solute/mass solvent
mol solute/kg solvent
Mole (X)
mole A/total # moles
wt./wt.
mass A/total mass
wt./vol.
mass A/total Volume
vol./vol.
vol. A/total Volume
pph (Parts per hundred)
102 x wt./wt. fraction
102 x wt./vol. fraction
102 x vol./vol. fraction
ppm (Parts per million)
106 x wt./wt.
106 x wt./vol.
106 x vol./vol.
ppb (Parts per billion)
109 x wt./wt.
109 x wt./vol.
109 x vol./vol.
Chemical grades
Crude Grade< Technical Grade< Laboratory Grade< ACS Reagent Grade< Primary Standard Grade
Significant figures
Use scientific notation as necessary to avoid confusion
Final zeros to the right of the decimal place are significant
Spacer zero to the left of the decimal place are not significant unless there is a number before the decimal point
Significant figures for addition/subtraction
Number with fewest decimal places determines number of decimal places in answer (least number decimal places)
Significant figures for multiplication/division
Number with fewest significant figures determines number of significant figures in answer (least number significant figures)
Significant figures for multiple calculations
When multiple calculations must be carried out, carry all digits through the calculation and then determine the number of significant figures for the final answer (make decision at end)
Significant Figures for numbers with calculated uncertainty
The calculated uncertainty should determine the number of digits reported in the measured value (first significant digit in uncertainty)
Absolute Uncertainty
the margin of uncertainty associated with a given measurement (absolute does not equal absolute value)
=experimental value - accepted value (retain sign)
Relative Uncertainty
Compares size of absolute uncertainty to size of measurement itself
=absolute error/accepted value
Percent Relative Uncertainty
Relative uncertainty × 100
Determinate (systematic) error
Errors having a definite value and an assignable cause (ex. a flow or limitation of the equipment or experimental design). Results from replicate analyses are consistently high or consistently low.
Three main types of determinate error
Method error
Instrumental error
Personal error
Indeterminate (random) error
Uncontrolled variable(s) in the experiment. Equally likely to be positive (higher) as they are to be negative (lower)
Propagation of Error
When a measurement with an associated uncertainty is combined with another measurement with an associated uncertainty, we can calculate standard deviation, Sy for the result, y (standard deviation of a computed mathematical result)
Null hypothesis
difference between values is not statistically significant and can be explained by intermediate (random) error *ASSUMED TO BE TRUE UNLESS TEST INDICATES OTHERWISE*
Alternative hypothesis
difference is statistically significant and difference between values is too great to be explained by indeterminate error
Grubbs Test (calculation of G)
Can provide statistical support for rejection of a questionable measurement (detection of statistical outliers)
G calculated = |x questionable - mean|/s
G calculated > G tabular value
Questionable point may be discarded (alternative hypothesis supported)
F test (calculation of F)
Can indicate whether standard deviations (i.e./ precision) of two methods/sample populations are statistically different (comparison of precision of two sets of measurements)
F calculated = (s1)2 / (s2)2
*Larger standard deviation always in numerator so Fcalculated > 1*
Fcalculated> Ftable
Difference in precision is statistically significant (alternative hypothesis supported)
Confidence Interval
T test to compare mean with refence (true/known/accepted) value (comparison of measured value to reference value)
Confidence interval= mean±(ts/√n)
Does reference value fall within 95% confidence interval range?
Yes= Difference between mean and true value can be attributed to random error. Difference is not statistically significant.
No= Difference between mean and true value cannot be attributed to random error. Difference between mean and true value is statistically significant.
Comparison of Two Means
T test to compare two mean values with similar precision
Use tcalc and sspooled
Degrees of freedom for this= n1+n2 — 2
Comparing individual differences (paired data)
When you have obtained a measurement for several samples using two different methods (“paired data”) and you want to determine whether the difference between the individual measurements using the two methods is statistically significant.
d (has a line over top of it)= average of differences in methods for different samples
sd= √(∑(di−d)²/n-1))
Comparison of two means (T-test to compare two mean values with similar precision)
Function in excel= t Test: Two-sample Assuming Equal Variances
Compare: t Critical two-tail (tabular value) to t stat (calculated value)
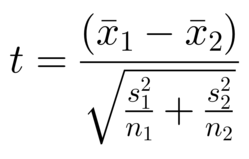
Comparison of two means (T-test to compare two mean values with different precision)
Function in Excel: = t Test: Two-Sample Assuming Unequal Variances
Compare: t Critical two-tail (tabular value) to t Stat (calculated value)
Comparing individual differences — Paired data (T test for paired data)
Function in Excel: = t-test Paired 2 sample for means
Compare: Absolute value of t critical two-tail (tabular value) to t stat (calculated value)
Main types of gravimetric analysis
Precipitation:
Reaction to form solid
Weigh the product and use the stoichiometric ratio to determine amount of analyte
Volatilization/Combustion:
Reaction to form volatile product
Weigh volatile product or weigh difference in sample to get weight of analyte
Precipitation Method
Preparation of the solution
Chemical conversion of analyte to a sparingly soluble OR insoluble precipitate
Digestion
Filtration
Washing
Drying
Weighing
Crystal Growth
Need supersaturated solution (more dissolved solute then present at equilibrium) for crystal growth
Crystallization:
Nucleation— solute forms cluster then reorganizes into ordered structures
Particle growth— other molecules etc. condense onto nucleation site to create larger crystals, this is called Ostwald ripening
Digestion— After precipitation, heat reaction and allow to sit, slow recrystallization and expulsion of impurities
Volatilization (direct method)
Ignite sample
Collect water or other analyte of interest on solid desiccant or absorbent
Measure mass gain of desiccant or absorbent
Volatilization (indirect method)
React to form volatile product
Find difference in weight after release of volatile product
*Used most commonly to determine amount of water, carbon dioxide, sulfides and sulfites, carbon and hydrogen*
Accuracy
how close a measurement is to the true or accepted value
Precision
how close measurements of the same item are close to each other
% relative standard deviation ( aka Coefficient of variation)
%RSD or CV= s/mean ×100%
Standard error
SE= s/√n
Variance
s²
95% confidence interval formula
95% CI= ts/√n
Relative Standard Deviation
RSD= s/mean
Spread (or range)
difference between maximum and minimum value in a data sheet
Random sampling
Collected at random from target population
Judgmental Sampling
Opposite of random sampling. Use info to ID specific sampling locations
Systematic Sampling
sampling at specific intervals in space (and/or time)
Systematic-Judgmental Sampling
sampling that combines systematic and judgmental sampling
Stratified Sampling (aka Random-Judgmental Sampling)
Sampling combining random and judgmental sampling
Convenience Sampling
selecting areas that are easy to sample
Grab/selective Sampling
removing a portion of the bulk at a given time
Composite Sampling
Combining samples to have enough material
In situ Sampling
sample collected in real time
101
10²
10³
10⁶
10⁹
10¹²
10¹⁵
10¹⁸
10²¹
10²⁴
deca (da-)
hecto (h-)
kilo (k-)
mega (M-)
giga (G-)
tera (T-)
peta (P-)
exa (E-)
zetta (Z-)
Yotta (Y-)
10⁻¹
10⁻²
10⁻³
10⁻⁶
10⁻⁹
10⁻¹²
10⁻¹⁵
10⁻¹⁸
10⁻²¹
10⁻²⁴
deci (d-)
centi (c-)
milli (m-)
micro (µ-)
nano (n-)
pico (p-)
femto (f-)
atto (a-)
zepto (z-)
yocto (y-)
Typical Steps in Analytical Chemistry
Formulation of Question
Selection of Analytical Tools and Procedures
Sample Collection
Sample Preparation
Measurement and Analysis
Interpretation and Reporting, Drawing Conclusions
Preparing solution from Solid
1. Based on desired concentration and volume, determine amount of reagent required.
2. Obtain high purity, reagent grade solid. [In an oven, dry solid in a weighing bottle to
remove adsorbed impurities. Cool in a desiccator.]
3. Accurately weigh by difference ~calculated mass on balance; record actual mass.
4. Quantitatively transfer solid to a clean (wet) volumetric flask of the desired volume.
5. Fill the flask ~halfway with solvent. Swirl and gently shake to dissolve the solid.
6. Fill the flask to the bottom of the neck. Use a wash bottle or dropper to slowly add
solvent until the bottom of the meniscus reaches the mark.
7. Invert carefully 10-20 times. (Vent if necessary to release pressure.)
8. Transfer to a storage bottle that has been rinsed with several aliquots of the solution.
9. Calculate actual concentration based on measured mass.
10. Label the bottle with important info: [Concentration With units], substance, solvent,
preparation, date prepared, your name or initials
Preparing a Solution by Dilution
Calculate the volume of concentrated solution that needs to be
transferred based on desired molarity (mol/L) and volume.
C1 V1 =C2 V2Usually not necessary to prepare an exactly specified
concentration—it is more important that the concentration be
measured precisely. Use analytical pipet to quantitatively deliver
stock solution into volumetric flask of desired volume.*Fill volumetric flask and invert as previously described.
Transfer to a storage bottle.
Calculate the actual concentration.
Label the bottle as previously described.
Chemical Handling
Do not contaminate samples by putting a spatula, pipet, or anything
into the bottle. Do not return unused chemical to the bottle.Keep bottles and flasks capped and beakers covered, and pay
attention to special instructions for storing (e.g., sensitive to light)Double check the label and MSDS before using chemical.
Assume that all chemicals contain significant impurities absorbed from
air. Drying (at ~110 °C) for several hours or overnight is often (but not
always) appropriate before use. Learn how to properly use
desiccators, desiccants, and weighing bottles when needed.Be neat—clean up spills immediately.
Adhere to waste treatment/disposal regulations.