GCSE Economics - Micro
0.0(0)
Card Sorting
1/188
Earn XP
Description and Tags
Last updated 10:36 AM on 11/17/22
Name | Mastery | Learn | Test | Matching | Spaced | Call with Kai |
|---|
No analytics yet
Send a link to your students to track their progress
189 Terms
1
New cards
Good
A tangible product which satisfies wants and needs.
2
New cards
Service
An intangible product which satisfies wants and needs.
3
New cards
Why do consumers buy goods?
Customers do this to satisfy their want and needs and for their own personal use
4
New cards
Consumer
- People who buy goods and services for their own personal use only.
- They are the last part in a good's "life".
- They act individually.
- They are the last part in a good's "life".
- They act individually.
5
New cards
Producer
- A person, company or country that make, grows or supplies goods and/or services by combing factors of production.
- They can influence everything about a good, including price and quality.
e.g. A farmer grows and supplies crops to consumers or other producers.
- They can influence everything about a good, including price and quality.
e.g. A farmer grows and supplies crops to consumers or other producers.
6
New cards
Government
- A political authority that decides how a country is run and managed through rules and policies that affect the economy: e.g. taxes
7
New cards
How do governments invest into an economy?
Through public services and benefits
8
New cards
Interdependence
- When one group reacts to what another group does.
- They all rely on eachother for goods or services...etc
- They all rely on eachother for goods or services...etc

9
New cards
Factors of Production
- Resources used in the production process of goods or services.
Capital
Enterprise
Land
Labour
- CELL
Capital
Enterprise
Land
Labour
- CELL
10
New cards
Land
- the NATURAL resources used for production, e.g. oil, trees, or actual land.
- It's income is RENT
- It's income is RENT
11
New cards
Labour
- the HUMAN resources that can be used.
- This depends on population size, working age and quality/skill.
- It's income is LABOUR
e.g. if workforce skill increases, economy strengthens.
- This depends on population size, working age and quality/skill.
- It's income is LABOUR
e.g. if workforce skill increases, economy strengthens.
12
New cards
Capital
- MAN-MADE resources, like tools and machinery to aid production of another good
-It's income is INTEREST
e.g. a robot machine
-It's income is INTEREST
e.g. a robot machine
13
New cards
Enterprise
- It takes an organisation or individual to organise and put together factors of production together to make goods or services.
- This involves taking risks and making decisions to further the production.
- This involves taking risks and making decisions to further the production.
14
New cards
How has use of capital and labour changed?
The use of labour, once largely used in the 20th century, has fallen as technological advances have resulted in capital making production cheaper and more efficient.
e.g. Labour use in cars has declined as capital (machines) have replaced them.
e.g. Labour use in cars has declined as capital (machines) have replaced them.
15
New cards
How are factors of production combined?
- An entrepreneur bears the risk and takes forward a business idea.
- The entrepreneur decides on the quantities of the various factors of production to combine and organise them during production
- Goods and services are produced.
- The entrepreneur decides on the quantities of the various factors of production to combine and organise them during production
- Goods and services are produced.
16
New cards
Basic Economic Problem
- How to best use limited resources to satisfy unlimited wants

17
New cards
Scarce Resources
When there is an insufficient amount of something to satisfy all wants.
18
New cards
Unlimited Wants
The infinite desire for something.
19
New cards
Need
Something a consumer MUST have to survive, like food
20
New cards
Want
Something a consumer would like to have, but is not essential to survival
21
New cards
Economic Problem - Government
- The government produces what is necessary to stimulate the economy and help the country.
- The government provides goods and services that it deems important for people who need it.
- The government provides goods and services that it deems important for people who need it.
22
New cards
Economic Problem - Firms
- Private firms make decisions based on what it thinks consumers will buy.
- They look for the highest price and lowest cost.
- Private firms allocate goods and services to people who can afford to buy them.
- They look for the highest price and lowest cost.
- Private firms allocate goods and services to people who can afford to buy them.
23
New cards
Opportunity Cost
- The next best alternative GIVEN UP when making an economic choice.
- These choices are constrained by scarce resources like money and time.
- These choices are constrained by scarce resources like money and time.
24
New cards
Economic Choice
An option for the use of different scarce resources
25
New cards
Economic Sustainability
The best use of resources in order to create responsible development or economic growth, now and into the future.
26
New cards
Social Sustainability
The impact of development or growth that promotes an improvement in quality of life for all, now and into the future.
27
New cards
Environmental Sustainability
The impact of development or growth where the effect on the environment is small and possible to manage, now and into the future.
28
New cards
Market
A physical or virtual place where buyers and sellers meet to buy and sell goods and services.
e.g. physical market, an auction, a shop
e.g. physical market, an auction, a shop
29
New cards
Primary Sector
the direct use of natural resources, such as the extraction of basic materials / goods from land and sea.
Products are tangible. (goods)
Products are tangible. (goods)
30
New cards
Secondary Sector
All activities in an economy that are concerned with either manufacturing or construction.
Products are tangible. (goods)
Products are tangible. (goods)
31
New cards
Manufacturing
- Direct use of raw materials (from primary sector) such as making wooden chairs or cheese.
OR
- Indirect use of materials, such as making parts of a car or phone parts.
OR
- Indirect use of materials, such as making parts of a car or phone parts.
32
New cards
Tertiary Sector
All activities in an economy where services are provided, and involve the idea of a service.
Products are intangible.
e.g. haircut
Products are intangible.
e.g. haircut
33
New cards
Factor Market
- A market where the services of the factors of production are bought and sold.
- Households supply and firms demand e.g labour
- Price determines the cost for firms and income for households
- Households supply and firms demand e.g labour
- Price determines the cost for firms and income for households
34
New cards
Product Market
- A market where final goods / services are offered to
consumers
- Households demand and firms supply
- Price determines revenue for firms and expenditure for households
consumers
- Households demand and firms supply
- Price determines revenue for firms and expenditure for households
35
New cards
Division of Labour
Where workers specialise in, or concentrate on one area of the production process.
36
New cards
Why does division of labour work?
- Increased productivity
- Higher efficiency due to repetition
- Lower unit per cost
- Higher efficiency due to repetition
- Lower unit per cost
37
New cards
Potential problems from division of labour?
- Repetition can lead to boredom so workers change job
38
New cards
Specialisation
The process by which individuals, firms, regions and countries concentrate on producing products that they are best at.
e.g. Ivory Coast mostly produces cocoa
e.g. Ivory Coast mostly produces cocoa
39
New cards
Exchange
- The giving up of something that the individual or firm has, in return for something they want but don't have.
- Needed because specialisation creates surplus that needs to be exchanged
- Needed because specialisation creates surplus that needs to be exchanged
40
New cards
Benefits of specialisation for PRODUCERS
- Workers who specialise in one task become skilled in it, so productivity increases.
- Producers can focus resources on one task, increasing quality of products.
- Output increases
- Larger output allows the firm to gain economies of scale.
- Producers can focus resources on one task, increasing quality of products.
- Output increases
- Larger output allows the firm to gain economies of scale.
41
New cards
Costs of specialisation for PRODUCERS
- As the output increases costs can rise as more resources are needed and may become scarce.
- Production depends on all parts/processes fully functioning. A strike will be disastrous.
- Exchange can fail if it is not possible to purchase the required parts.
e.g. too expensive
- Workers can become bored and leave the job.
- Production depends on all parts/processes fully functioning. A strike will be disastrous.
- Exchange can fail if it is not possible to purchase the required parts.
e.g. too expensive
- Workers can become bored and leave the job.
42
New cards
Benefits of specialisation for WORKERS
- By specialising, workers become more trained and fluent about their work. This can result in a rise in pay.
- Workers do what they're best at, results in job satisfaction.
- By earning more money, workers can purchase goods to satisfy their needs and wants.
- Workers do what they're best at, results in job satisfaction.
- By earning more money, workers can purchase goods to satisfy their needs and wants.
43
New cards
Costs of specialisation for WORKERS
- Boredom from doing the same thing a lot.
- Workers lose the skills to do other types of work, and therefore cannot respond to changes in demand.
- A fall in demand can cause trouble for workers as they don't have other skills / experience.
- Workers lose the skills to do other types of work, and therefore cannot respond to changes in demand.
- A fall in demand can cause trouble for workers as they don't have other skills / experience.
44
New cards
Benefits of specialisation for REGIONS
- Regions can specialise in an industry because of an availability of resources, so it can be used efficiently.
- Residents can find the work locally and near their homes.
- Regions that specialise will develop infrastructure and supply industries to support that specific industry. This leads to development.
- Residents can find the work locally and near their homes.
- Regions that specialise will develop infrastructure and supply industries to support that specific industry. This leads to development.
45
New cards
Costs of specialisation for REGIONS
- If demand for the good falls, the industry will subsequently collapse.
- Resource exhaustion: if raw materials are no longer available, then people employed to extract the materials will become unemployed.
- Another region or country may produce goods faster and supply them at a lower price, leading to unemployment.
- Resource exhaustion: if raw materials are no longer available, then people employed to extract the materials will become unemployed.
- Another region or country may produce goods faster and supply them at a lower price, leading to unemployment.
46
New cards
Benefits of specialisation for COUNTRIES
- Economies of scale: countries do what they do best, leading to greater efficiency and increased output.
- Increasing output creates more jobs and therefore further investment, leading to higher income and a more skilled workforce.
- Can lead to international trade as the country specialises on producing the goods that they are good at, so they need other goods and services from others.
- Improved standard of living as there is higher income.
- Increase in output and income leads to greater tax revenue and therefore better public services.
47
New cards
Costs of specialisation for COUNTRIES
- Specialisation can destroy jobs too, as workers without the necessary skills cannot find jobs.
- A country can become over dependent on the production of the goods it specialises in. If demand changes, the entire economy can collapse.
- Increasing output results in over-exploitation of resources, leading to unsustainability and environmental damage.
- A country can become over dependent on the production of the goods it specialises in. If demand changes, the entire economy can collapse.
- Increasing output results in over-exploitation of resources, leading to unsustainability and environmental damage.
48
New cards
Demand
The willingness and ability to purchase a good or service at the given price in a given time period.
49
New cards
Law of Demand
For most products, the quantity demanded varies inversely with its price.
(As price increases, quantity demanded decreases)
(As price increases, quantity demanded decreases)
50
New cards
Derived Demand
When a product or factor of production is not demanded for specifically, but is dependant on the demand of the product it helps to produce.
e.g. Apple purchases factors of production in order to manufacture its devices.
If it stops, the demand of the factors of production fall.
e.g. Apple purchases factors of production in order to manufacture its devices.
If it stops, the demand of the factors of production fall.
51
New cards
Individual Demand
The demand for a good or service by an individual customer.
52
New cards
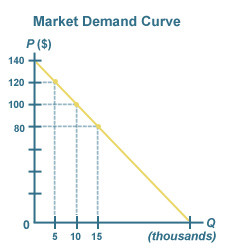
Market Demand
The total demand for a good or service, found by adding together all individual demands.
53
New cards
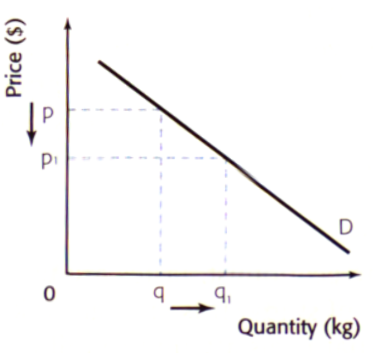
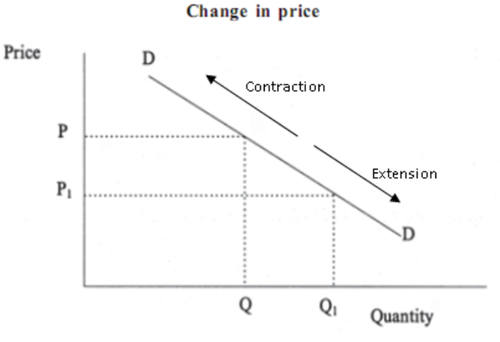
Demand Curve
P = Price
Q = Quantity Demanded
D = Demand
As price increases, quantity demanded decreases
Q = Quantity Demanded
D = Demand
As price increases, quantity demanded decreases
54
New cards
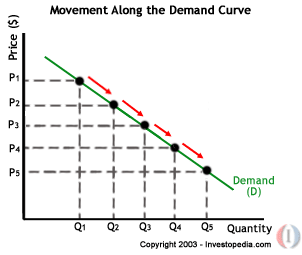
Movements along the demand curve
Only price causes movements along the demand curve.
A movement down the demand curve is called an expansion.
A movement up the demand curve is called a contraction.
A movement down the demand curve is called an expansion.
A movement up the demand curve is called a contraction.
55
New cards
Expansion of Demand
When quantity demanded increases due to a fall in price.
This is shown as a downward movement on the demand curve.
This is shown as a downward movement on the demand curve.

56
New cards
Contraction of Demand
When quantity demanded decreases due to a rise in price.
This is shown as a upward movement on the demand curve.
This is shown as a upward movement on the demand curve.
57
New cards
Shifts of the demand curve
Different factors cause shifts in the demand curve.
(PASIFIC)
An increase in demand is shown by a rightward shift of the demand curve, as both the price and quantity increase.
A decrease in demand is shown by a leftward shift of demand curve, as both the price and quantity decrease.
(PASIFIC)
An increase in demand is shown by a rightward shift of the demand curve, as both the price and quantity increase.
A decrease in demand is shown by a leftward shift of demand curve, as both the price and quantity decrease.
58
New cards
Causes of shifts of the demand curve
P - Population
A - Advertising
S - Substitutes
I - Income
F - Fashions/trends
I - Interest Rates
C - Complements
A - Advertising
S - Substitutes
I - Income
F - Fashions/trends
I - Interest Rates
C - Complements
59
New cards
PASIFIC - Population
- There can be three aspects to consider, size, age, and gender.
- For example, as a population ages, there likely will be an increase in demand of the goods older people like.
- For example, as a population ages, there likely will be an increase in demand of the goods older people like.
60
New cards
PASIFIC - Substitutes
- These are goods and services that can make up for/be used in place of one another.
- For example, if the price for the Xbox One increases, demand for the PS4 will increase.
- For example, if the price for the Xbox One increases, demand for the PS4 will increase.
61
New cards
PASIFIC - Income
- As income for people increases, they have more purchasing power and demand for goods increases.
- Also, if income is unevenly distributed and poverty increases, demand for basic products will increase.
- Also, if income is unevenly distributed and poverty increases, demand for basic products will increase.
62
New cards
PASIFIC - Fashions
- Over time, the taste of consumers change, so some products lose demand as become unpopular and other products quickly increase in demand.
- iPhone 3 to the iPhone 7
- iPhone 3 to the iPhone 7
63
New cards
PASIFIC - Interest Rates
- As interest rates, people are more likely to save more and spend less, an vice versa.
64
New cards
PASIFIC - Complements
- These are goods and services that go together, like fish and chips. If demand goes up for one, then so does the demand for the other.
65
New cards
Rightward shift of the demand curve
An INCREASE in demand is shown by a rightward shift of the demand curve, as both the price and quantity increase.
66
New cards
Leftward shift of the demand curve
A DECREASE in demand is shown by a leftward shift of demand curve, as both the price and quantity decrease.
67
New cards
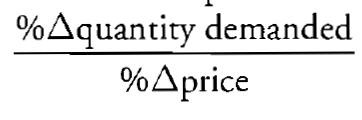
Price Elasticity of Demand
The responsiveness of quantity demanded to a change in price.
PED = %Q/%P
There are two types of demand curves:
- Elastic (PED more than 1)
- Inelastic (PED less than 1)
PED = %Q/%P
There are two types of demand curves:
- Elastic (PED more than 1)
- Inelastic (PED less than 1)

68
New cards
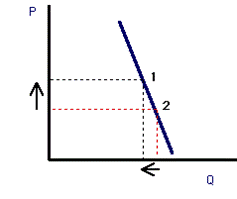
Inelastic Demand Curve
When the percentage change in price leads to a SMALLER percentage change in quantity demanded.
PED is less than 1.
Using the formula:
PED = Qd / P
= LARGE / SMALL
= < 1
PED is less than 1.
Using the formula:
PED = Qd / P
= LARGE / SMALL
= < 1
69
New cards
Elastic Demand Curve
When a given percentage change in price leads to a LARGER percentage change in quantity demanded.
PED is more than 1.
Using the formula:
PED = Qd / P
= SMALL / LARGE
= > 1
PED is more than 1.
Using the formula:
PED = Qd / P
= SMALL / LARGE
= > 1
70
New cards
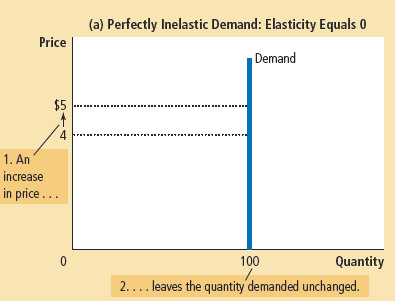
Perfectly Inelastic Demand Curve
A completely vertical demand curve showing price having no effect on quantity demanded.
The PED is 0.
(PED = 0 / %P)
The PED is 0.
(PED = 0 / %P)
71
New cards
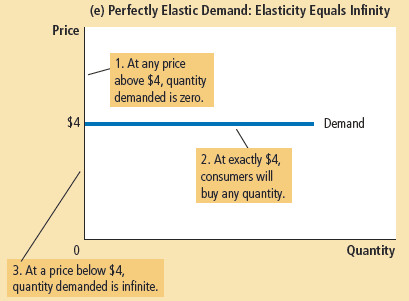
Perfectly Elastic Demand Curve
A completely horizontal demand curve showing an increase in price causing no quantity to be demanded.
The PED is ∞.
(PED = %Qd / 0)
The PED is ∞.
(PED = %Qd / 0)
72
New cards
Importance of PED for CONSUMERS
- Consumers purchasing goods with inelastic demand are affected by this, as governments know that they can impose taxes on the product and not suffer drawbacks as consumers will continue to buy the product.
- e.g. cigarettes
- This is also used by railway companies, which raise prices during rush hour, when tickets have inelastic demand.
- e.g. cigarettes
- This is also used by railway companies, which raise prices during rush hour, when tickets have inelastic demand.
73
New cards
Importance of PED for PRODUCERS
- PED allows producers to make decisions based on the elasticity on the product they are supplying.
- If the product is price inelastic, producers can raise the price, as the decease in quantity demanded is less than the raise and therefore more revenue is earned.
- If the product is price elastic, producers lower the price, as the increase in quantity demanded is greater than the decrease in price, so more revenue is earned.
74
New cards
Price Discrimination
The division of consumers into groups based on how much they will pay for a good.
e.g. Peak times and off-peak times
e.g. Peak times and off-peak times
75
New cards
Primary Product Dependency
- This is where developing countries rely heavily on the exports of primary products such as ores or agricultural goods.
- This is bad as primary products are unsustainable in the long term, and a fall in price can mean the country is heavily affected.
- This is bad as primary products are unsustainable in the long term, and a fall in price can mean the country is heavily affected.

76
New cards
Supply
The ability and willingness of firms to provide goods and services at each price in a given time period.

77
New cards
Law of Supply
For most products, the quantity supplied varies directly with its price.

78
New cards
Individual Supply
The supply of a good or service by an individual producer
79
New cards
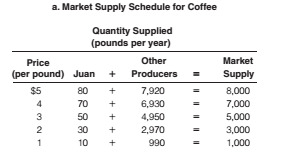
Market Supply
The total supply of a good or service as a result of adding together all individual producer's supplies.
80
New cards
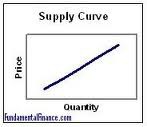
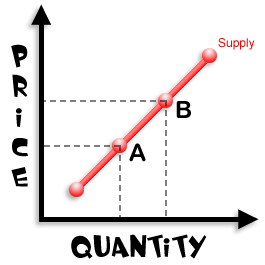
Supply Curve
P = Price
Q = Quantity Supplied
S = Supply
As price increases, quantity supplied increases.
Q = Quantity Supplied
S = Supply
As price increases, quantity supplied increases.
81
New cards
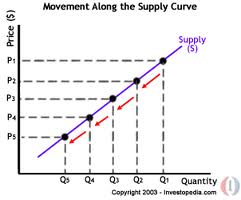
Movements along the supply curve
Only price causes movements along the supply curve.
A movement up the supply curve is called an expansion.
A movement down the supply curve is called a contraction.
A movement up the supply curve is called an expansion.
A movement down the supply curve is called a contraction.
82
New cards
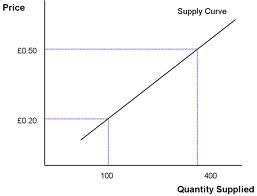
Expansion of Supply
An increase in quantity supplied due to a rise in price is shown as an upward movement on the supply curve.
Both the quantity supplied and price of the product increase.
Both the quantity supplied and price of the product increase.
83
New cards
Contraction of Supply
A decrease in quantity supplied due to a fall in price is shown as a downward movement on the supply curve.
Both the price and quantity of the product fall.
Both the price and quantity of the product fall.
84
New cards
Shifts of the supply curve
Different factors cause shifts of the supply curve.
(PINTS WC)
An increase in supply is shown by a rightward shift of the supply curve, as the price falls and quantity supplied increases.
A decrease in supply is shown by a leftward shift of the supply curve , as the price rises and quantity supplied decreases.
(PINTS WC)
An increase in supply is shown by a rightward shift of the supply curve, as the price falls and quantity supplied increases.
A decrease in supply is shown by a leftward shift of the supply curve , as the price rises and quantity supplied decreases.
85
New cards
Causes of shifts of the supply curve
P - Productivity
I - Indirect Taxes
N - Number of Firms
T - Technology
S - Subsidies
W - Weather (agriculture)
C - Costs of Production
I - Indirect Taxes
N - Number of Firms
T - Technology
S - Subsidies
W - Weather (agriculture)
C - Costs of Production
86
New cards
PINTS WC - Indirect Taxes
- An indirect tax on the product a producer is supplying would lead to a rise in costs and therefore a fall in quantity supplied at each price.
87
New cards
PINTS WC - Number of Firms
- An increase in the number of firms or the size of existing firms would mean an increase in supply, shifting the supply curve rightward.
88
New cards
PINTS WC - Technology
- New technology can lower costs of production and allow more to be supplied at a lower cost.
89
New cards
PINTS WC - Subsidies
- If a firm recieves a government subsidy, it would allow more to be supplied at every price, leading to a rightward shift in the supply curve.
90
New cards
PINTS WC - Weather
- Different weather conditions can affect the supply from the agricultural sector. For example, if there is a drought, supply of different crops would fall.
91
New cards
PINTS WC - Costs of Production
- If costs of production in a firm increase, it means they are unable to supply as much as before at the same price and therefore supply decreases, and vice versa.
92
New cards
Effects of shifts of the supply curve
Economies of scale - As a firm is able to supply more at every price, economies of scale occur and average costs of production fall. This is to higher profits.
Efficiency - Being able to produce more with the same resources leads to higher productivity and efficiency.
Sales - Being able to supply more at a lower price leads to greater sales.
Exports - All of the above would make a firm more competitive and increase its ability to export successfully.
Monopoly - As it becomes more competitive through lowering prices...investment...etc, it can drive rivals out of the market, forming a monopoly.
93
New cards
Rightward shift of the supply curve
An INCREASE in supply is shown through a rightward shift of the supply curve, as the price falls and quantity supplied of the product increases.
94
New cards
Leftward shift of the supply curve
A DECREASE in supply is shown through a leftward shift of the demand curve, as the price rises and quantity supplied of the product falls.
95
New cards
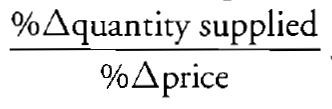
Price Elasticity of Supply
The responsiveness of quantity supplied to a change in price.
PES = %Qs / %P
There are two types of supply curves:
- Elastic (PES more than 1)
- Inelastic (PES less than 1)
PES = %Qs / %P
There are two types of supply curves:
- Elastic (PES more than 1)
- Inelastic (PES less than 1)
96
New cards
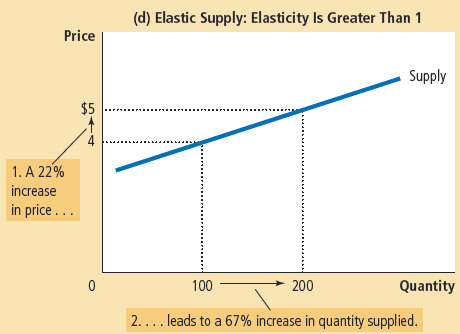
Elastic Supply Curve
When the percentage change in quantity supplied is greater than the percentage change in price.
Using the formula:
PES = %Qs / %P
PES = LARGE / SMALL
= more than 1
Using the formula:
PES = %Qs / %P
PES = LARGE / SMALL
= more than 1
97
New cards
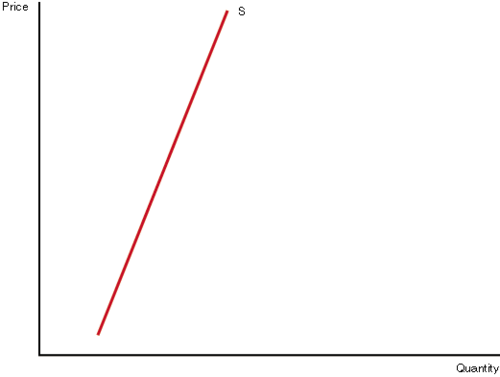
Inelastic Supply Curve
When the percentage change in quantity supplied is less than the percentage change in price.
Using the formula:
PES = %Qs / %P
PES = SMALL / LARGE
= less than 1
Using the formula:
PES = %Qs / %P
PES = SMALL / LARGE
= less than 1
98
New cards
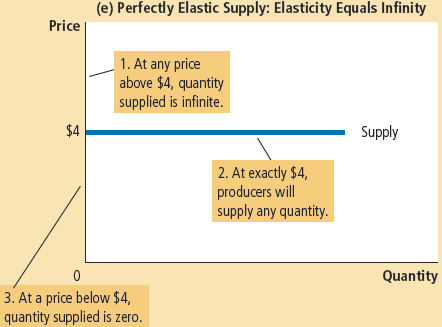
Perfectly Elastic Supply Curve
A completely horizontal supply curve showing an increase in price causing no quantity to be supplied.
The PES is ∞.
(PES = %Qs / 0)
The PES is ∞.
(PES = %Qs / 0)
99
New cards
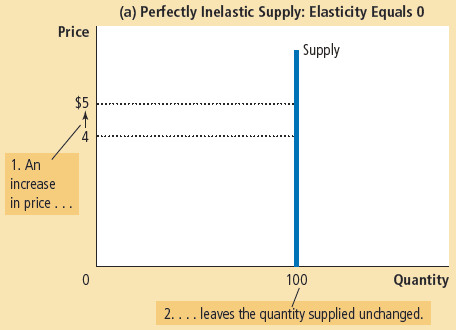
Perfectly Inelastic Supply Curve
A completely vertical supply curve showing price having no effect on quantity supply.
The PES is 0.
(PES = 0 / %P)
The PES is 0.
(PES = 0 / %P)
100
New cards
Effects of PES for CONSUMERS
- If the PES is inelastic, this means consumers will find it harder to get a larger quantity of the product without paying a lot more.
- If the PES is elastic, this means consumers will find it easier to find more of the product, however there will likely be less price negotiation.
- If the PES is elastic, this means consumers will find it easier to find more of the product, however there will likely be less price negotiation.