RMA Week 9: Correlations and Chi-squared
1/35
Earn XP
Description and Tags
Name | Mastery | Learn | Test | Matching | Spaced |
|---|
No study sessions yet.
36 Terms
what do scatterplots do?
display relations between two quantitative variables (and display correlations)
what’s the purpose of a correlation analysis?
to determine…
whether there’s a linear relationship between two variables (no curved lines of best fit!)
the direction of the relationship
the strength of the relationship
for Pearsons (r) and Spearmans correlation coefficient (r-mini down ‘s’), where do the values lie?
between -1 and 1
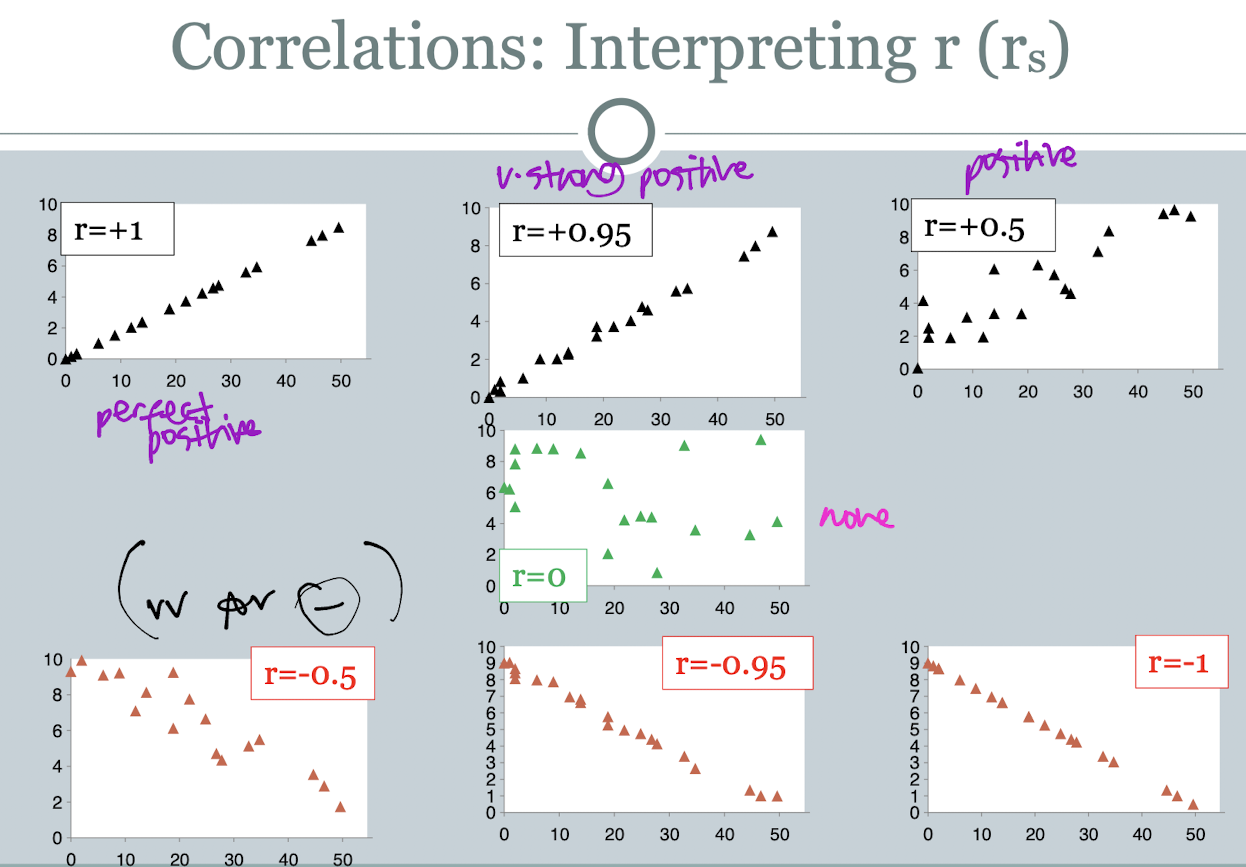
what are the different ways you can interpret r (rs)?
perfect positive +1, v.strong positive +0.95, positive +0.5, none 0, vv for negative correlations
do correlations make a distinction between the IV and DV?
no
what happens to the correlation coefficient if we change the units of measurement?
it doesn’t change
what might we need to do if the data is curved and non-linear?
transform the data
describe the pearson r correlation coefficient
calcuated directly from the raw scores
suitable for interval or ratio data
advantage of pearson r correlation coefficient
it’s more powerful, try to carry it out more often
disadvantages of pearson r correlation coefficient
highly affected by outliers
not suitable for skewed data
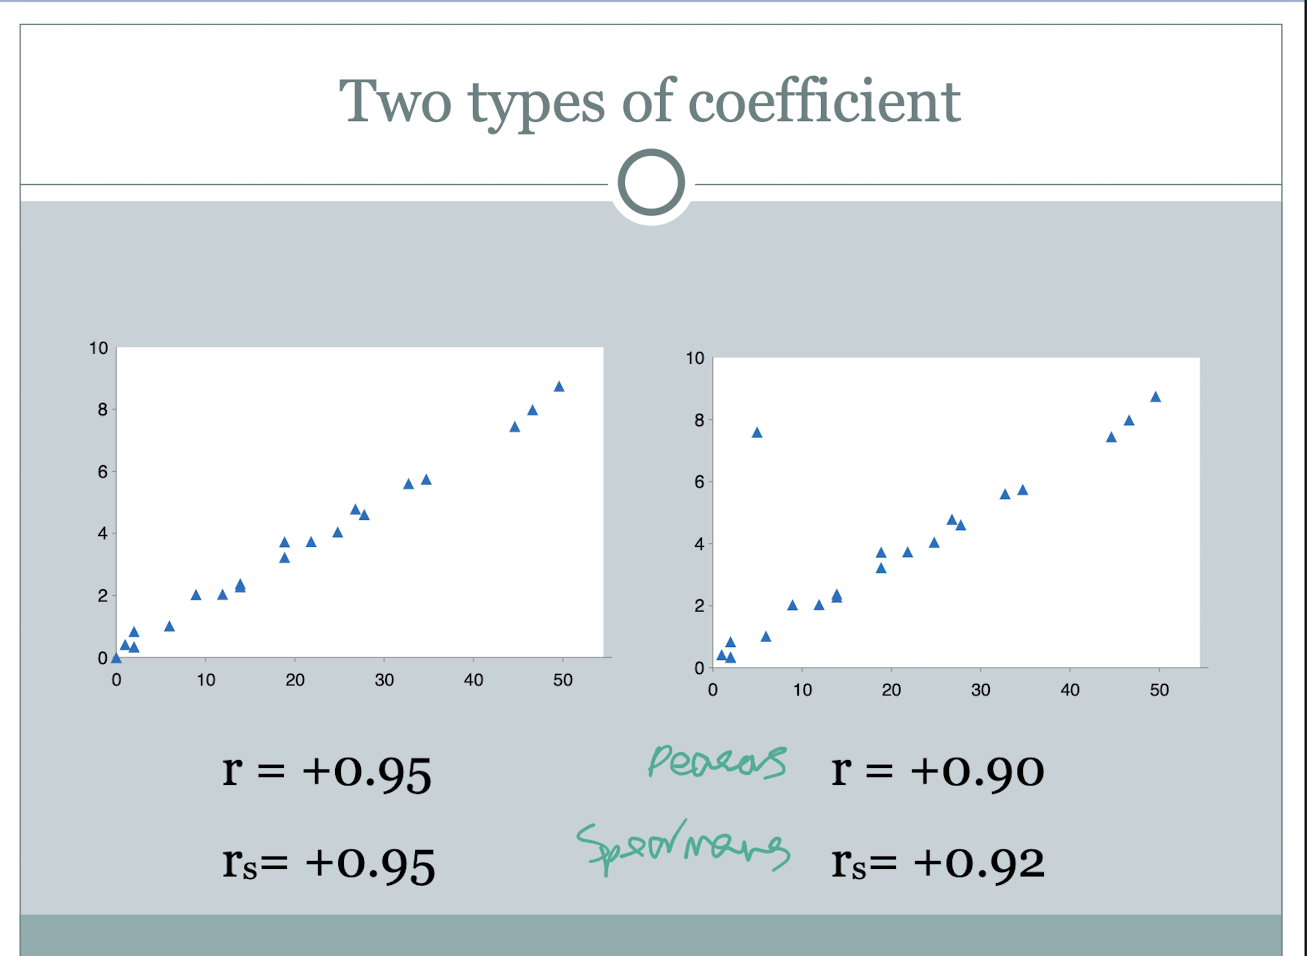
describe spearman rs correlation coefficient
calcuated from the ranking of the raw scores
suitable for ordinal data
advantages of spearman rs correlation coefficient
marginally affected by outliers
suitable for skewed data
what can we conclude from a correlation coefficient regarding sample size?
when n is low, pattern may arise without real relationship.
when n is higher (e.g. 10), pattern is unlikely to arise without a real relationship
is chi-square parametric or non-parametric?
non-parametric
what are the two types of chi-2 tests?
the goodness of fit test (GF)
the test of independence (TI), (transforms nominal to categorical data)
describe parametric tests
they test for significant differences between data sets
they make assumptions about population parameters (i.e. are distribution dependent)
they require interval or ratio data
what happens in parametric tests if the tests assumptions are violated?
erroneous interpretations of data
describe non-parametric tests
they test for significant differences between data sets
they make no assumptions about population parameters (i.e. are distribution-free tests)
they use nominal data
advantage of using non-parametric tests
they’re more robust
disadvantage of non-parametric tests
they’re not as powerful
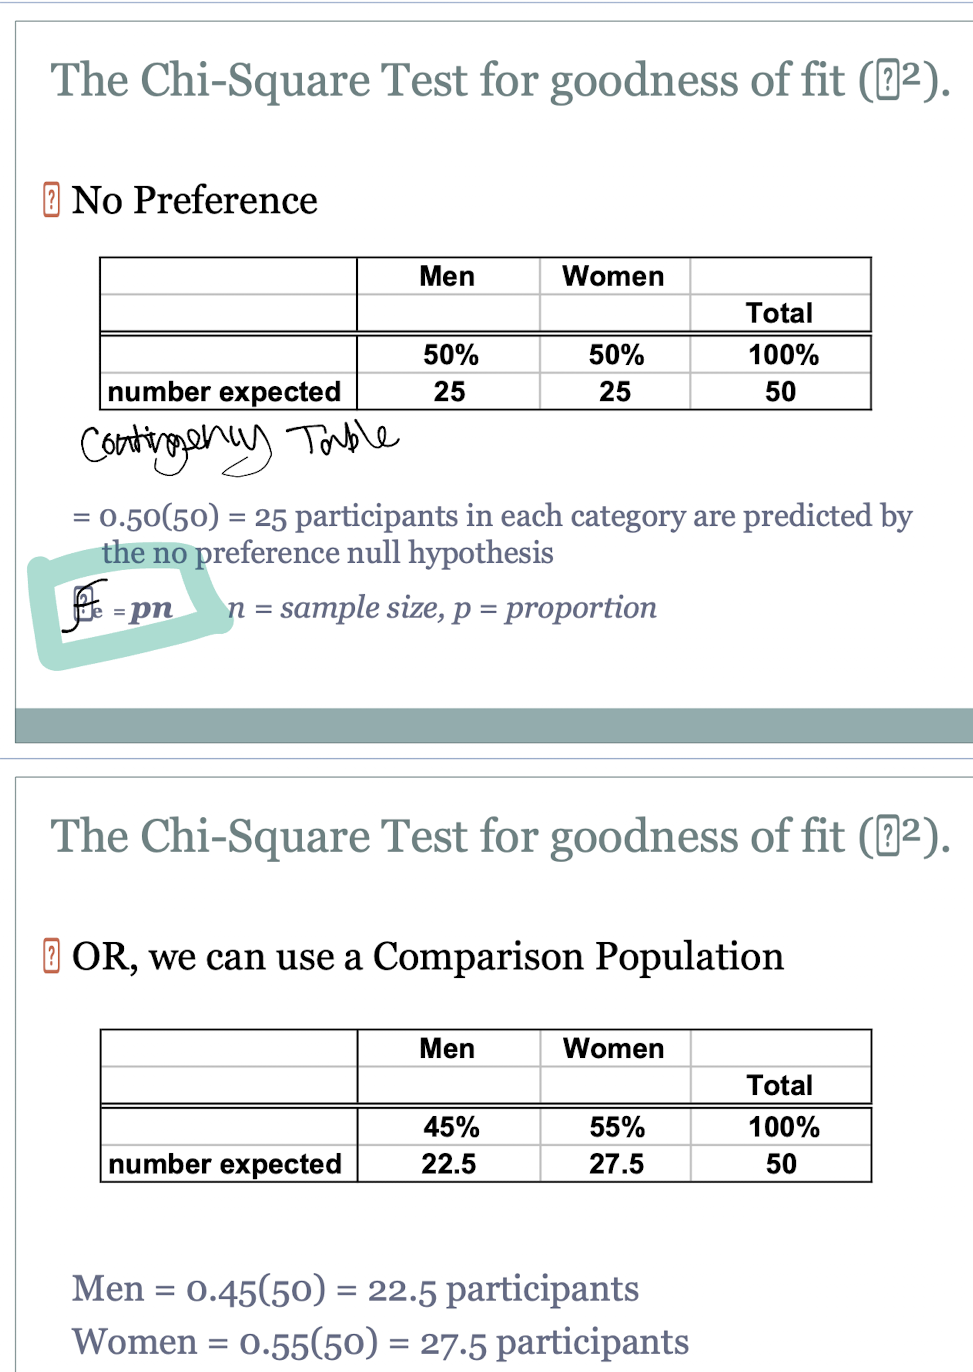
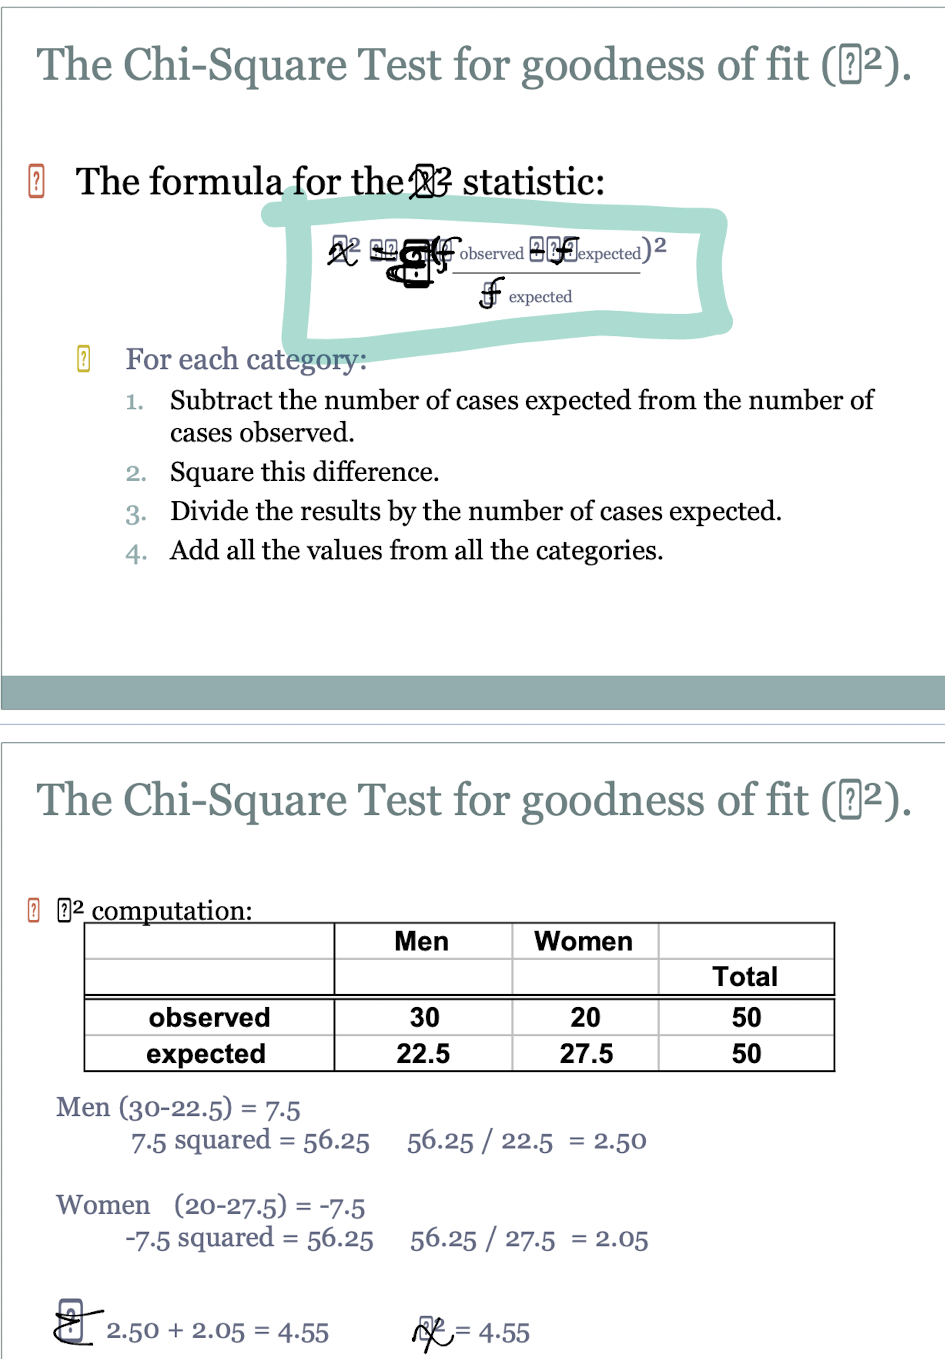
what is the chi-square test for goodness of fit (x2) used to do?
used on unrelated data. every participant/case yields data for only one category
used to answer questions about the proportions of a population distribution e.g. is there gender bias in the psych dept?
used to compare different levels of one variable
compares the sample proportions to population proportions as specified by H0.
for X2, what is the observed frequency
the numbers of participants measured in individual categories
for X2, what is the expected frequency
frequencies predicted by the null hypothesis = chance alone
how could the expected frequency differ?
because it reflects the null hypothesis, changes in the null can change the expected frequency
how do you calculate X2?
for each category (e.g. men, women…)
subtract the number of cases expected from the number of cases observed
square this difference
divide the results by the number of cases expected
add all the results from all the categories
how do you calculate the degrees of freedom for X2?
df = C (cells in a table (in Jamovi)) -1
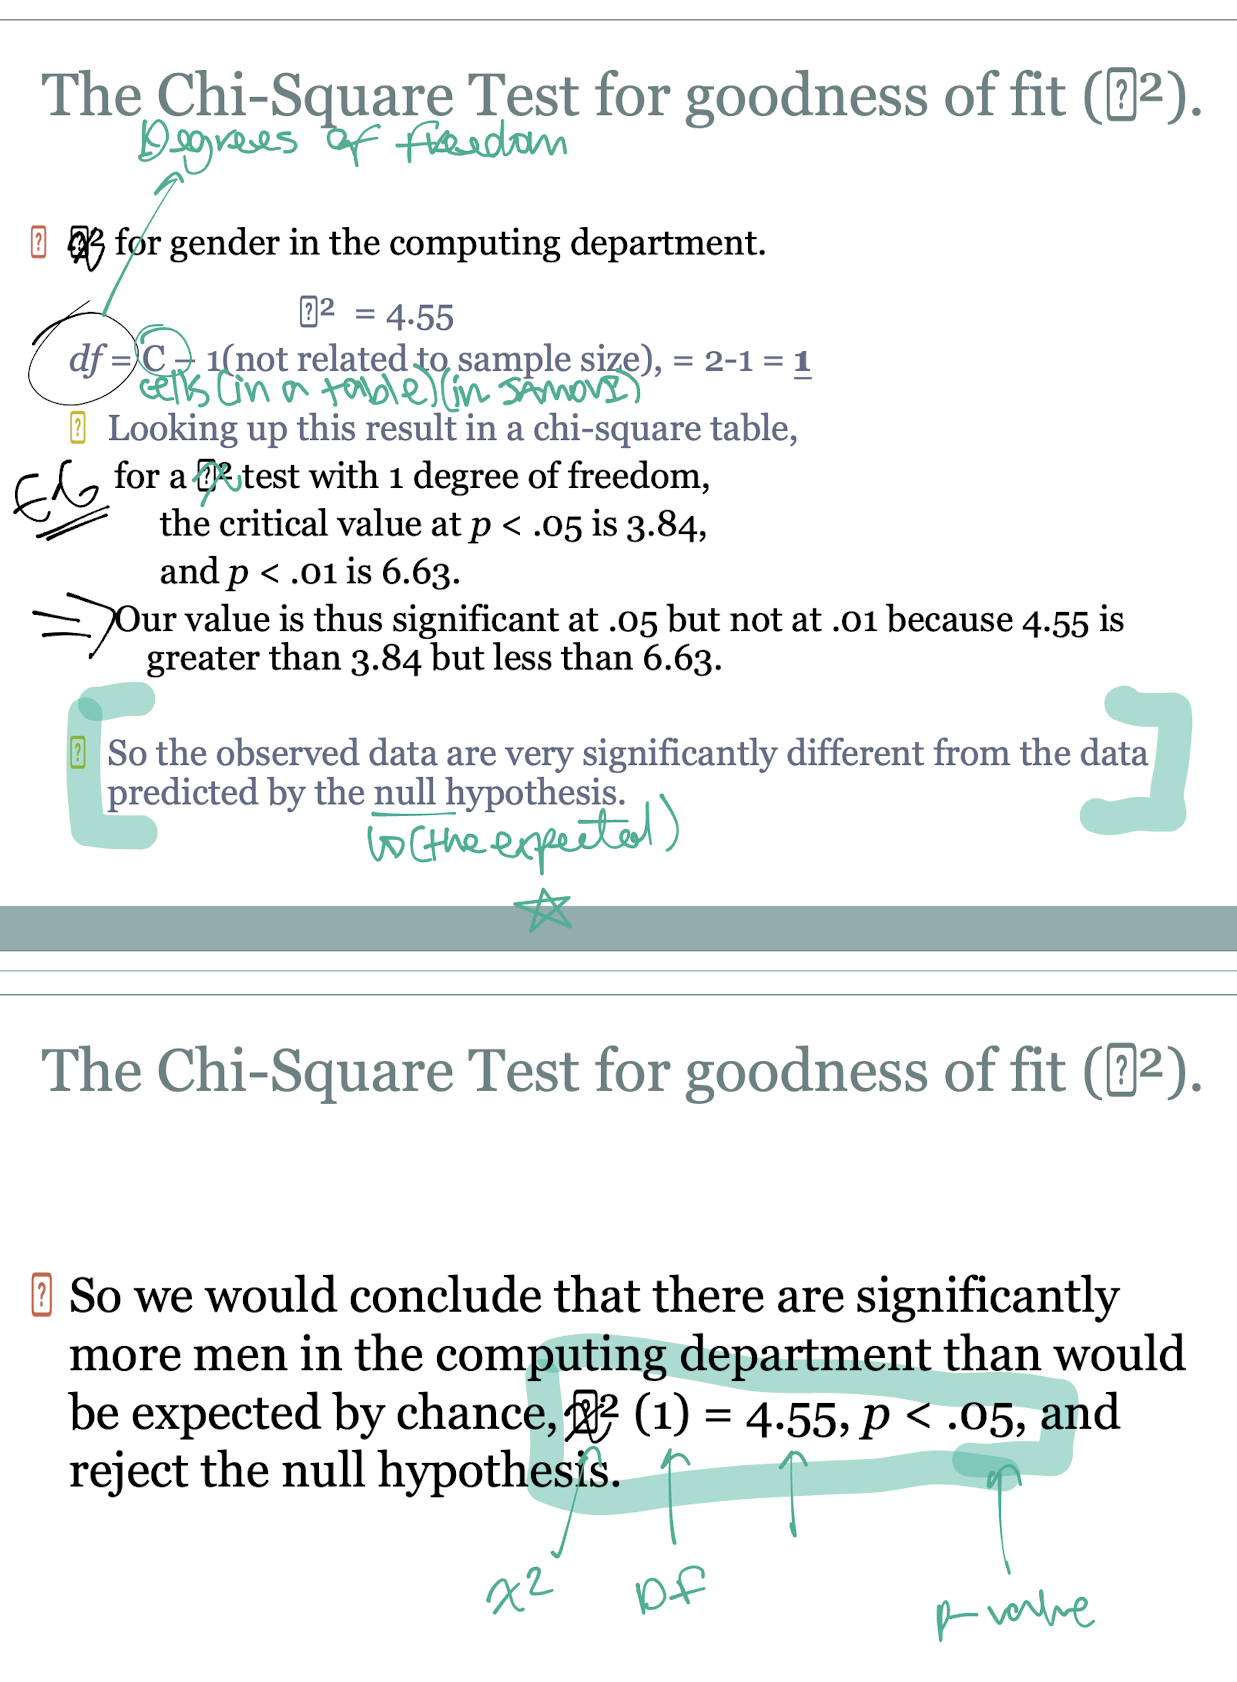
what’s the probability threshold for X2
p < 0.05
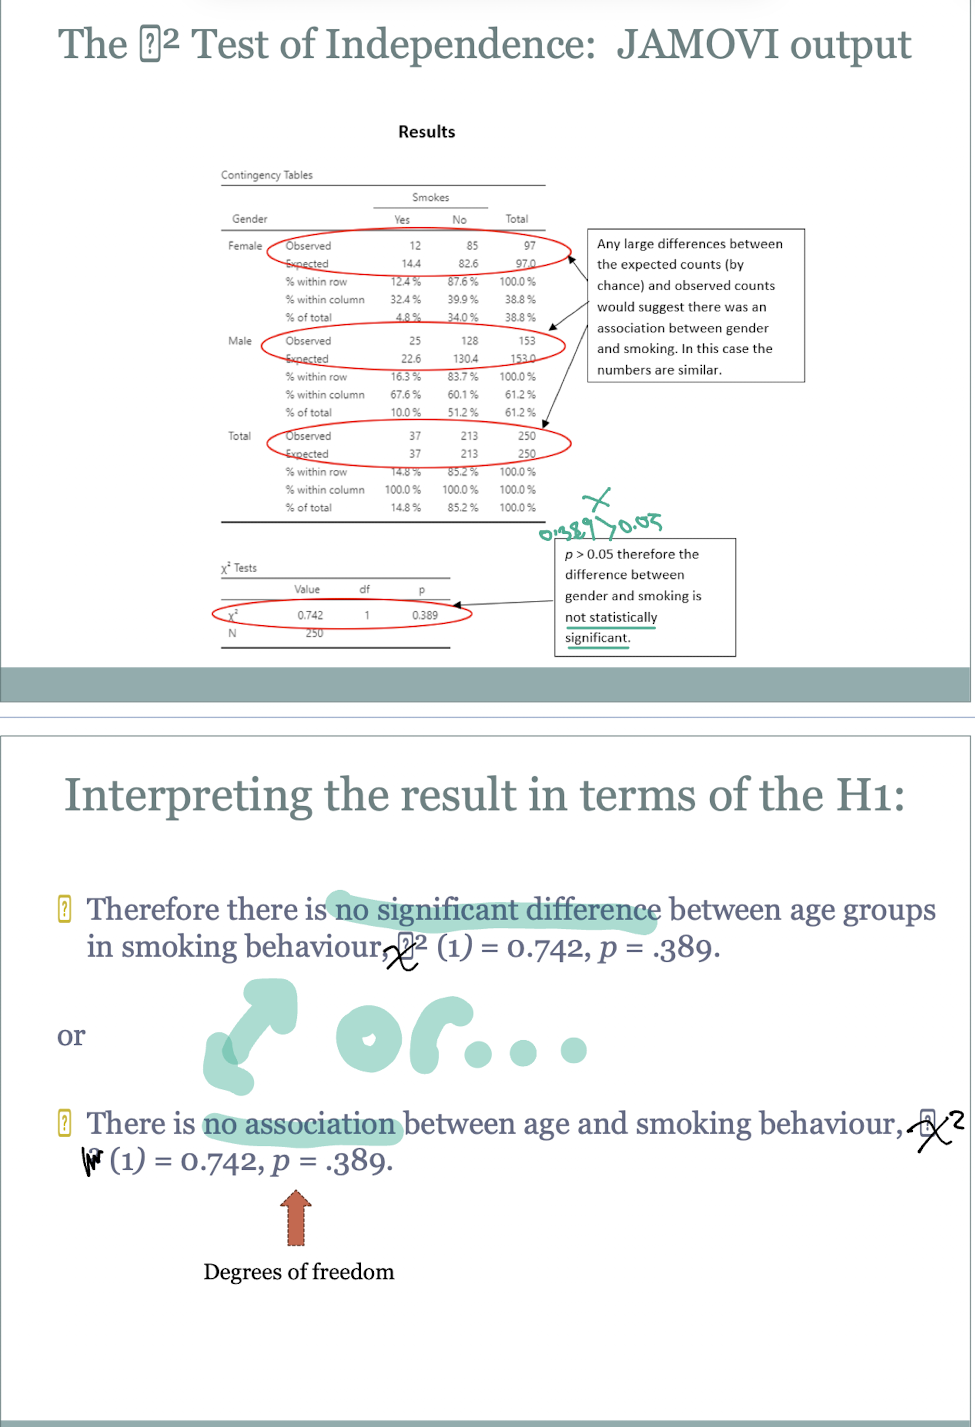
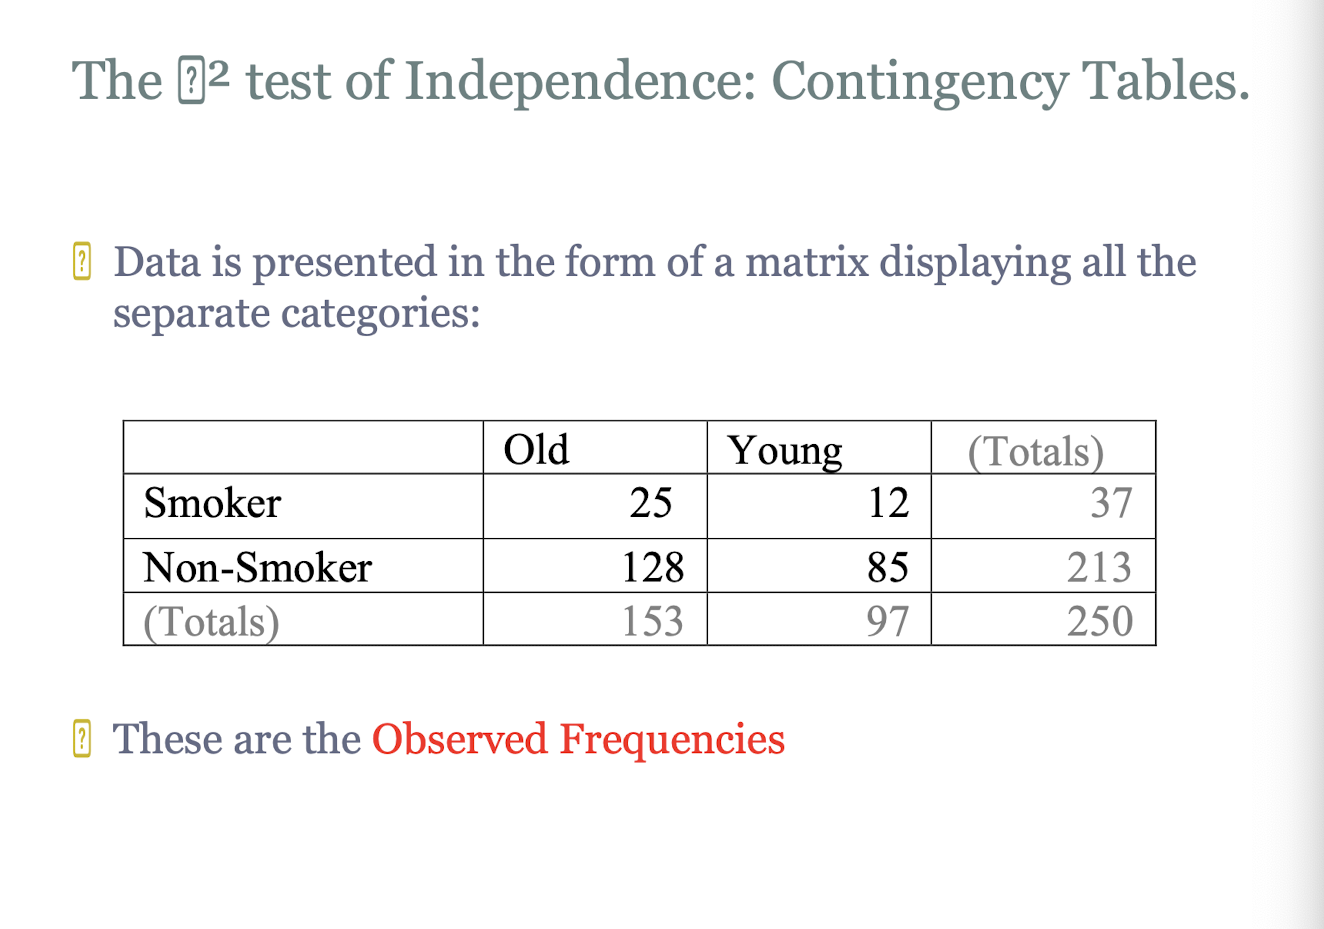
what does the chi-squared test of independence (TI) want to find out?
are two variables independent or associated (e.g. - does age influence smoking frequency?)
what does the TI do that is the same as the GF?
uses data in the form of frequencies in different categories, which is compared to expected frequencies predicted from the null hypothesis
what has to be H0 for TI?
the two variables being measured are completely independent from each other and do not affect each other at all (e.g. there is no relationship between age and smoking behaviour/smoking behaviour is the same for both age groups)
what has to be H1 for TI? (two examples)
e.g. - there is a relationship between age and smoking behaviour / the proportion of smokers is different for young and old age groups
how is data presented in TI for observed frequencies?
in a contingency table, in the form of a matrix displaying all the separate categories
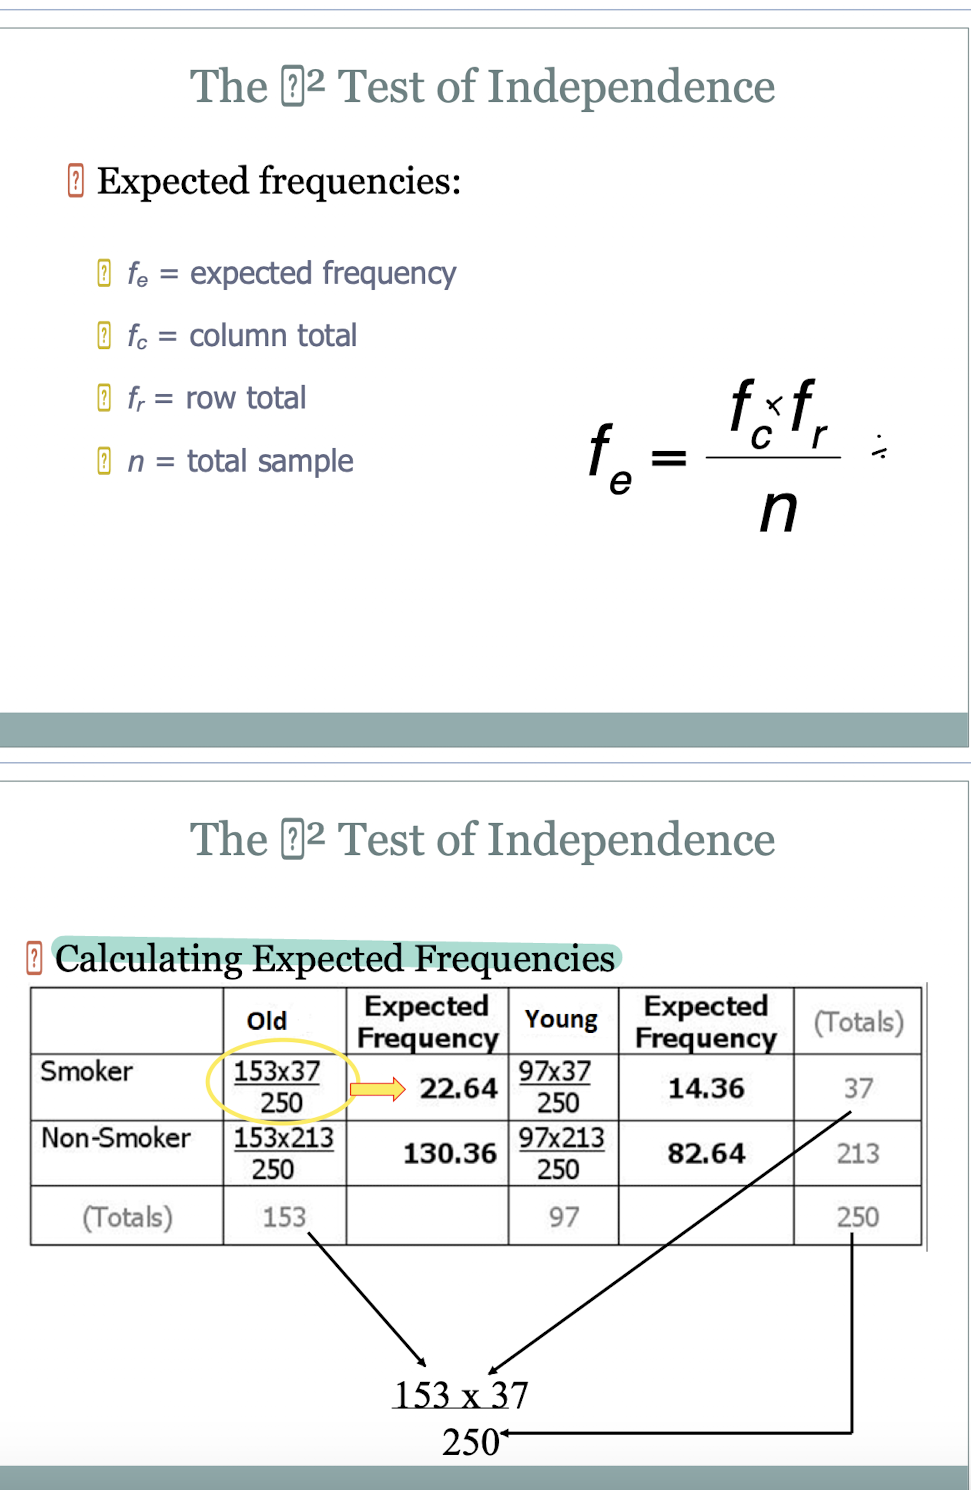
for TI, how do you calculate the expected frequency?
by multiplying the column total and row total, divided by the total sample
what is the TI formula?
the same as X2 GF
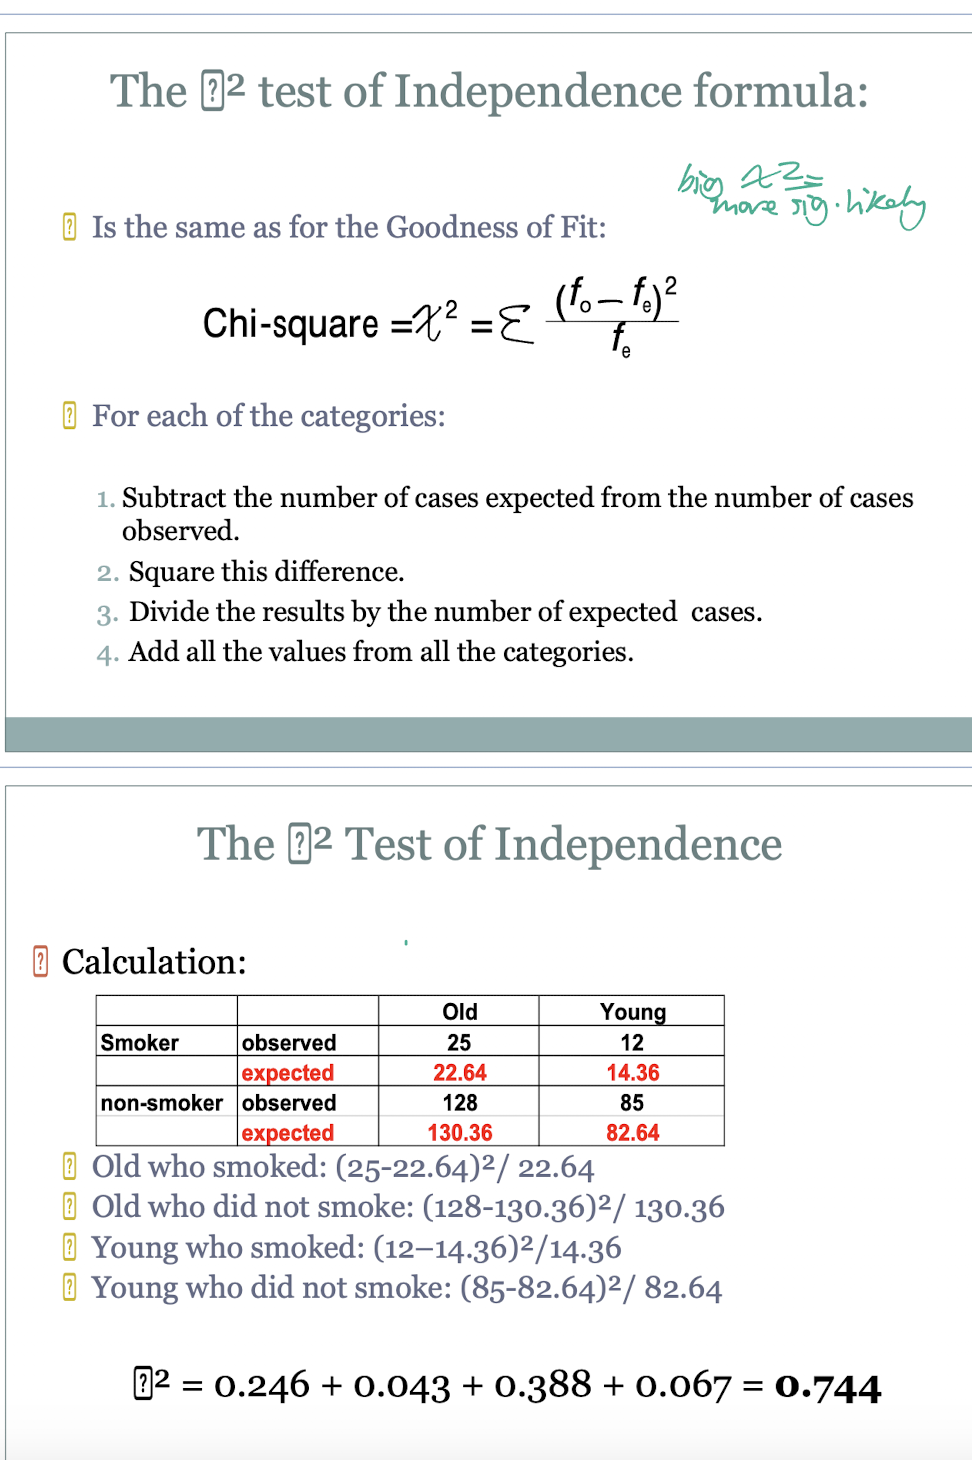
what does a bigger X2 value indicate?
that the result is more significant
how do you calculate the degrees of freedom for TI?
(number of rows R - 1) x (number of columns C - 1)