Pharmacology - Pharmacokinetics
1/42
There's no tags or description
Looks like no tags are added yet.
Name | Mastery | Learn | Test | Matching | Spaced | Call with Kai |
|---|
No analytics yet
Send a link to your students to track their progress
43 Terms
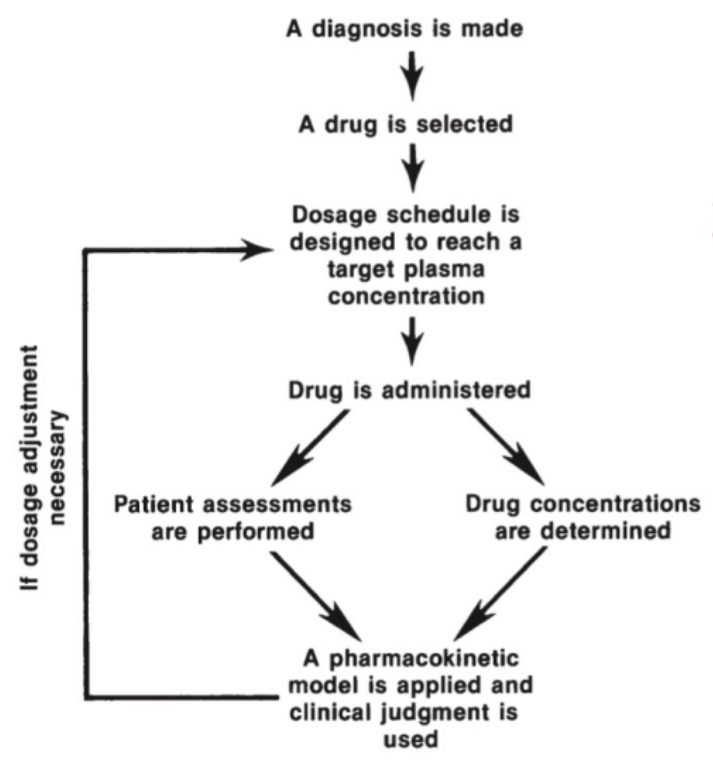
Pharmacokinetic Modelling
What amount to give to the patient to sooth their symptoms.
Using math to predict drug concentration over time in the body, so one can choose the right dose and dosing schedule.
Pharmacokinetic Studies
The introduction of a new drug.
Enteral
A route of drug administration.
Involving or passing through the intestine, either naturally via the mouth and esophagus, or through an artificial opening.
Consists of oral, sublingual, and rectal.
Oral (Enteral)
Most common route; first pass effect (30-90 minutes).
Takes time for the drug to create an effect.
Sublingual (Enteral)
Rapid absorption route; bypasses ‘first pass” effects despite taking orally.
Under the tongue.
Rapid delivery (3-5 minutes).
Rectal (Enteral)
Allows rapid systemic effects (5-30 minutes).
~50% of the drug that is absorbed from the rectum will bypass the liver.
Takes some time but not as much as oral.
Not all of the drug is subjected through first pass.
Parenteral
A route of drug administration.
Administered by any way other than through the mouth.
Consists of intravenous and intramuscular/subcutaneous routes.
Intravenous (Parenteral)
Delivery directly into the systemic circulation, very rapid onset of action (seconds to minutes).
Directly into the blood.
Intramuscular/Subcutaneous (Parenteral)
Injection into muscle/ just below the skin; rate of absorption depends on blood flow to site (10-20 minutes).
Other Routes
There are other routes of drug administration.
For example, inhalation and topical/transdermal (ointment/patch).
Inhalation (Other)
Absorption is through epithelium in the lungs and can be very rapid (2-3 minutes).
i.e. asthma, anesthesia.
Topical/Transdermal (Other)
Convenient, slow absorption (minutes to hours) and sustained exposure.
Comes in the form of a ointment/patch.
i.e. topical treatments.
Absorption & Elimination
The drug needs to be absorbed from its site of administration.
It then needs to travel in the body to reach its target tissue.
Over time the effects of the drug ‘wear off’ because the drug is eliminated from the body.
Therapeutic Window
The overall range between the minimum effective concentration and the toxic concentration that defines the safety limits of a drug.
Defines the upper and lower boundaries of safe drug exposure.
Describes what is allowable, not what is actively targeted.
Therapeutic Concentration/Range
The target drug concentration maintained within the therapeutic window to ensure effectiveness while avoiding toxicity.
Represents the optimal level clinicians aim to maintain.
Describes what is actively targeted, not the full safety limits.
Time Course of Drug Action (Oral)
As more time passes, more of the drug is absorbed; the initial upward slope is the absorption phase.
Plasma drug concentration increases with time until Cmax, the maximum concentration achieved.
After Cmax, the concentration decreases as time passes.
Therapeutic effect occurs only while the concentration remains above the minimal therapeutic effect.

Absorption Phase
Initial upward portion of the curve.
Plasma drug concentration increases with time.
Occurs as the drug is absorbed into systemic circulation.
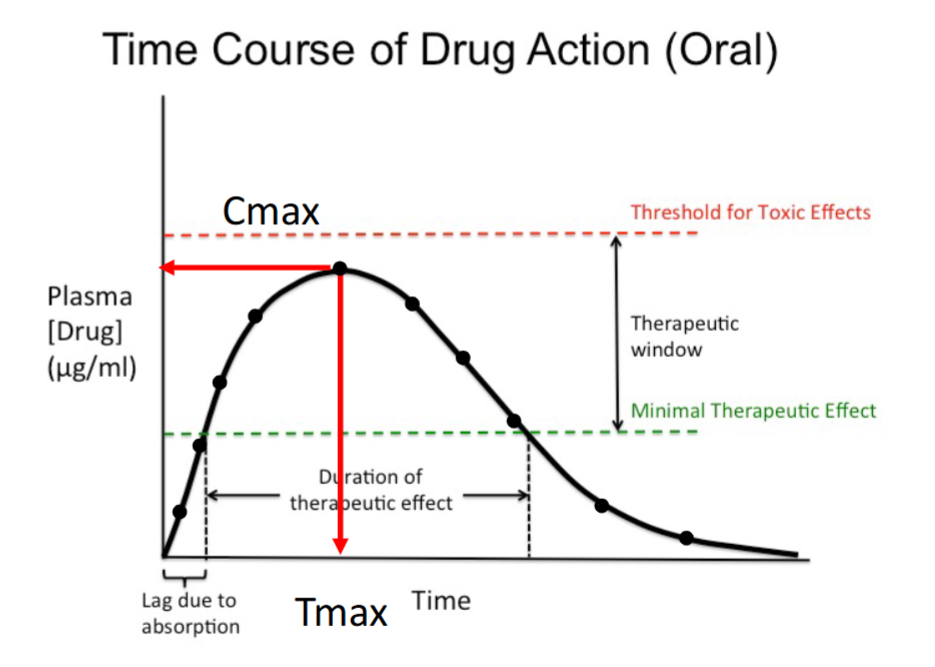
Cmax
The maximum plasma concentration achieved after dosing.
Occurs at the peak of the curve.
Must remain below the toxic threshold.

Tmax
The time at which Cmax occurs.
Marks the end of the absorption phase.
Indicates how quickly peak concentration is reached.

Minimal Therapeutic Effect (Minimum Effective Concentration)
The lowest plasma concentration that produces a therapeutic effect.
Below this level, the drug has no clinical effect.
Forms the lower boundary of the therapeutic window.

Duration of Therapeutic Effect
The time the drug concentration remains above the minimal therapeutic effect.
Corresponds to the effective portion of the curve.
Determines how long the drug produces benefit.

IV Bolus
Drug is given all at once.
Administered intravenously.
Entire dose enters systemic circulation immediately.
No absorption phase.
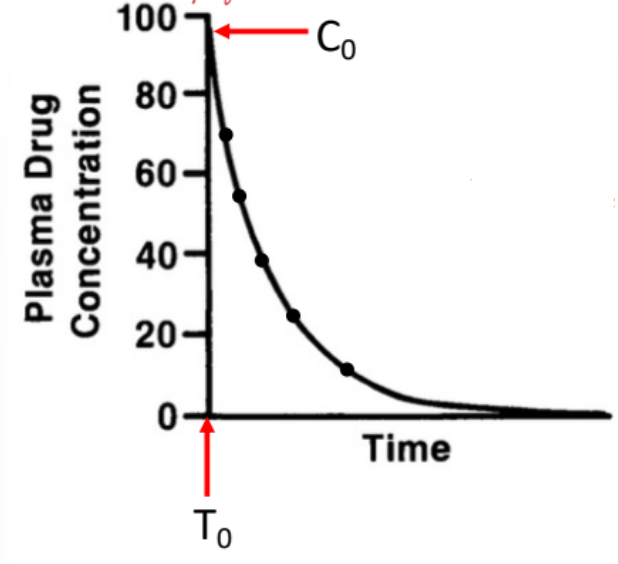
IV Bolus: Time Course of Drug Action
Plasma drug concentration is highest at time zero (C₀).
Concentration begins decreasing immediately after administration.
Decline reflects drug elimination over time.
No rising phase is present on the curve.
IV Infusion
Drug is given over time, not all at once.
Administered intravenously.
Drug enters systemic circulation continuously.
Dose rate is controlled.
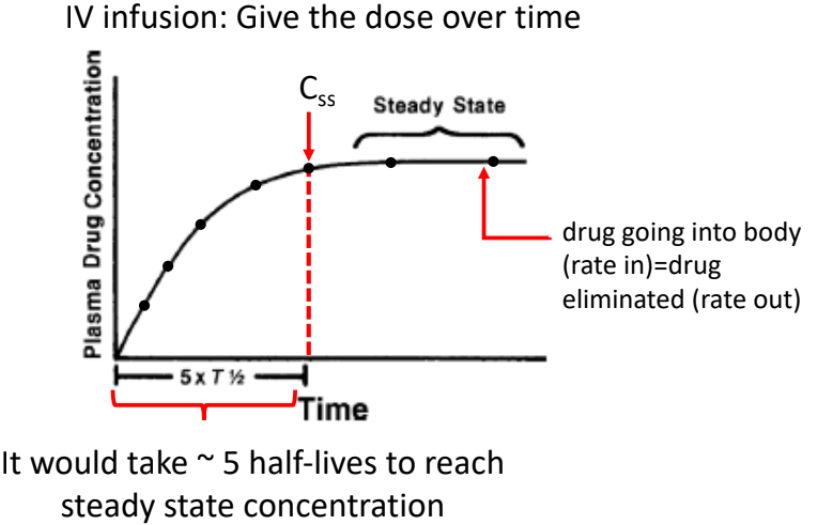
IV Infusion: Time Course of Drug Action
Plasma drug concentration increases over time.
Amount of drug eliminated = amount of drug injected, producing steady state concentration (Css).
Concentration goes up but plateaus at steady state.
Takes approximately 5 half-lives to reach steady state concentration.
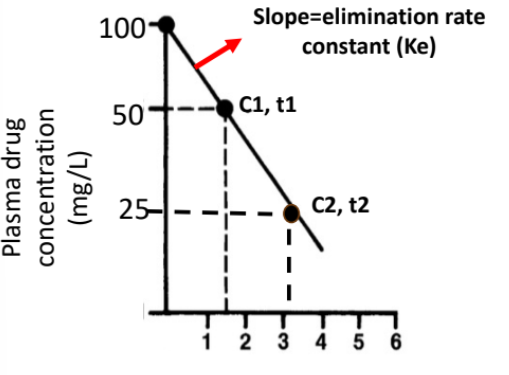
Elimination Rate Constant (Ke)
Describes the rate at which drug is eliminated from the body.
It is obtained from the slope of the log-transformed concentration–time plot for an IV bolus.
The slope of this straight line equals –Ke.
Larger Ke = faster elimination.
Calculating Ke
Two concentrations (C1 at t1, C2 at t2) are selected from the linear portion.
The slope is calculated using the change in ln(concentration) over time.
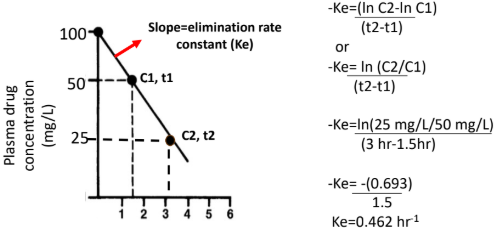
Formula:
–Ke = (ln C2 − ln C1) / (t2 − t1)
or –Ke = ln(C2 / C1) / (t2 − t1)
Ke is reported as a positive value (rate constant).
Conceptual Meaning of Ke
Ke represents the fraction of drug eliminated per unit time.
A Ke of 0.462 hr⁻¹ means ~46% of the remaining drug is eliminated per hour.
Elimination is proportional to how much drug is present (first-order).
Active Transport
Done by transporters by using energy (ATP), move against the concentration gradient (e.g. ABC transporters - Digoxin).
Digoxin is a heart medication.

Facilitated Transport
Move down the concentration gradient via a transporter without a need for energy (ATP) (e.g. amino acid transporter - Levodopa).
Going from high to low concentration using a transporter.

Diffusion
Move down the concentration gradient without a need for transporter.
Highly lipophilic drugs (e.g. Amiodarone).
Serious arrythmia medication.
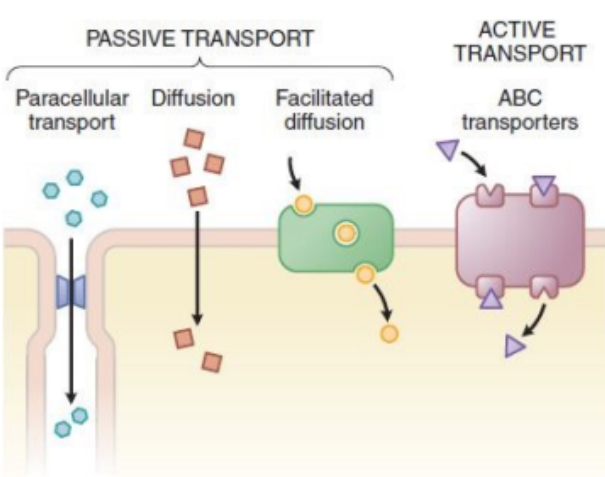
Paracellular Transport
Occurs via tight junction between the cells.
The drug finds spaces between the cells and squeezes through.
Small, hydrophilic drugs (i.e. Metformin).
Used for diabetes type 2 treatment.

Three Factors Governing Drug Distribution:
Concentration gradient of free drug between blood and target organ/compartment.
Solubility of drug in the target organ/compartment (relative water/fat solubility).
Blood flow to the target organ.
Concentration Gradient of Free Drug
Determined by the concentration gradient of free drug between blood and the target organ/compartment.
Only the unbound (free) fraction is pharmacologically active.
Plasma protein binding reduces the amount of active drug; bound drug is inactive.
Highly protein-bound drugs can have small effects despite large amounts present (e.g., Warfarin ~99% bound).
Solubility of Drug in Target Organ/Compartment
Depends on the drug’s relative water vs fat solubility.
Lipophilic drugs preferentially accumulate in fat-rich tissues.
Accumulation is favored when solubility in the tissue is high.
Example: Amiodarone, which accumulates in fat tissue.
Blood Flow to the Target Organ
Distribution depends on how well the tissue is perfused.
Highly perfused tissues accumulate drug more readily.
Poorly perfused tissues accumulate drug more slowly.
Examples: Brain (highly perfused) vs fat tissue (poorly perfused).
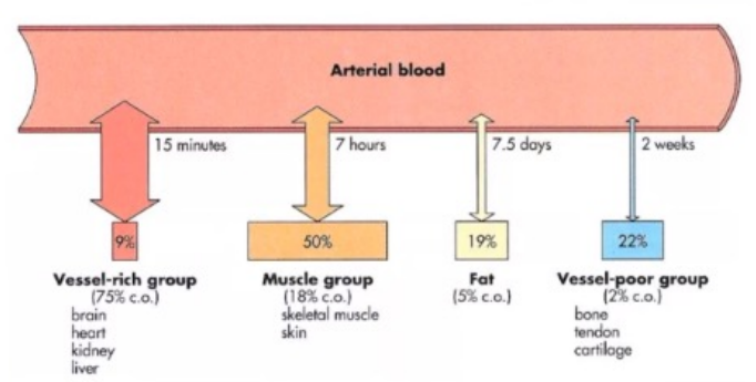
Viscera
Highly perfused organs (vessel-rich group) - rapid distribution of drugs.

Muscle
Drugs perfuse well here.
Large mass, quick distribution despite low lipid content.

Fat
Drugs with high lipid solubility will accumulate in fat, but distribution to this compartment is slow due to poor blood supply.
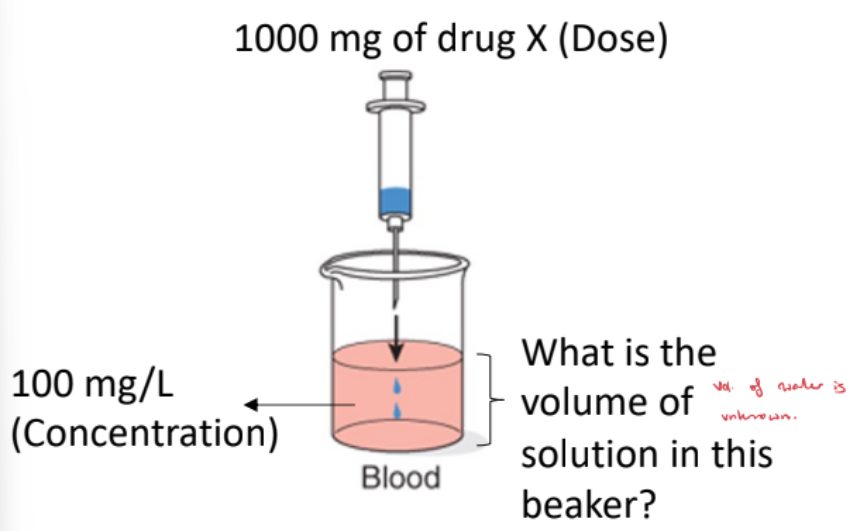
Blood-Only Beaker
The volume of solution is unknown.
When you calculate the volume, it represents the amount of water the drug has distributed into.
This is the apparent volume, not the actual physical volume of the beaker.
It reflects how widely the drug has proliferated outside the blood.
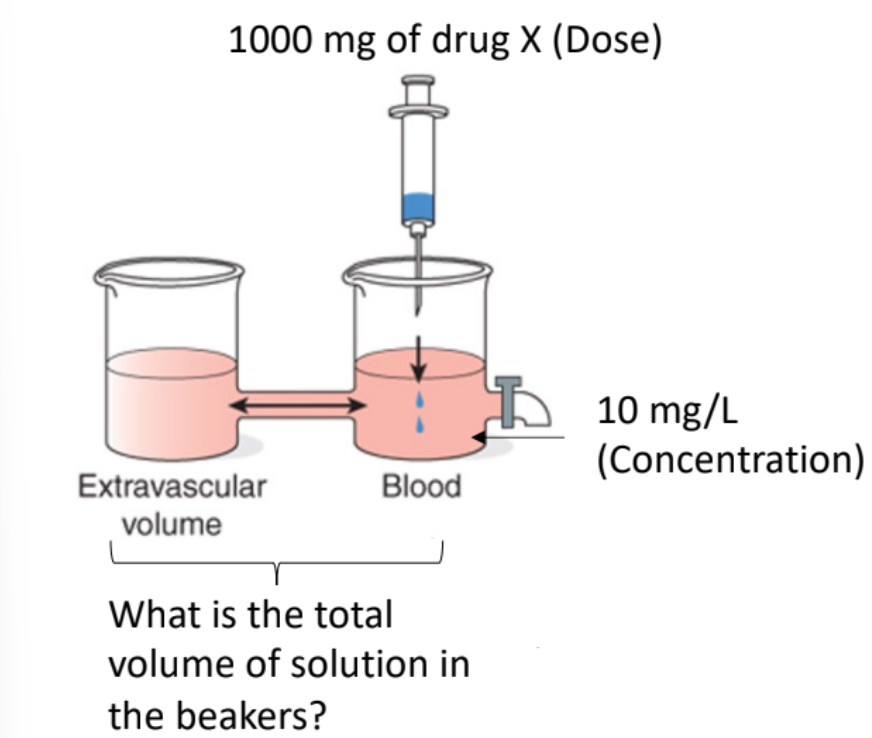
Blood + Extravascular Beakers
The total volume of solution includes blood plus extravascular compartments.
The drug distributes between these compartments.
The measured concentration in blood is lower because the drug is spread out.
This corresponds to the drug being distributed in ~100 L of water (apparent).
Apparent Volume of Distribution (Vd)
The total volume of solution includes blood plus extravascular compartments.
The drug distributes between these compartments.
The measured concentration in blood is lower because the drug is spread out.
This corresponds to the drug being distributed in ~100 L of water (apparent).
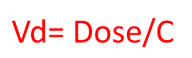
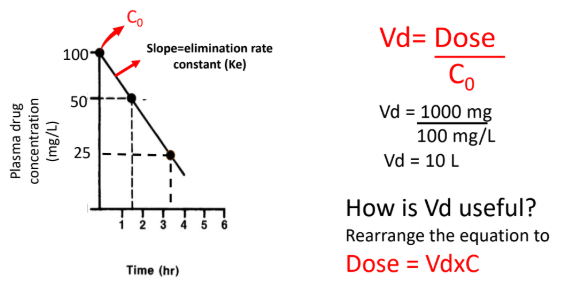
Volume of Distribution (Vd) Formula
For an IV bolus, Vd = Dose / C₀, where C₀ is the initial plasma concentration.
From the graph, C₀ = 100 mg/L and Dose = 1000 mg.
Vd = 1000 mg / 100 mg/L = 10 L.
Rearranging to Dose = Vd × C allows calculation of the loading dose needed to reach a target plasma concentration.