research final
biotechnology
biotechnology involves the use of living systems, organisms, or parts of organisms to manipulate natural processes in order to develop products, systems, or environments to benefit people (could make products like foods, pharmaceuticals, or compost; systems like waste management or water purification; or environments like hydroponics); also includes genetic or biomedical engineering
includes (not limited to)
manipulating DNA
recombinant DNA technology
PCR & cloning
fermentation
production or recombinant proteins (insulin)
genetic manipulation is not new in organisms
has been done for thousands of years
plant and animal breeding
mainly used in multiple fields of research
biology, chemistry, genetics, physics
research labs
pharmaceutical products
agricultural products
medical instruments
products created using biotechnology
insulin for diabetes
1982 Eli Lilly (humulin)
proteases
many applications (stain removal from clothing)
antibodies
fighting diseases
recombinant plants
disease resistance
cold/drought resistance
genetically modified animal cels
stem cells
animals making human proteins
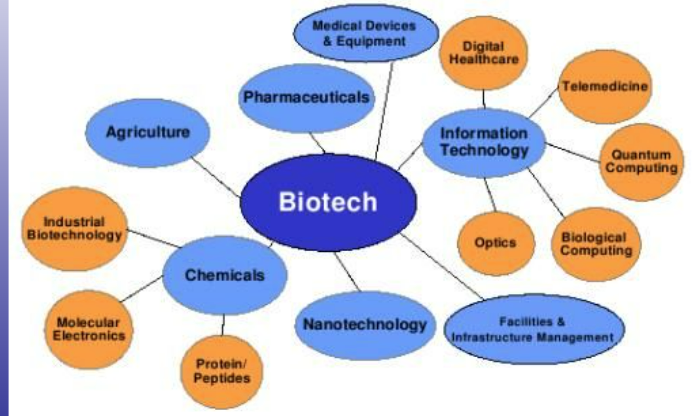
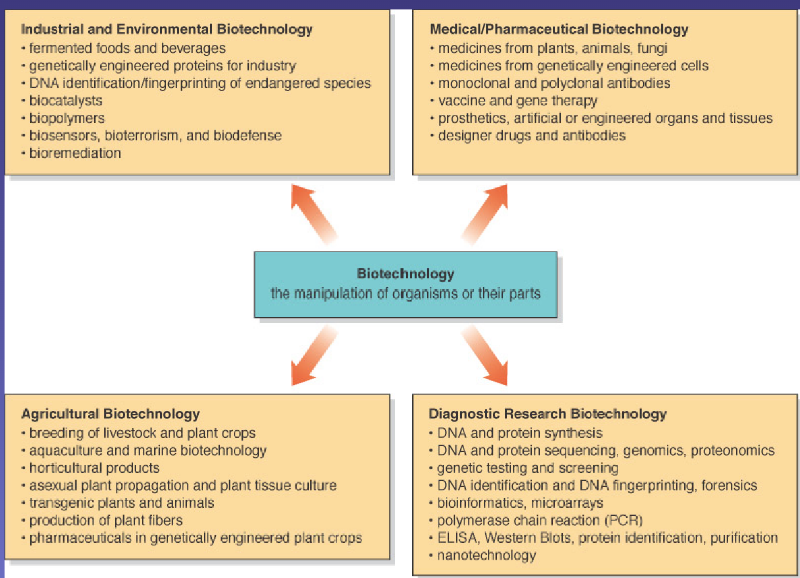
research takes place at biotechnology companies
For-profit
Develop a wide variety of products
Pharmaceutical, agricultural, industrial, research instruments, reagents
Provide services to other researchers
DNA sequencing facilities
Employ many types of workers
Laboratory, manufacturing, business-related
Patent their findings
University and Government Research Labs
Not “for-profit”
Often “Pure science” = meant to further knowledge in the field
Some “applied science” = use science for practical purpose
Many collaborate to look at large problems
Viruses (HIV), Cancer
Funded by granting from:
Private industry, government, foundations (ex. Cancer foundations)
Share their findings
examples of bioengineered products
Products used in rDNA technology
DNA ligase, restriction enzymes, Taq polymerase, vaccines (mRNA covid vaccine)
Genetically Modified Organisms (GMOs)
Recombinant human proteins
Human gene spliced into another organism, using a vector
E. coli, yeast, other mammals
Produce large amounts of human protein
Example: t-PA (tissue plasminogen activator)
Protein involved in breaking down blood clots and clearing clogged blood vessels
Human insulin
Treatment of Type I and II diabetes
bioethics in biotechnology
Many of the products and treatments developed using biotechnology are controversial
Force debates about morals, right and wrong
GMO’s, stem cells, manipulating the human genome, genetic testing, “designer genes”
Bioethics focuses on the debates regarding what is moral
Government agencies help to regulate the types of research being done
Important to understand the science behind the products to be able to form your OWN opinion about the ethics of a product
Most researchers are not involved in setting science policy
Ethics also comes into play in the research setting
Honesty and Accuracy in Data collection and reporting
Safety
Where do you draw the moral line for your job?
scientific method
observation - using senses to gather information
scientific method - process used to answer questions about the world
problem/question - created off of observation
hypothesis - testable explanation of a question/problem
experiment - procedure that tests the hypothesis
charts/tables/graphs - used to organize data gathered during experiment
line graph - quantitative (numerical) data
bar graphs - qualitative (descriptive) data
conclusion - explains if the hypothesis was supported or not
constant - parts of the experiment that stay the same
variables - factors that could change in an experiment
independent variable - part being manipulated to test for any effects
dependent variable - part being measured; changes based on the independent variable’s effect
control group - experimental group that isn’t affected by independent variable; used for comparison
scientific method
ask a question based off of observations, information, research, etc.
do background research
construct a testable hypothesis
attempts to answer a question
written as a statement
hypothesis doesn’t get proven, only supported or rejected
test hypothesis by doing an experiment
quantitative (numerical) data when possible
repeat at least 3 times
control groups
positive control - gives predictable results
negative control - lacks what is being tested, gives negative result
independent variables - conditions you manipulate (can be more than 1)
dependent variables - conditions you measure (can be more than 1)
controlled variables/constants - conditions you don’t change
analyze data and make a conclusion → state if prediction was confirmed or not (can’t prove hypothesis)
based on observations &analysis of data
includes consideration of error
suggest possible ideas for further experimentation/applications of your findings
report results
try to be accurate about measurements, timing, data collection
make careful observations
photograph data?
keep samples (if allowed)?
organize data
spreadsheets, graphs, tables, etc.
forming a conclusion
does the numerical evidence support the original hypothesis?
look for trends in data among test groups
what if one of the tests is very different from others?
is there a significant difference between 2 different groups?
determine “best” condition and make recommendation
is further experimentation required?
what could be done differently?
hypothesis - inferred explanation of an observation/research finding; based on existing scientific knowledge
theory - well-substantiated and comprehensive set of ideas that explains a phenomenon in nature; based on large amounts of data and observations collected over time; can be tested and refined through additional research and allow scientists to make predictions
scientific law - an expression of a mathematical or descriptive relationship observed in nature
what is the best definition of the term theory, as it is used in science?
a theory is a guess or hunch about something that has occurred in nature.
a theory is a comprehensive set of ideas explaining a phenomenon in nature
a theory is based on verifiable laws and can be proven true
a theory is a hypothesis that uses laws and observation to make an assumption
while speaking to a colleague, a scientist makes the following statement: “i propose that bald eagle eggs in northern maine will have thinner shells than those from birds in southern alaska due to increased levels of pesticides in the water. “ this statement is a
theory
law
conclusion
hypothesis
scientfic theories can be tested
true
false
complete the following sentence so that it is correct: scientific theories are based on
general assumptions of how systems work
mathematical principles that can be proven true
large amounts of data collected over time
observations from within only one scientific discipline
why are scientific theories an important part of research and understanding?
they allow scientists to make predictions
they allow scientists to make assumptions
they determine the work that future scientists can do
they determine the subjects that scientists research
scientific theories do not change once they have been written down
true
false
which statement below correctly identifies the difference between laws and theories?
laws describe phenomena, while theories explain why phenomena exist
laws are a statement of fact, while theories are a statement of opinion
laws explain why phenomena exist, while theories explain how
laws are a prediction of phenomena, while theories are an explanation
why do scientist develop a hypothesis before conducting research?
it gives them direction on how to interpret the results of their research
it helps to predict outcomes and define the parameters of the research
hypotheses give the researcher an outcome to shape their work around.
hypothesis help a researcher decide which observation to record and ignore.
scientific theories are always broad and cover many concepts
true
false
choose the sentence below that is a correct description of scientific theory
scientific theories in one discipline can influence theories in other disciplines
theories in one scientific discipline do not affect theories in other disciplines
new scientific theories are always original and do not connect to those that came before
creativity and insight are not important parts of developing new scientific theories
b
d
a
c
a
b
a
b
a
a
measurement stuff
Metric Conversions
The Great Man King Henry’s Daughter Drank Chocolate Milk Until Nine P.m. - tera, giga, mega, kilo, hecto, deca, deci, centi, milli, micro, nano, pico
tera- - T, 10^12
giga- - G, 10^9
mega- - M, 10^6
kilo- - k, 10^3
hecto- - h, 10^2
deca- - da, 10^1
deci- - d, 10^-1
centi- - c, 10^-2
milli- - m, 10^-3
micro- - μ, 10^-6
nano- - n, 10^-9
pico- - p, 10^-12
Microscopes
40x = 2 boxes = 4 mm = 4000 μm
100x = 2 boxes/2.5 = 0.8 boxes = 1.6 mm = 1600 μm
400x = 2 boxes/10 = 0.2 boxes = 0.4 mm = 400 μm
take estimate of sample size (ex. 1/3)
multiply field of vision (ex. 400 μm or 400x) by sample size (1/3) = about 133.3 μm
Volume
graduated cylinder - measures anything greater than 10 mL; types include 10 mL, 25 mL, 100 mL, 250 mL, 500 mL, and 1 L
serological pipette - measures anything less than or equal to 10 mL; types include 1 mL, 2 mL, 5 mL, and 10 mL; used with pumps (blue and green)
micropipette - types include P-10, P-20, P-100, P-200, and P-1000
P-10 - measures 0.5 μL to 10 μL; uses small white tips
P-20 - measures 2 μL to 20 μL; uses small white tips
P-100 - measures 10 μL to 100 μL; uses medium yellow tips
P-200 - measures from 20 μL to 200 μL; uses medium yellow tips
P-1000 - measures from 200 μL to 1000 μL or 1 mL; uses large blue tips
Volume Practice
25 μL - P-100
10 μL - P-10
1 μL - P-10
1000 μL - P-1000
1 mL - P-1000
2 mL - 2 mL serological
175 μL - P-200
23.5 μL - P-100
6.5 mL - 10 mL serological
125 mL - 250 mL graduated cylinder
7 μL - P-10
2.87 mL - 5 mL serological
555μL - P-1000
Mass
standard balance - measures solid mass over 900 mg; accurate up to the hundredth (0.01) of a gram
analytical balance - measures solid mass under 900 mg; accurate up to the thousandth (0.001) of a gram
Mass Practice
2.0 g - standard balance
40 mg - analytical balance
30 g - standard balance
2.006 g - standard balance
3.5 g of salt - standard balance
6.5 mg of DNA - analytical balance
12.5 g of gelatin - standard balance
Remember
1 cm^3 = 1 mL = 1 g
percent error equation - (observed mass - expected mass)/expected mass x 100

also know procedures for all measuring instruments (balances, micropipette, etc.)
Random Practice
find the mass in grams
1000 μL - 1 g
500 μL - 0.0005 g
53 μL - 0.000053 g
13.7 μL - 0.0000137 g
solutions
mass/volume
often in grams/ml
may use some in mg/ml or µg/ml
always check/convert units before starting


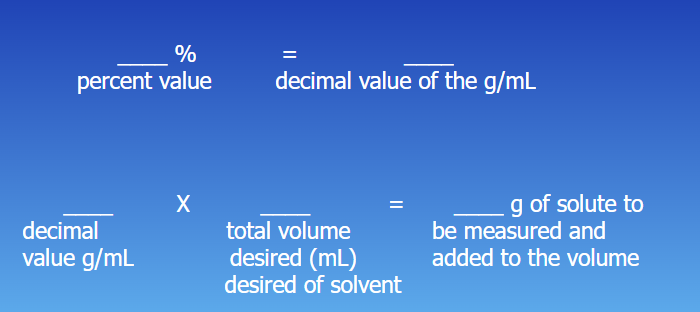
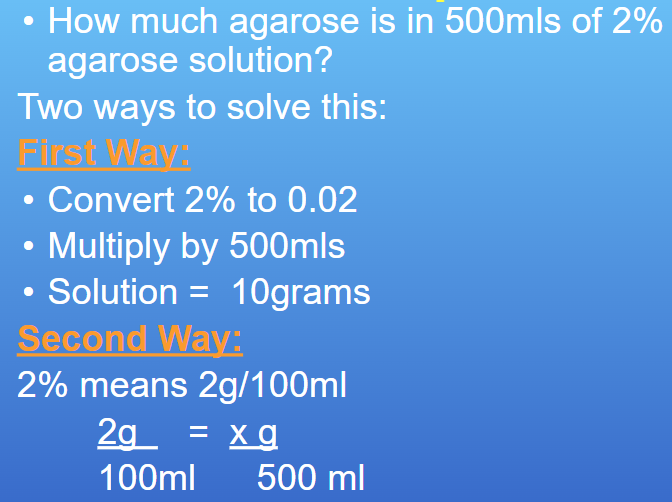
% mass/volume
different from mass/volume
1% solution will be 1 g in 100 ml
always convert volume units to mls
molar solutions
molarity - unit used to describe the number of moles of a chemical/compounds in one liter (L) of solution, making it a unit of concentration
this means a 1.0 Molar (1.0 M) solution is equivalent to one formula weight (FW = g/mol) of a compound dissolved in 1 liter (1.0 L) or solvent (usually water)
always convert volume units to liters first
because molarity is expressed as moles per liter (mol/L)

always convert to L
dilution of a concentrated solution
C1V1 = C2V2
C1 - starting concentration
V1 - volume of starting concentration to use in final solution
C2 - desired concentration
V2 - desired final volume
can be g/ml, molar, %, etc. as long as they match
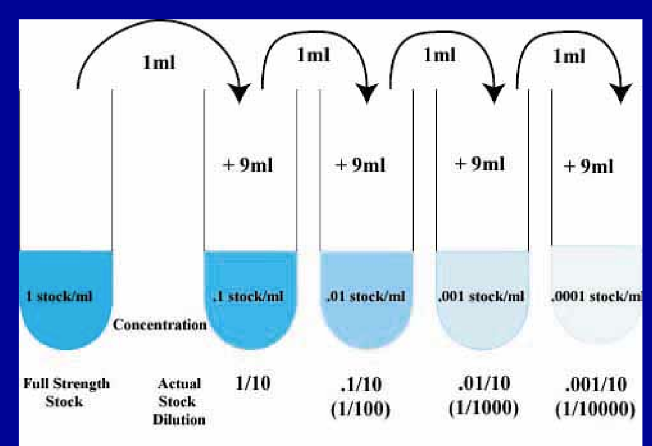
serial dilutions
usually take 1 ml stock and put into 9 ml distilled water to make 10 ml dilute solution
excel graphing
graphs make it easier to see relationships
between different experiments or different experimental conditions
conclusions that might be missed in a table become apparent when data are in graphic form
variables
variable - something that takes on different values
ex. Age, height, weight, temperature, absorbance, wavelength, etc.
independent variables - value being manipulated or changed
dependent variables - observed result of the manipulated value
may be quantitative or qualitative
quantitative variable - one that can be measured
height, weight, number of leaves, absorbance, etc. that must be expressed as a number
qualitative variable - expresses a “qualitative attribute”
like a category - not measured
ex: Type of plant (bean or corn), gender (male or female), political party (Democrat or Republican), etc.
qualitative variable can have a name denoted by a number, like laboratory groups or tube numbers (1,2,3,4,5,6) but this does not make it a quantitative variable.
quantitative variables can also be called:
discrete variable - variable with possible scores of discrete points on the scale
home can have three or six children, but not 4.53 children
continuous variable - where scale is continuous and not made of discrete steps
response time could be 1.64 seconds, or it could be 1.64237123922121 seconds.
practicalities of measurement prevent most measured variables from being truly continuous
graphs
two axes - horizontal and vertical
horizontal axis - x-axis or abscissa
vertical axis - y-axis or ordinate
values of the independent variable are measured on the x-axis
values of the dependent variable are on the y-axis
3 types of graphs - bar, scatter, line
two for the quantitative independent variable
line graphs
scatter plots
difference - how they plot along the x-axis and are trends (scatter) or data point differences (line) being observed
one for qualitative
bar graphs
line graph - distributes category or value data along the horizontal x-axis and distributes all value data evenly along the vertical y-axis
Demonstrates relationship between 2 variables
scatterplots - gives a visual display of 2 variables in a data set
has two value axes showing one set of numerical data on the x-axis and another on the y-axis
bar graph - when independent variable is qualitative and represents separate groups
histogram - type of bar graph
horizontal scale represents classes of data values
vertical scale represents frequencies
bars drawn without gaps between
often used by researchers to help them quickly "see" how points in a large data set are distributed over the range of data
x-axis indicates names of the values of the independent variable
graphing in excel
can be used for statistics and graphing
workbook - new page in Excel
most broad to narrow - tabs, ribbons, groups
cell - individual spot
range - grabbing a bunch of cells
worksheets - inside the workbook
wrap text - displays the text in multiple lines rather than one long line
merge & center - combines cells into one cell
dotted line - boundaries of the printed page
use = to start writing a formula
copying a formula - click the cell and get a square (bottom right corner of a cell), then drag the cell all the way down
autosum - adds all the numbers in the selected range
use arrows to move
tab - moves right
shift + tab - moves left
enter - moves down
shift + enter - moves up
statistics
measures of center
measures of center - representative or average value that indicates where the middle of the data is located
mean
center of the set of values
found by adding all values and dividing by total number of values
usually the best indicator of the middle, unless a large number of high and low points
more accurately called arithmetic mean

∑ = sum of
N = number of values in a population
n = number of values in a sample
x = variable used to represent individual data sets (here each value in sample)
median
if data set contains one outlier, this can dramatically change the mean
median is less sensitive to this effect
median - measure of center that is the middle value when the original data are arranged in order from low to high
finding median
sort the values - arrange in order
if the number of values is odd, the median is the number located in the exact middle
if the number of values is even, the median is the mean of the 2 numbers in the middle
mean vs median
mean is dramatically effected by outliers
median is not
median is good for data sets that include a small number of outliers
ex. - u.s. census - median household income =$36,078
small number of household with very high incomes
mode
mode - value that occurs most frequently
bimodal - when there are 2 values that have the same, greatest frequency
multimodal - when there are more than 2 values that have the same, greatest frequency
midrange

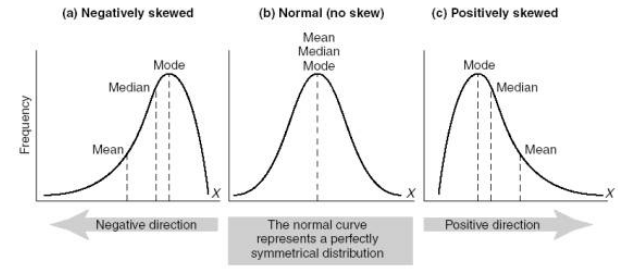
skews
conclusion
no measure of center is best for all data sets - each has advantages and disadvantages
measures of variation
measures of variation - measure of the amount that the data values vary among themselves (variability)
tells how far data points are spread out from the middle
range
range - difference between the max value and min value (high # - low #)
isn’t as helpful as some other measures of variation
standard deviation
standard deviation - measure of variation of values about the mean
how far do values vary from the center?
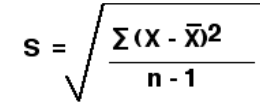
compute the mean
subtract the mean from each individual value to get a list of deviations
square each value
add all the squares
divide by n - 1
find square root of the result
importance
values clustered closely together yield a low standard deviation
means data set is very consistent
lower the standard deviation, the more consistent the data set
conclusion
allows to see how varied the sample is and determine whether a certain value lies within the range of the other “normal” measures
t-tests
t-tests - used to determine if there is a statistically significant difference between 2 data sets
start making a null hypothesis
assuming that there is no difference between the 2 groups
use Excel to calculate the p-value
are probabilities - tell the probability that the data sets are the same
determine if there is a significant difference
p < 0.05 - reject the null hypothesis
there is a statistically significant difference
p > 0.05 - accept the null hypothesis
there is no statistically significant difference
null hypothesis and hypothesis might not be the same thing
null hypothesis will always be that there is no difference
critical probability is usually 0.05 (5%)
reflects the facts that biology experiments are expected to produce varied results
means that there is only a 5% probability that the differences between the two groups are due to chance
if p > 0.05 - two sets are the same; if p < 0.05 - two sets are statistically different.
number of repeats should be as large as possible (> 10 if possible) for the t-test to work
tails
one tail - greater than or less than
one change in one direction
movie theater - measure heart rate only after movie
two tails - greater than and less than
change in two directions
movie theater - measure heart rate before and after movie
type
type 1 - paired
same football, different gas
type 3 - independent, small variation, unequal in sample
different football, different gas
type 2 - independent, large variation, equal (uncommon)
biological literature
biological literature - any printed or electronic document written with the intent of communicating biological information
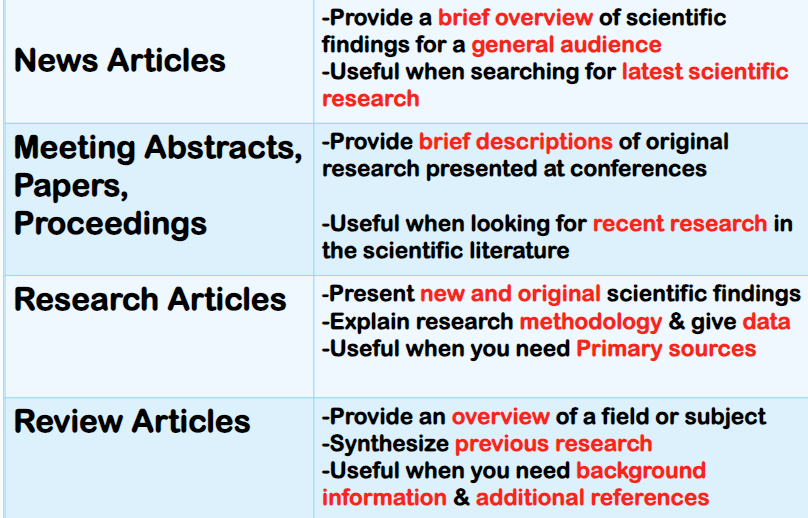
three types - primary, secondary, tertiary
primary literature
contains original research results reported by scientist
reports the results of research which has never been previously published
authors report their own research
includes new findings discovered by the authors’ research
recognized because it always has “materials & methods” and “data” sections (may not be labeled)
examples
journal articles
conference proceedings
dissertations/theses
patents
symposia publications
research posters
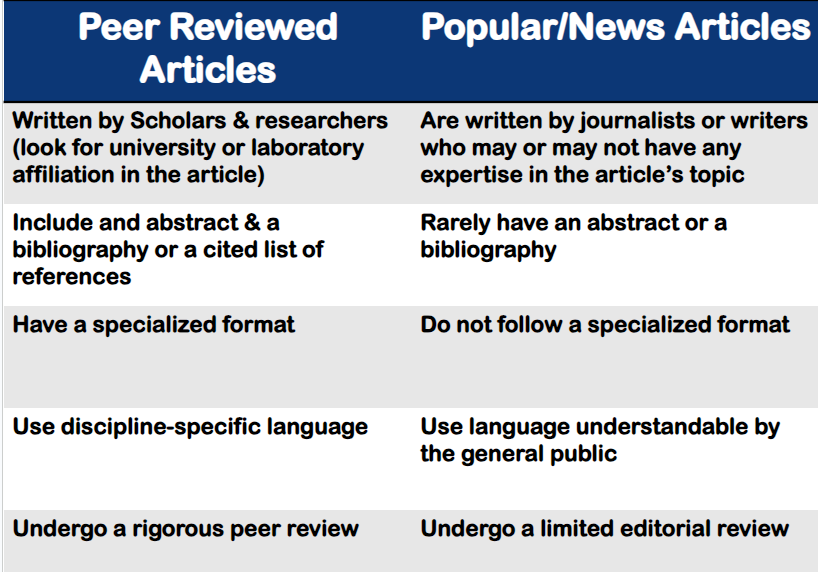
peer review
peer review - before research results are published in a scientific journal, they need to pass a rigorous review process by other scientists
experts in the field of the results examine the results checking for originality accuracy, integrity, etc.
must-have for primary sources
secondary literature
after a research article is published, the information contained in the article may be summarized and analyzed in books and review articles by other authors
rather than presenting new info, they provide a compilation or evaluation of previously published research
not too much analysis
authors will organize previously published literature into a comprehensive view
includes references to primary literature
authors may suggest new conclusions or directions for future research
recognized because it lacks a “Materials and Methods” section
often has a long bibliography and includes data reproduced from the primary literature
intended to summarize the available information and influence the direction of future research
metanalysis - analyzing data about data to bring a new conclusion
examples
review articles, textbooks, books, and articles that interpret or review research works
any journal with “review” in the title (ex. Annual Review of Microbiology or The Quarterly Review of Biology)
other journals that publish review articles (ex. Trends in Cell Biology or Immunology Today)
tertiary literature
aim to provide a broad overview of a topic, or data, already proven facts, and definition, often presented in a convenient form
does not have a “materials & methods” section
examples
fact books
guides and handbooks
digests
almanacs
many websites
primary literature extended
anything besides primary
good places to look for background info
helps understand a topic better
gives an overview
helps identify important ideas & terminology
gives a list of articles/authors/topics for more information to work with
parts of a primary research article
title
title of article
by-line
authors’ names
abstract
summarizes that article
introduction
presents the research question
explains the context of the research
discusses previous work that was done on the topic
materials & methods
discusses how the research was conducted
explains materials & procedures
results
presents results, often in table and/or chart format
shows statistical calculations performed on the data
discussion/conclusion
author explains how the results of their research have addressed their research question
suggest further research
acknowledgments
thank yous
references
publications that the author cited
date of receipt/publication
date article is submitted to journal and finally approved
how to read a scientific article
don’t read all at once
read the abstract
gives an overview of the paper
skim the article
look at section headings and any figures/tables, taking time to read captions
read the entire article, section by section
write down questions
highlight important concepts
focus on the introduction, results, & conclusion