Week 10 graphs
1/13
There's no tags or description
Looks like no tags are added yet.
Name | Mastery | Learn | Test | Matching | Spaced | Call with Kai |
|---|
No analytics yet
Send a link to your students to track their progress
14 Terms
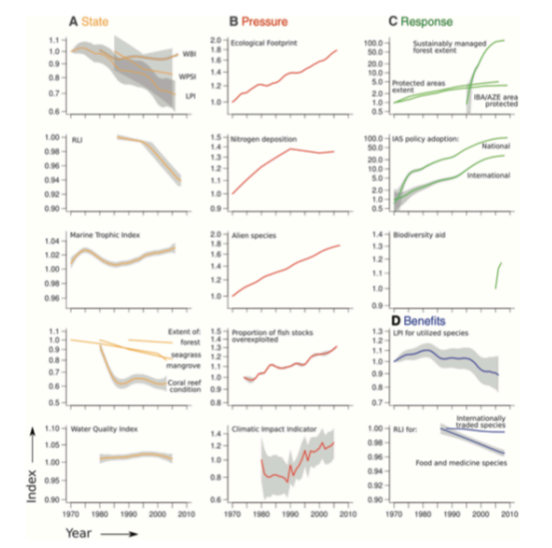
Graph shows indicators of biodiversity declines. While the majority state of biodiversity across several systems and measures of diversity shows an overall decrease in diversity, the pressure continues to increase. While some responses are shown to be increasing, their effectiveness is limited, with benefits shown to be decreasing. THe combination pf these indicates that biodiversity will decrease over time. This suggests a critical need for effective conservation strategies to reverse these trends.
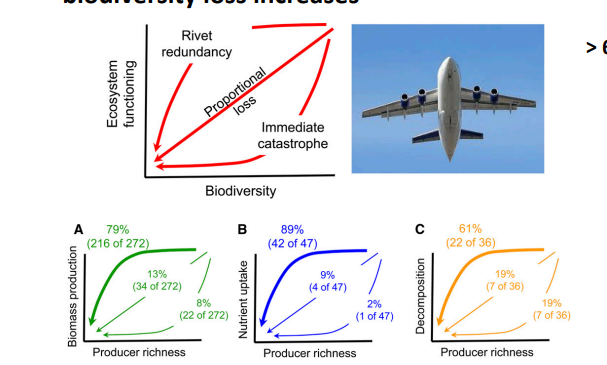
Shows the majority of producers demonstrate rivet redundancy in terms of their ecosystem functioning. There is a non linear decrease in ecosystem function, the rate of which increases as diversity loss increases.
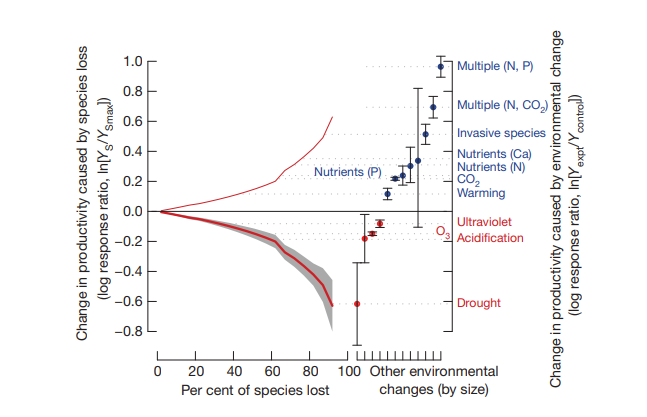
Shows that the impact of biodiversity loss is greater than or rivals the effect of other major global change drivers, with changes resultong in reduced productivity. Graph shows rivet redundancy.
Graph shows that the effects of biodiversity as a driver of global change grow stronger over time, unlike other drivers such as climate change or habitat loss, which may have diminishing returns on their impacts.
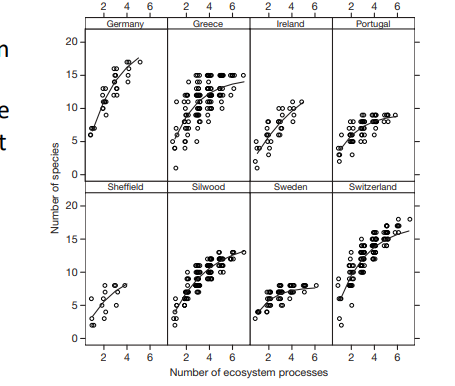
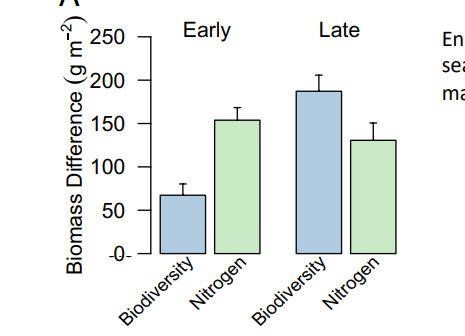
Demonstrates how the increase in species richness correlates with enhanced number of ecosystem processes. Therefore the more functions an ecosystem is conserved for, the more vital biodiversity.
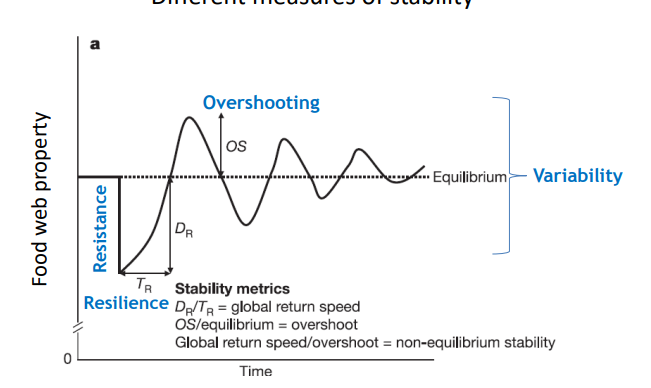
Graph demonstrating the different measures of stability and how they affect food web properties. The level of fluctuation depends on resistance - the ability to absorb stress without changing, and resilience - the rate to recover after disturbance.
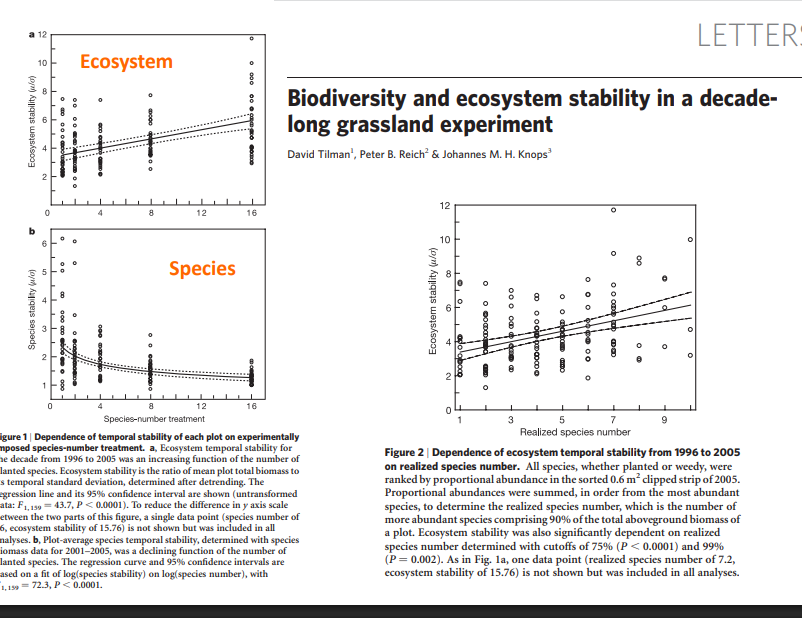
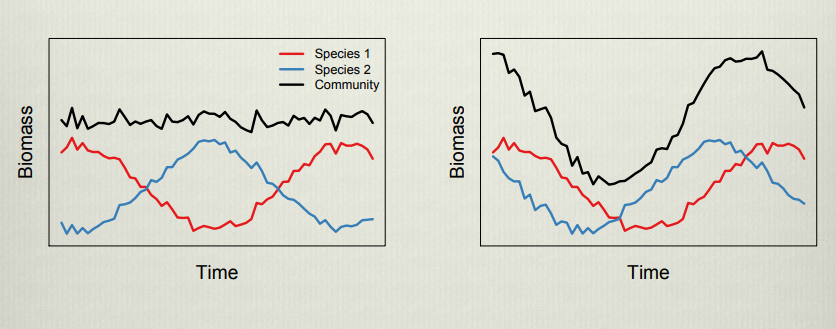
Graph shows that ecosystem stability increases with species diversity, at the expense of individual population diversity. This increase in stability is because variation of all species’s aggregate abundance in a trophic level is lower than the average variability of each component species aggregate abundance
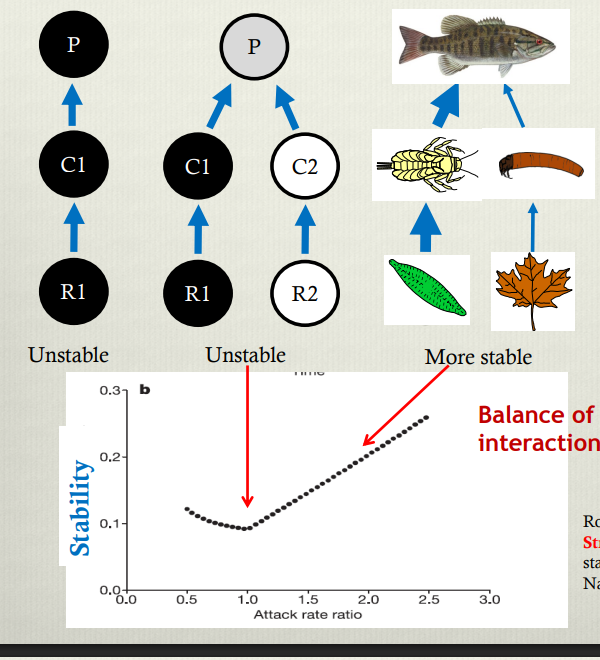
Shows that by including natural variation in interaction strength in a model of complexirt and stability, complex food webs exhibit highert overall stability becayse the balance of weak and strong interactions balances stability.
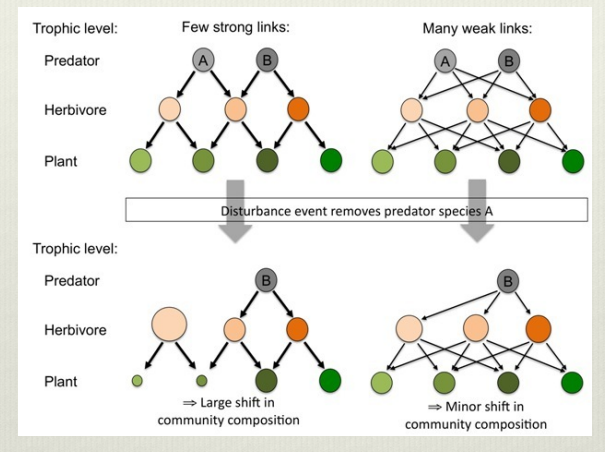
Shows how the relationship between complexity and stability varies depending on whether there is a balance of strong and weak interactions. WHile coupling two interaxtion chains without including a natural variation in interaction strength which occurs due to competition would result in a decrease in complexity from the uncoupled, including leads to an overall increase in stability dye to the balancung effect of the differeing interaction strength.
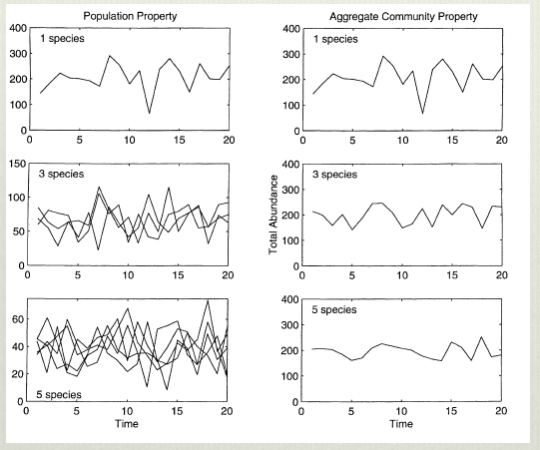
Shows that the variation of species aggregate abbindance is decreased compared to their individual populaytion fluctuations, demonstrating how increasing complexity increases stability in ecosystems. This is otherwise known as the portfolio effect
Shows that the stability of a community is dependent on whether interacting species have negative or positive co-variation. positive co-variation, which occurs in a system under strong bottom up control shows higher community variability which is likely to lead to population crashes.
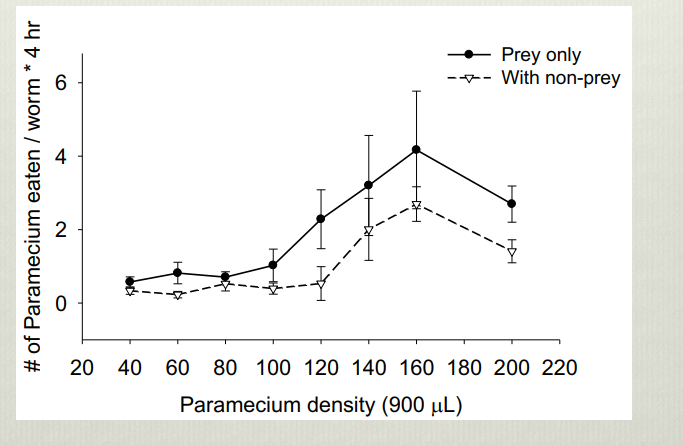
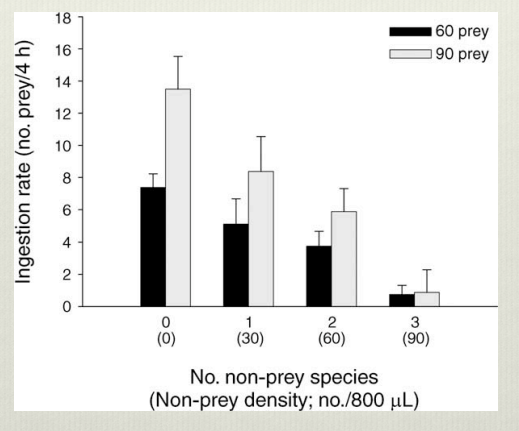
Shows that the presence of non prey species in a community reduce the fluctuation in prey species number. This is because non prey species reduce the attack rate of predators, due to behaviors that distract predators. The same effect can be achieved with increased diversity due to the presence of multiple prey species, which dilutes predation pressure and stabilizes prey populations.
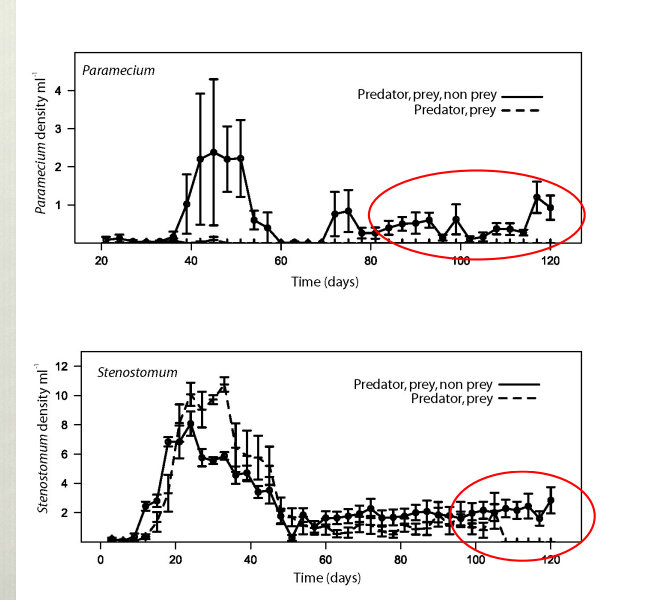
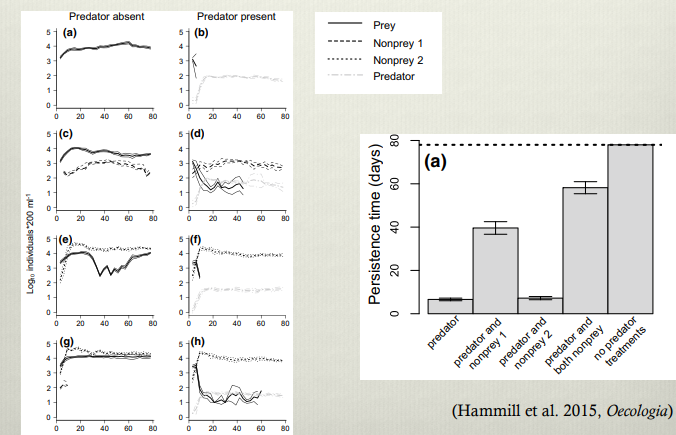
non prey reduce fluctuatuon in pop density and increase the time that a population is able to persist despite interspecific competition. Indicaties that higher diversity increases chance of coexistwnce
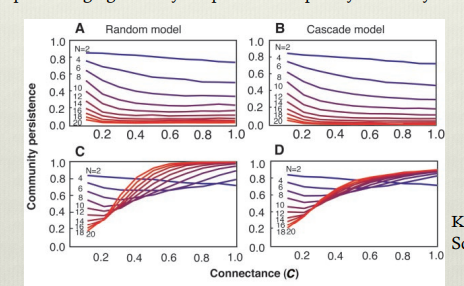
Shows that adaptive foraging yields a positive complexity stability relationship, with increasing connectance resulting in increased persistence due to stability only in systems with adaptive foragers. This shows to be true in both random models and the more realistic cascade models.