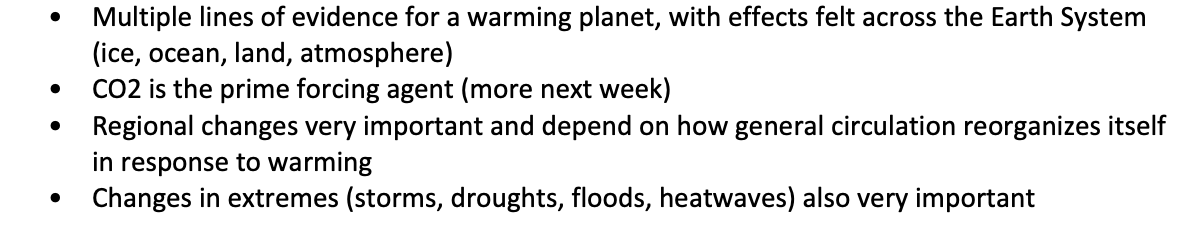
Observed Climate Change
1/21
Earn XP
Description and Tags
Flashcards covering key vocabulary and concepts related to observed climate change, including temperature measurements, data collection methods, and evidence of climate change effects on Earth's systems.
Name | Mastery | Learn | Test | Matching | Spaced | Call with Kai |
|---|
No analytics yet
Send a link to your students to track their progress
22 Terms
Proxy Records
Used to calculate or estimate temperature changes over the last 65 million years
indicates changes in rainfall and other weather but does not measure it directly.
Temperatures
temp cycles linked to glacial and interglacial periods
small changes in Earth’s orbits around the sun set in motion large changes in Earth System
processes operating over 10k - 100k years timescales
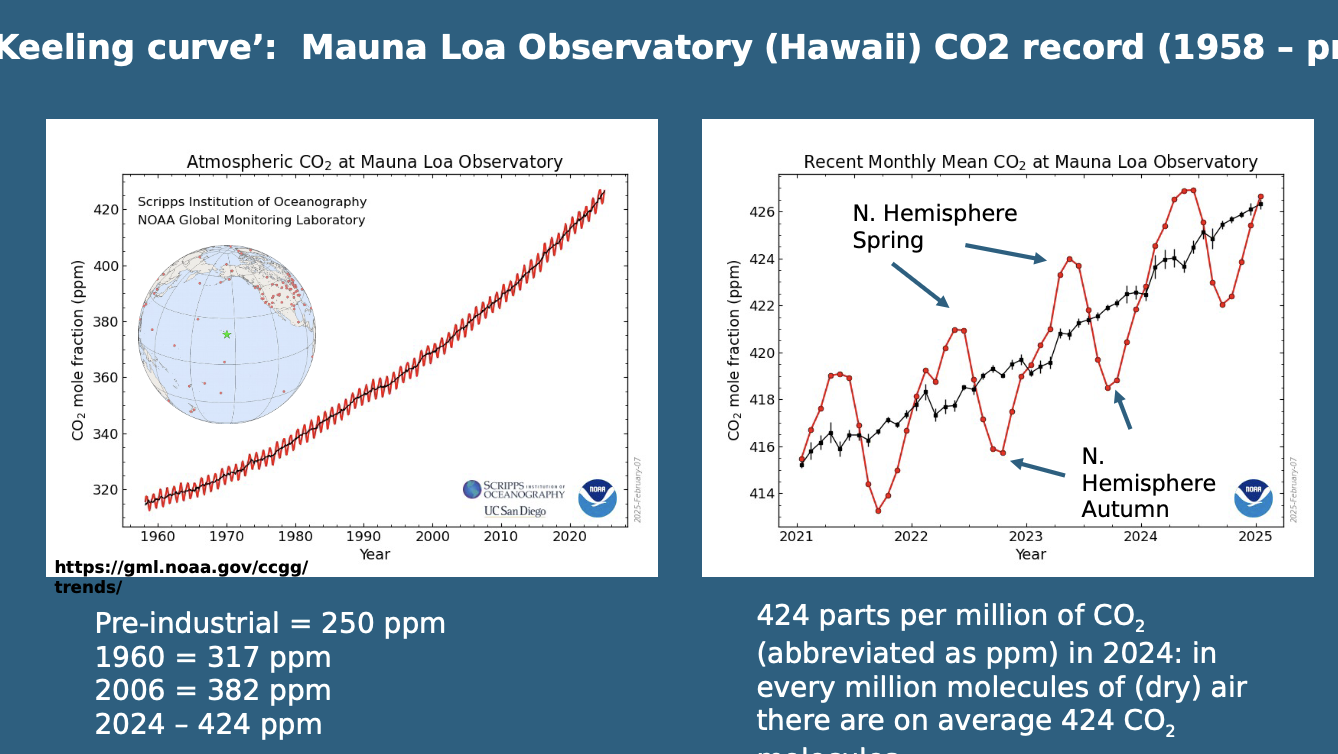
Mount Loa CO2 Charting - changes in CO2 concentration
Charts carbon dioxide levels in the atmosphere over a long period, showing a steady rise since measurements began in 1958.
Human-induced CO2 Rate Today
Approximately 203 ppm/year, contributing to an increase in atmospheric opacity and radiation imbalance.
CO2 has been higher in the pst e.g. 65 million years to 2 million years ago
Importance of C02
CO2 important for radiation balance
as Co2 increases atmosphere is more opaque - infrared radiation = radiation imbalance
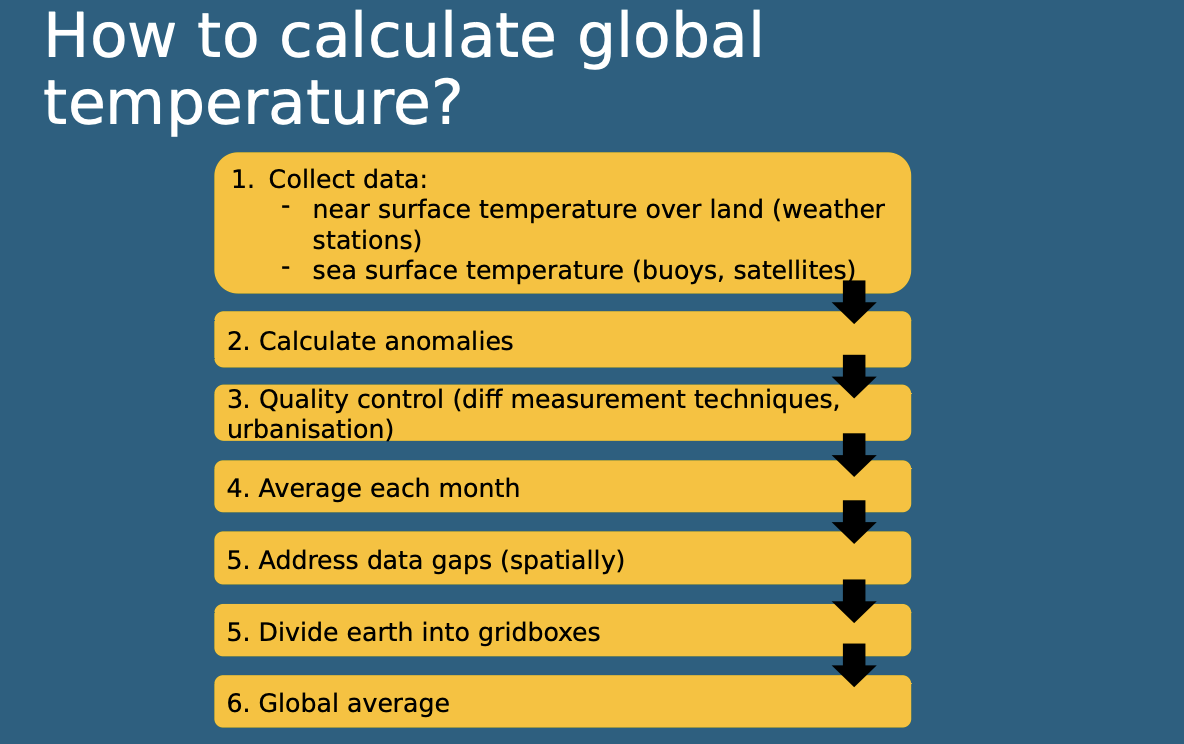
Changes in global temperature - how to calculate it
Satellite Data Sets
Available since the late 1970s to 1980s, used to track changes in global temperature using anomalies relative to mean temperature.
Anomalies
Temperature measurements that are relative to mean temperature, used to avoid biases in global data sets.
measuring temperatures - sea surface temperatures
relying on buckets in the 20th century
biases associated with the bucket method
water evaporating in bucket as lifting it so it would seem colder than it is
last 40 years now have buoys
recent records of temperature

Land and Ocean temperatures
Land tends to warm faster than oceans
Evaporation over oceans offsets warming relative to land which tends to be drier
Atmospheric temperature trends
Measured by:
Radiosondes - Instruments attached to weather balloons, used to record atmospheric conditions up to the top of the atmosphere
Satellites
Reanalysis (models which incorporate various observational data)
Lower-tropospheric temperature are increasing
Vertical distribution of temperature change in troposphere is important for atmospheric stability
Stratosphere is cooling
key evidence of climate change
warming troposphere and cooling stratosphere
reason for cooling - 80s/90s - depletion of ozone - less radiation being absorbed by ozone
increase in greenhouse gases in troposphere - less energy in infrared part - less energy in stratosphere
Ocean Heat Content
Tracks changes in the oceans, which store approximately 90% of excess heat energy in the Earth's climate system due to GHG-induced radiative imbalance.
Atmosphere has low specific heat capacity compared to oceans
Heat stored by oceans will be released to surface
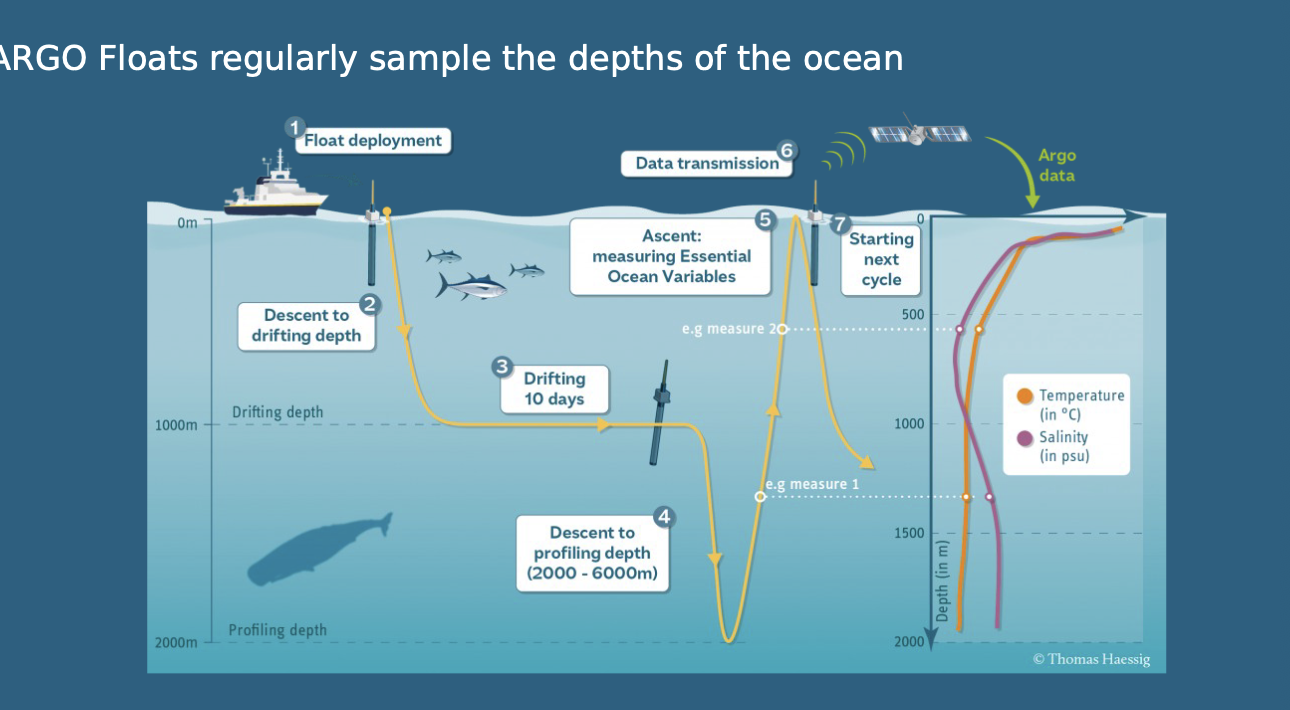
Argo Floats - Ocean heat content measurement
Launched from ships to drift around the surface, descend to 1000m and then 2000m, measuring temperature changes and sending data back to satellites.
Ocean heat content anomalies + uncertainties by depth
Reference Glaciers
Representative glaciers in different regions that have all decreased in mass over the past 70 years due to more ablation than input.
Ice sheets over continental regions - both Greenland and Artic
Artic slightly lower
Sea level rise - Tidal Gages
Located at coastlines and estuaries, used to measure sea level rise relative to land; now supplemented by satellite data.
Global sea level trends - Active Remote Sensing
Technique involving sending a pulse down and measuring the time taken for it to return, used to determine depth.
most of the earth has experienced sea level rises
Sea level change
rates of local sea level on coast can be:
larger than global average due to geological processes like ground setting
smaller than global average due to processes like the centuries-long rebound of land masses from the loss of ice-age glaciers
Reasons for sea level rise
thermal expansion
added water, mostly due to glacier melt
between 1993 + 2018:
melting ice sheets and glaciers accounted for 44% of sea level rise
thermal expansion of water accounted for another 42%
Summary