1. Introduction and Macroeconomic Equilibrium in Short Run
1/31
There's no tags or description
Looks like no tags are added yet.
Name | Mastery | Learn | Test | Matching | Spaced |
|---|
No study sessions yet.
32 Terms
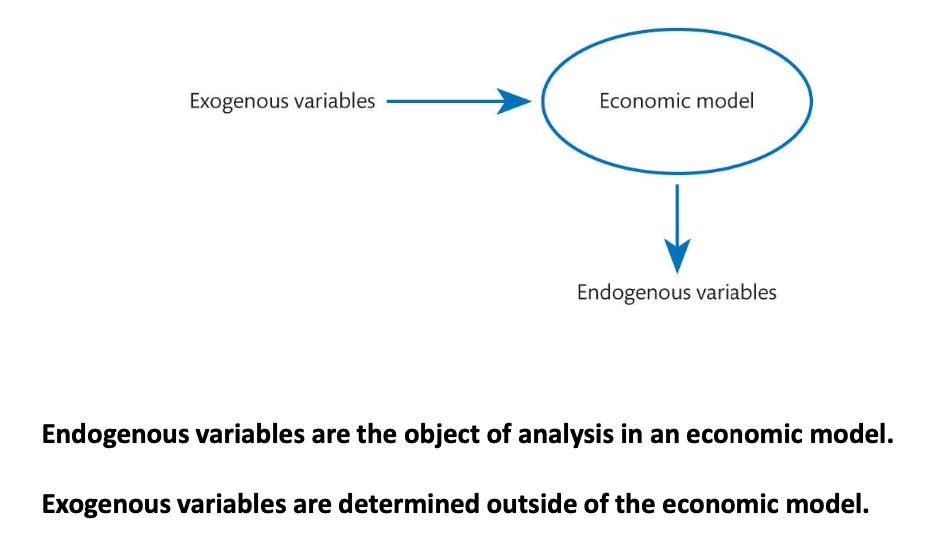
What is the difference between Endogenous variables and Exogenous variables?
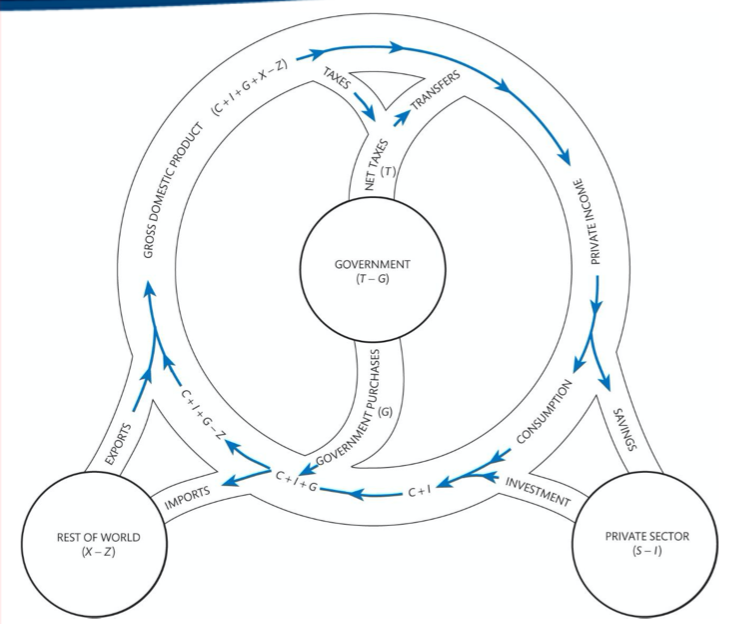
Explain The Circular Flow Diagram
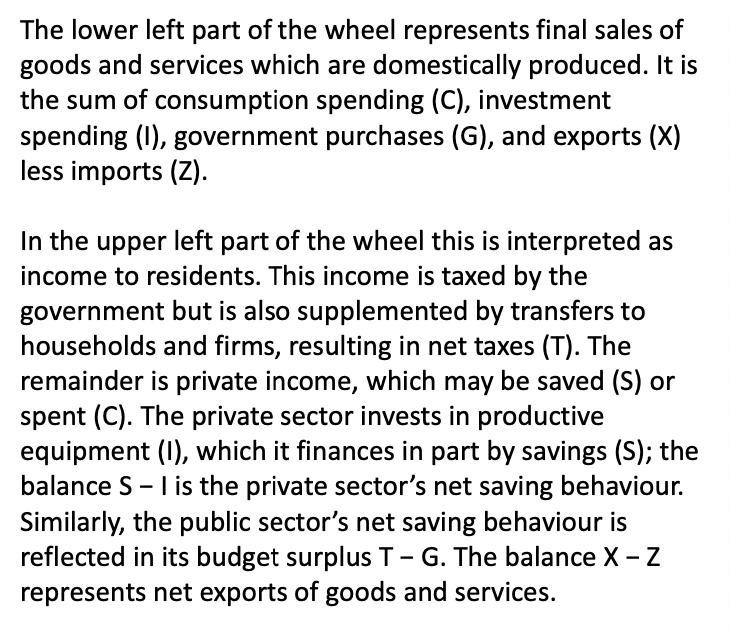
Two formulas for GDP
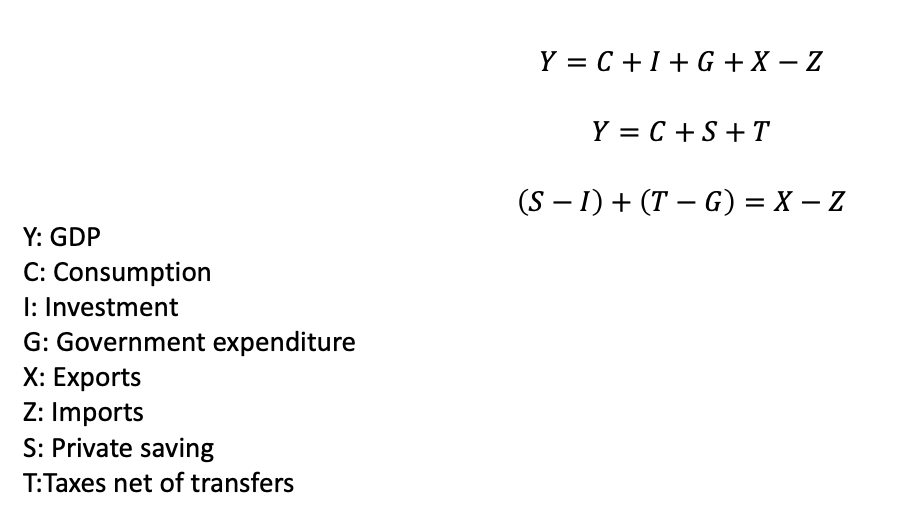
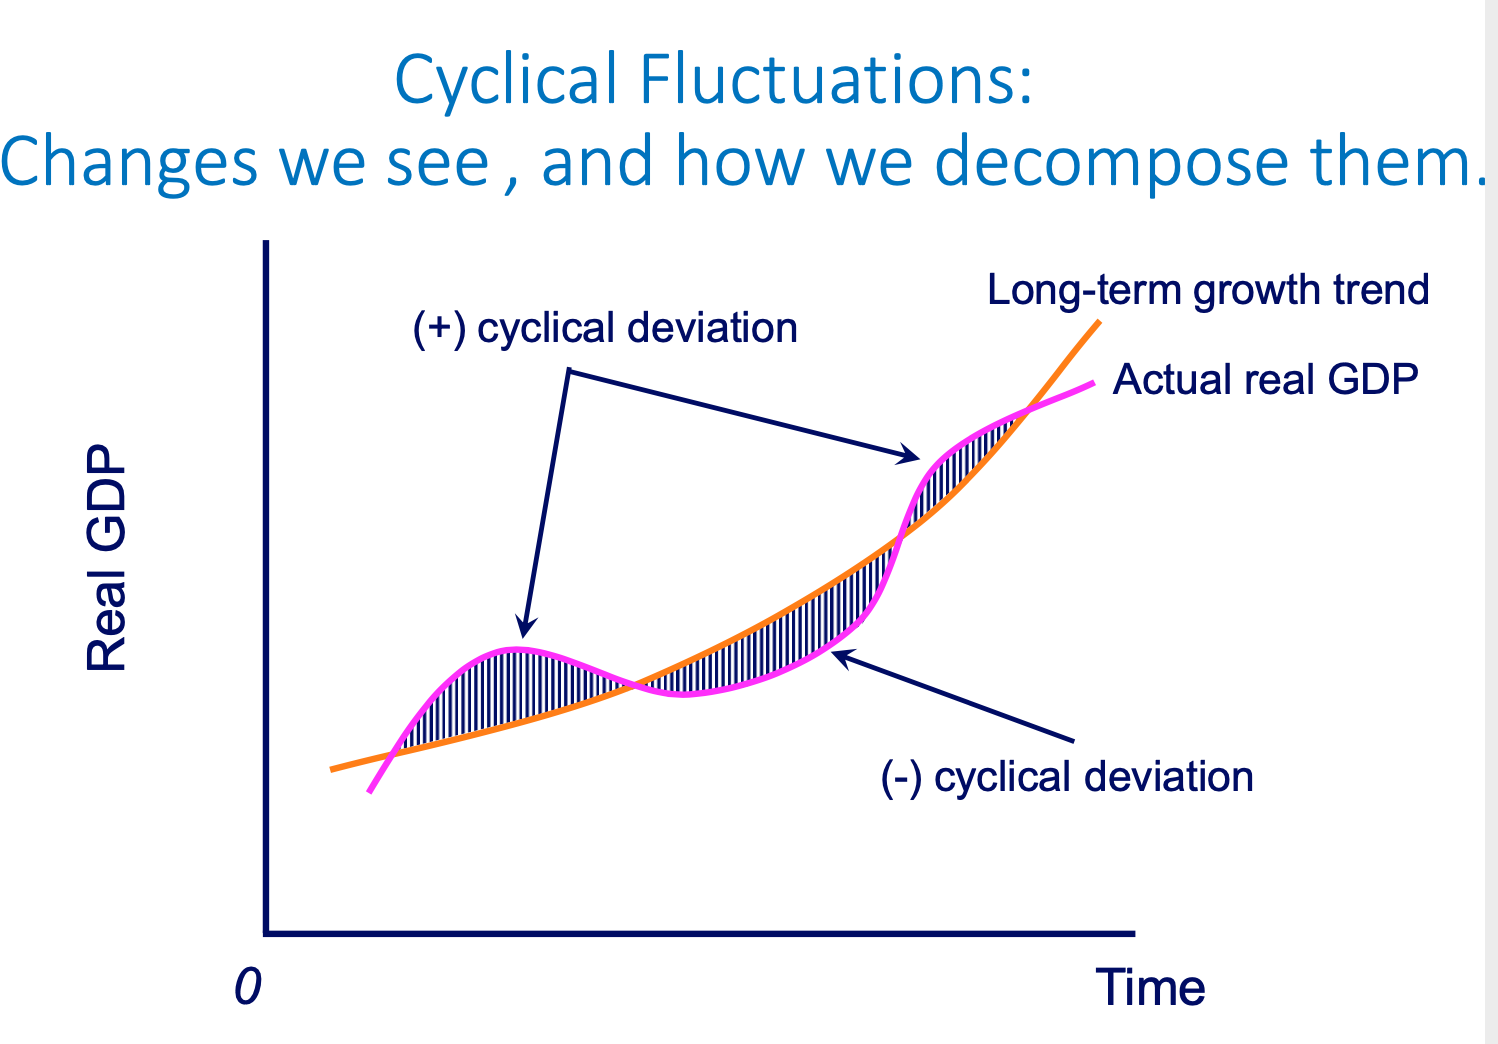
Cyclical Fluctuations diagram: Changes we see, and how we decompose them
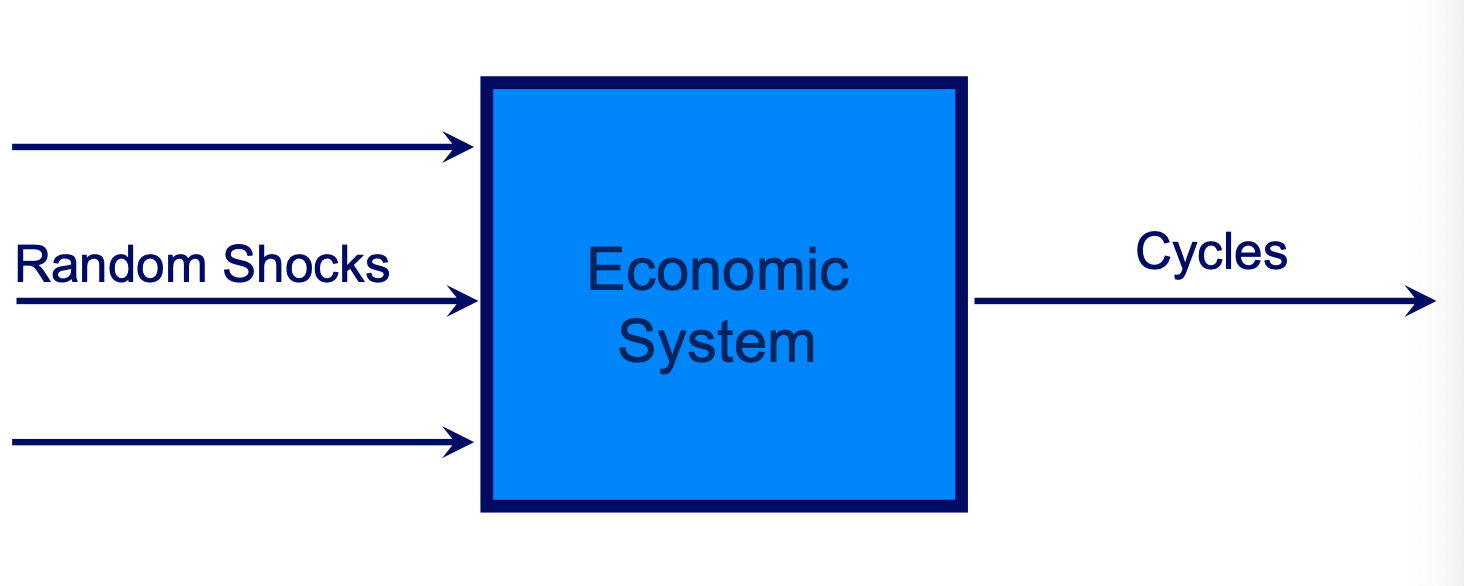
Impulse-propagation mechanism diagram
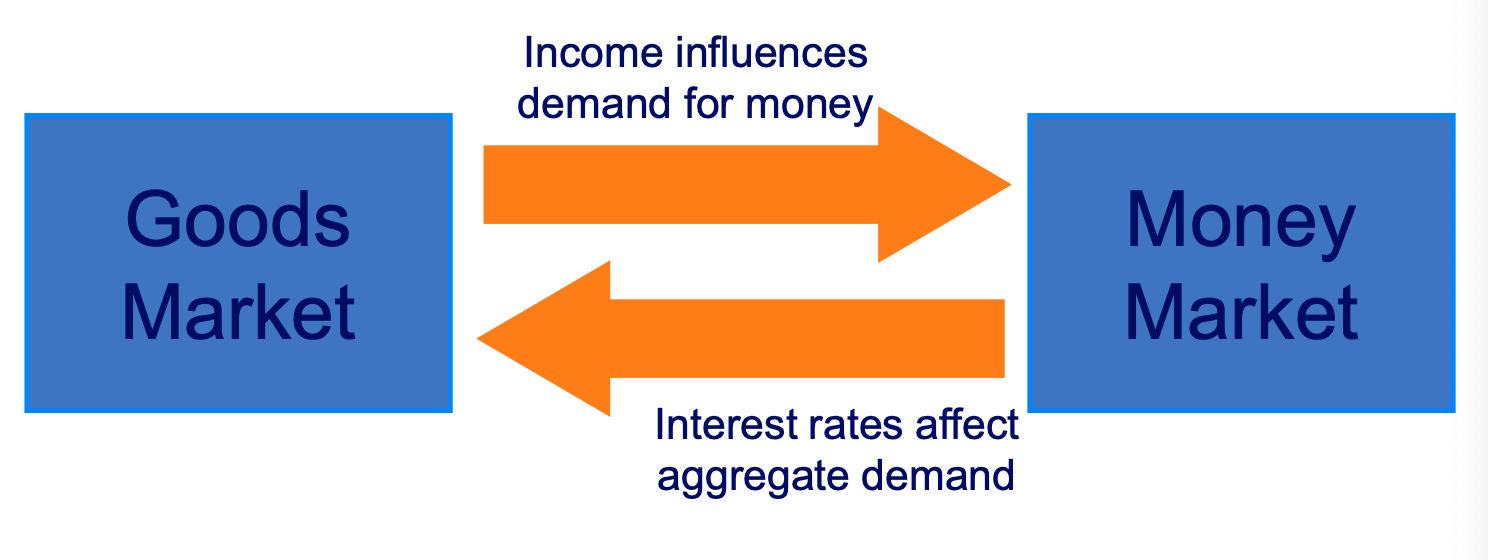
Interaction of markets in the closed economy diagram
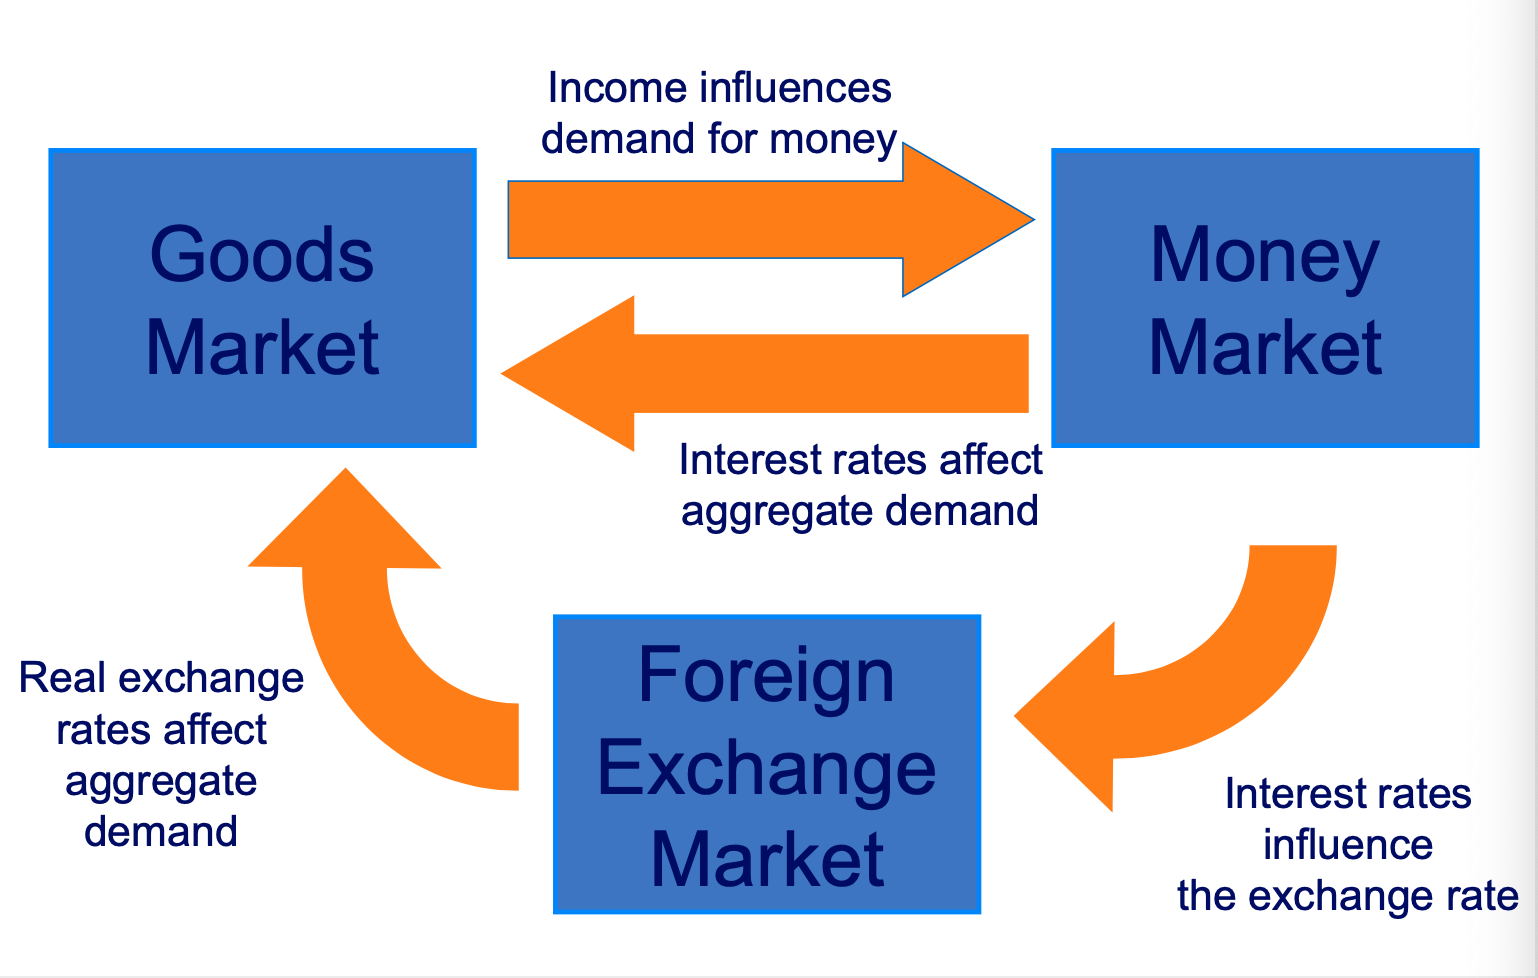
Interaction of markets in the open economy diagram
How do conditions in domestic and money market affect each other?
Interest rates and exchange rates influence aggregate demand.
Income affects the interest rate set by the Central Bank via the Taylor rule.
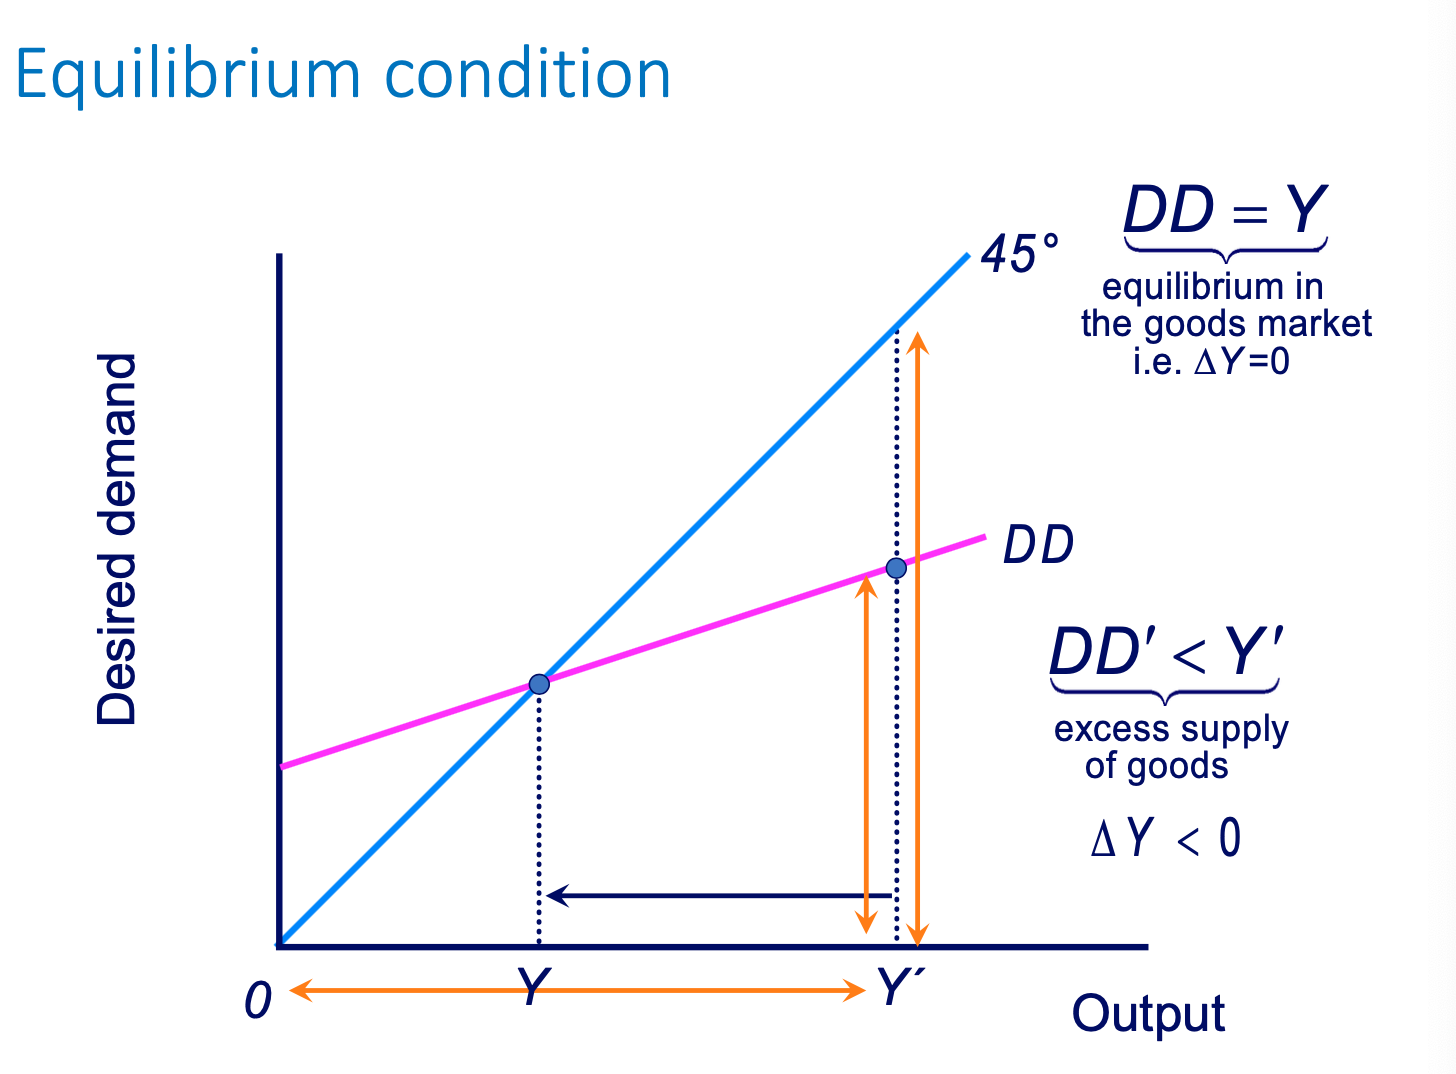
General equilibrium occurs when equilibrium conditions in each market are consistent with each other
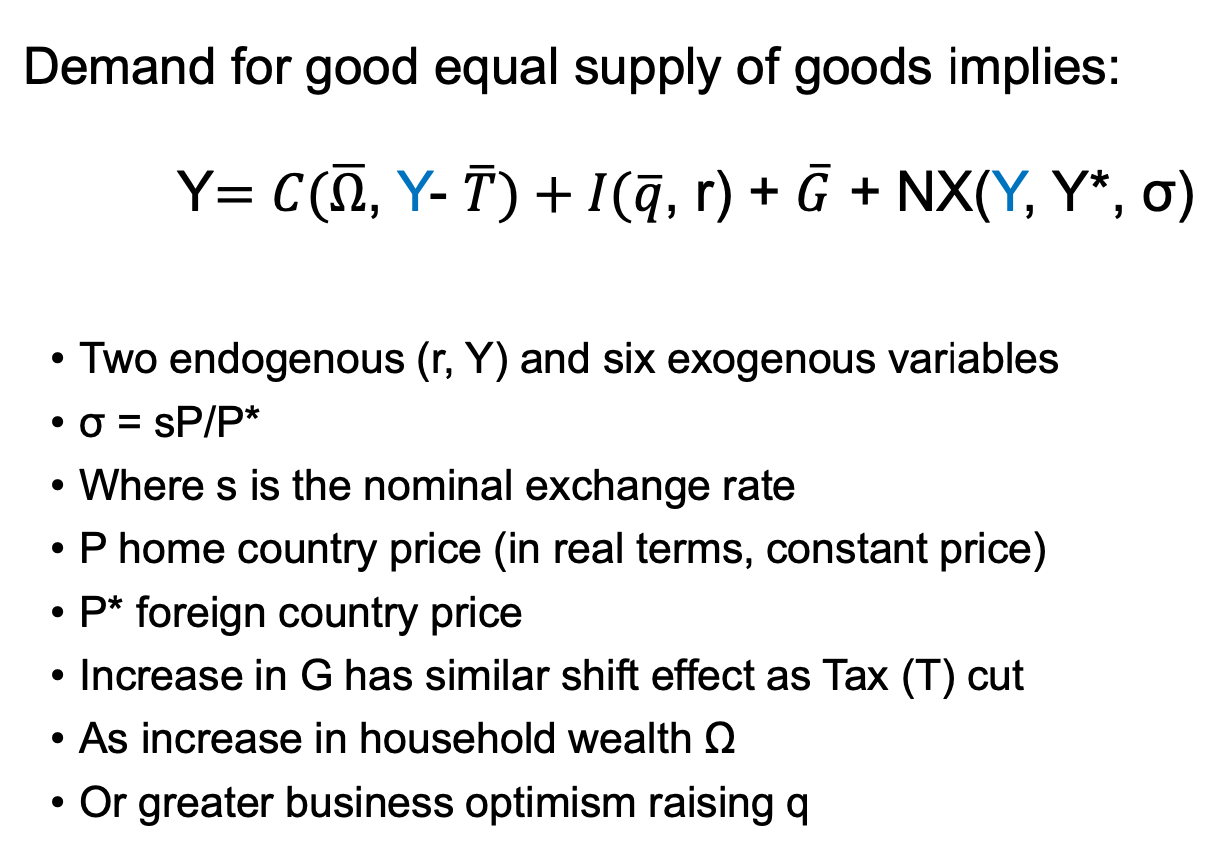
Equation for goods market equilibrium
Goods market equilibrium diagram
Goods market equilibrium equation with Keynesian multiplier
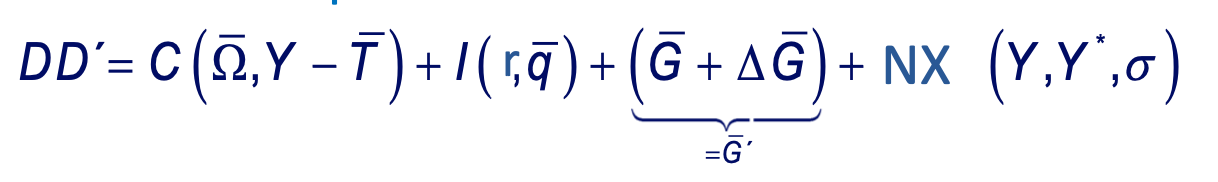
Goods market equilibrium diagram with Keynesian Multiplier showing an increase in government expenditure
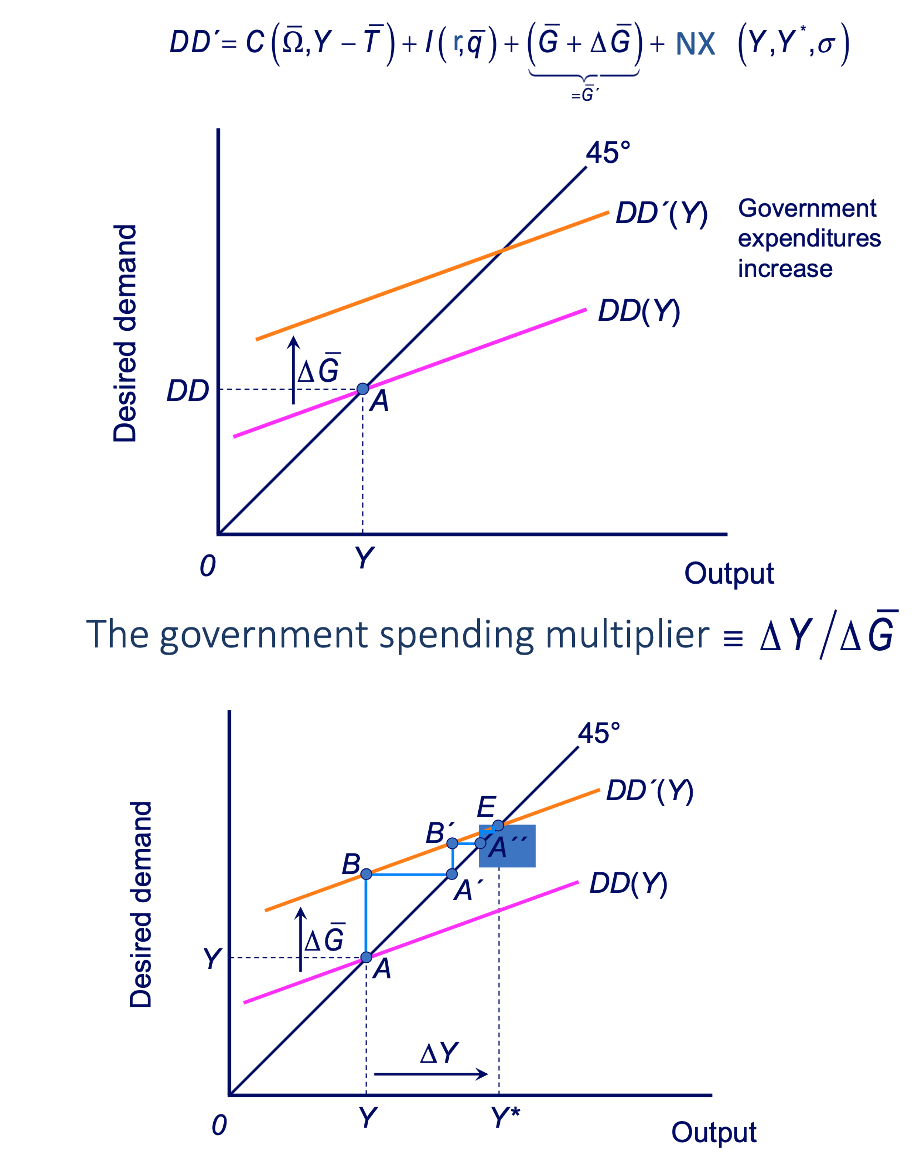
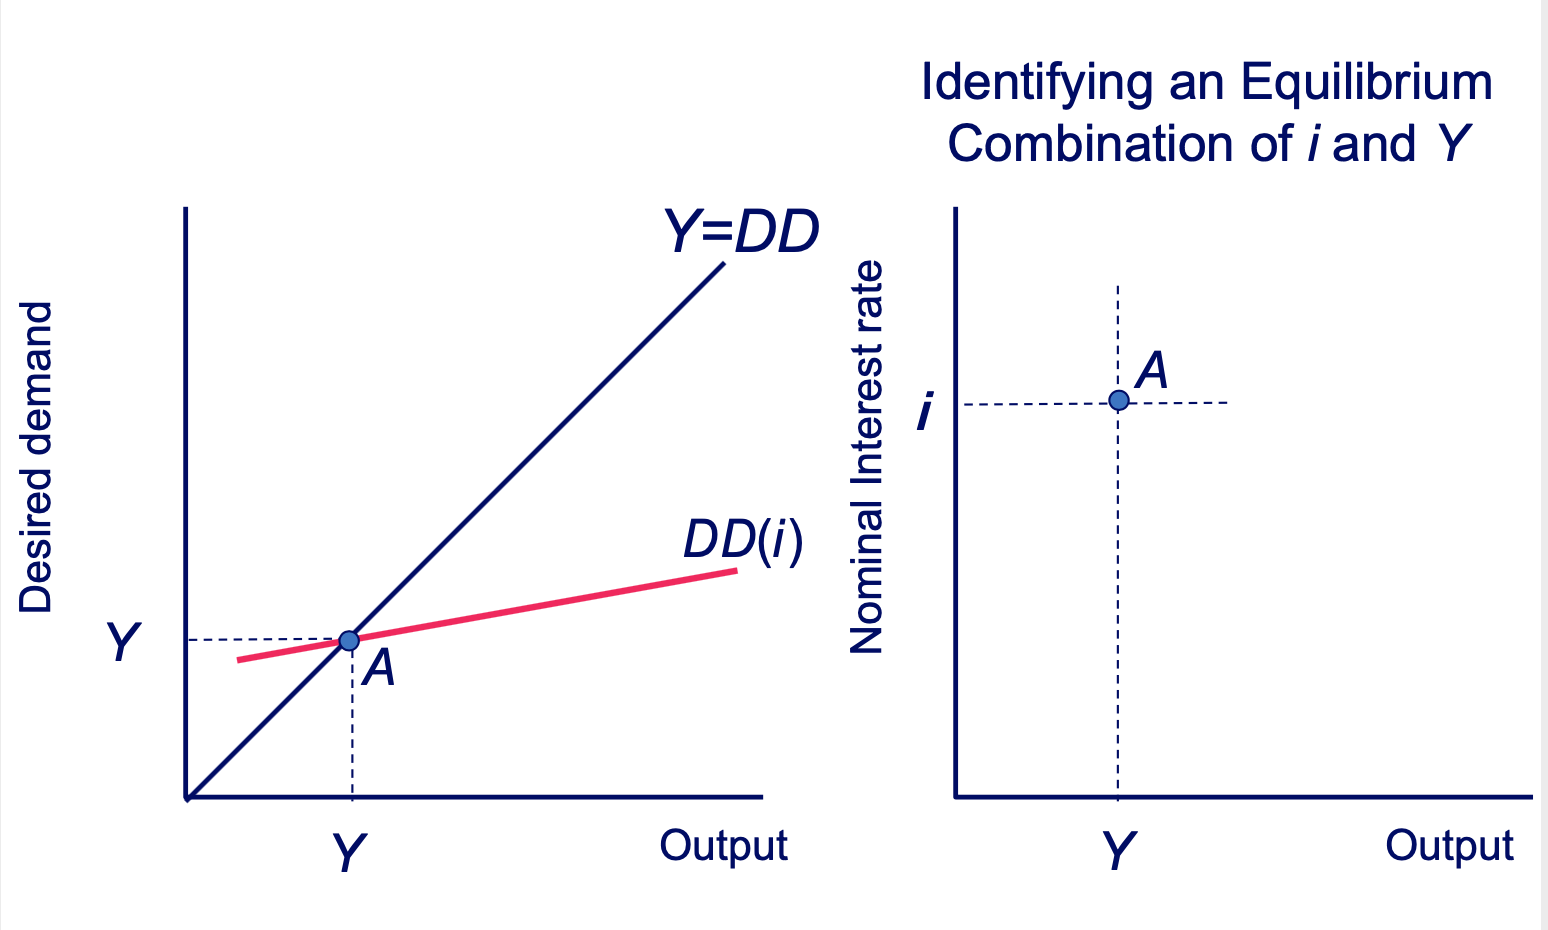
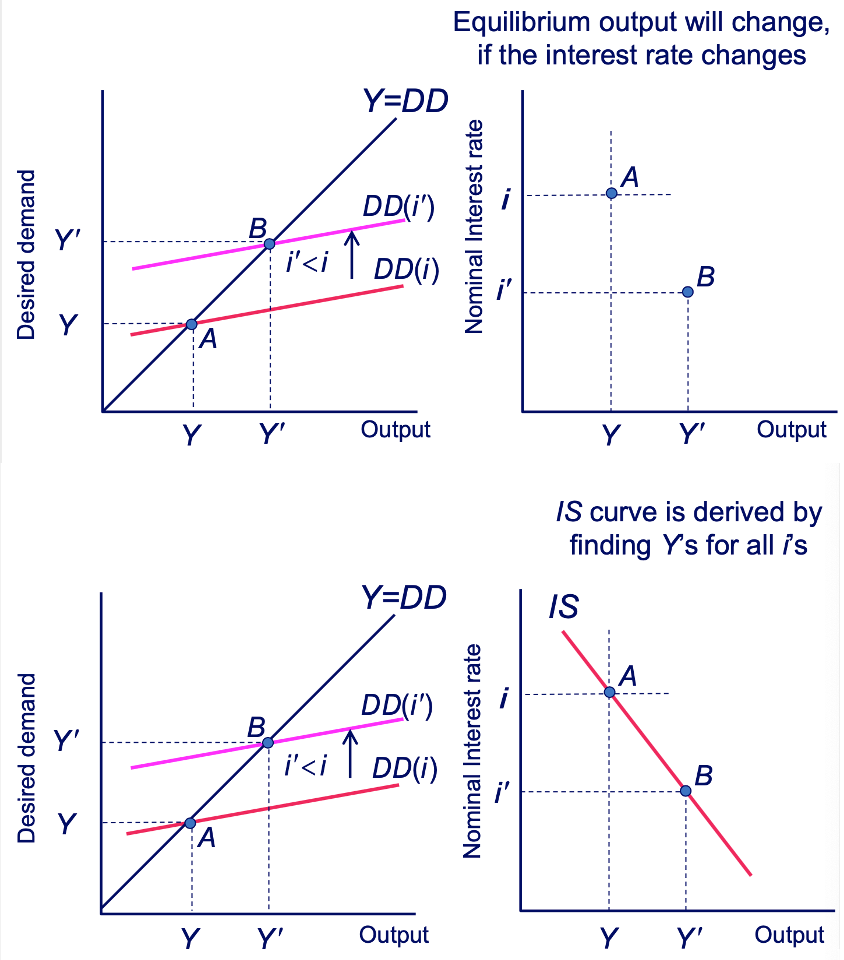
What happens to aggregate demand when interest rates change?
A rise in interest rates affects investment costs andprofitability so reducing the investment component of aggregate demand
The multiplier effect of such a change is captured by the IS curve, a relationship between the interest rate and demand
The IS curve describes conditions for equilibrium of demand and output in the goods market
Deriving the IS Curve: Initial Equilibrium Diagram
Deriving the IS Curve: Interest Rate Change Diagram
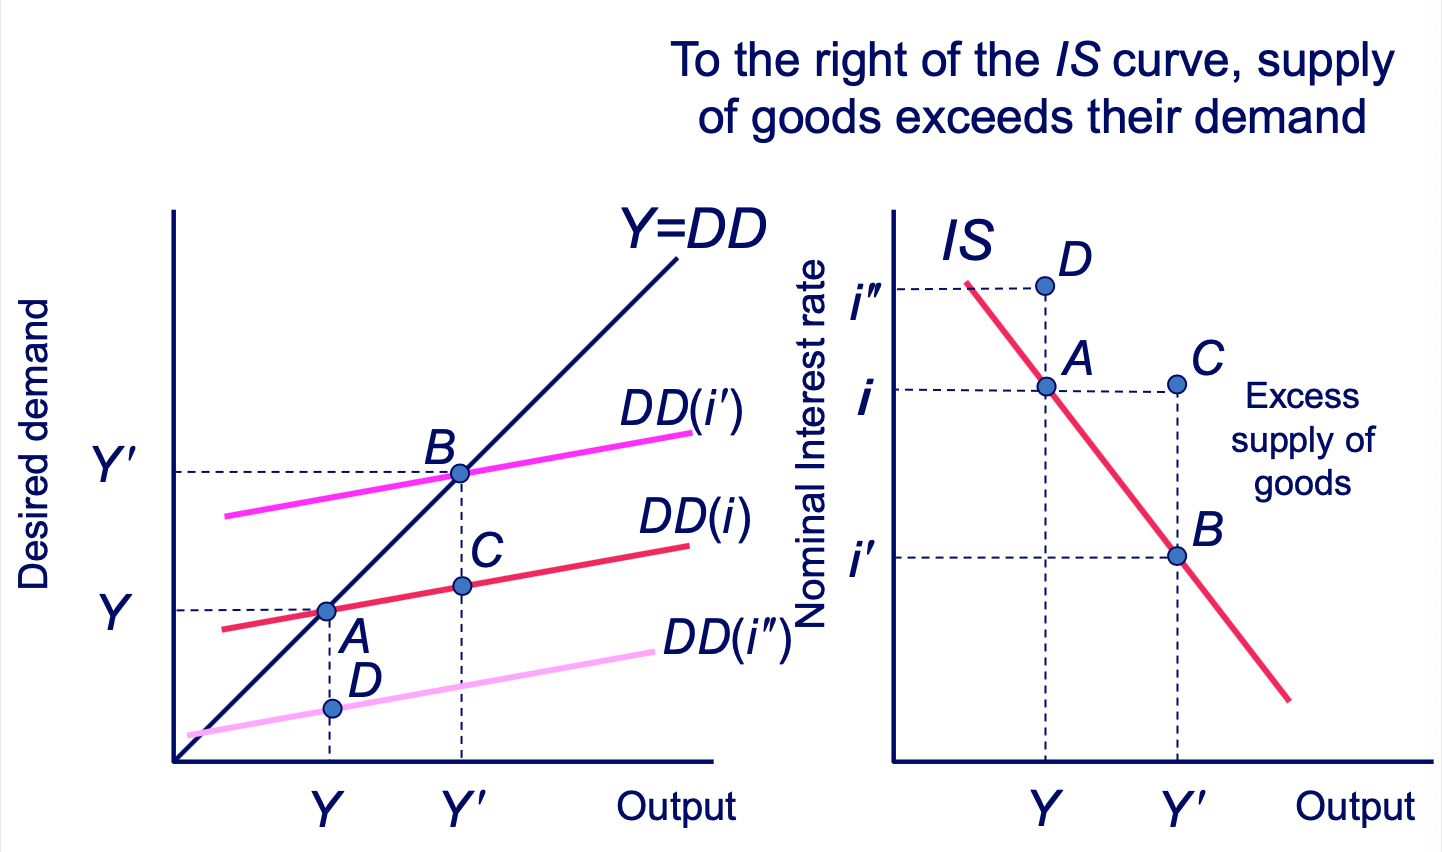
Deriving the IS Curve: Excess Supply Diagram
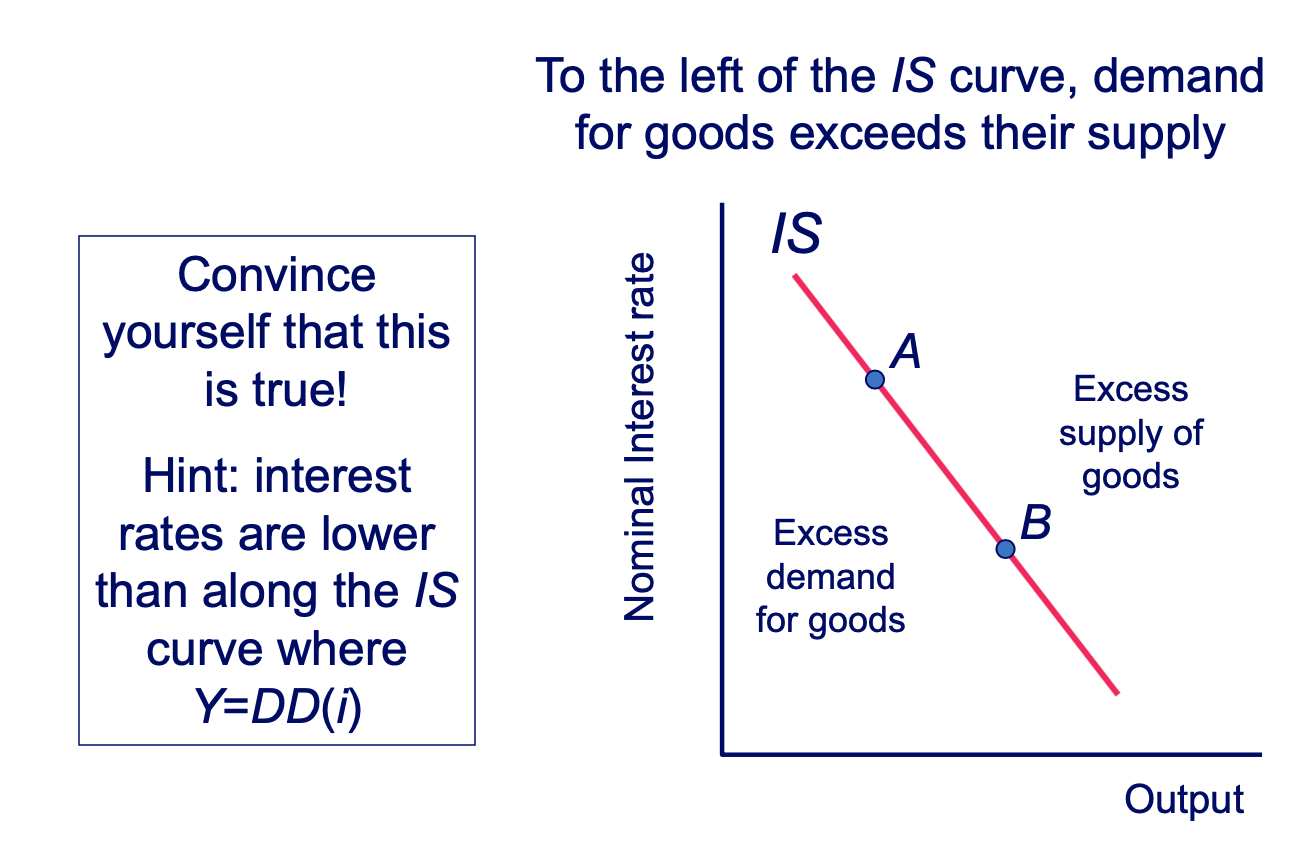
Deriving the IS Curve: Excess Demand Diagram
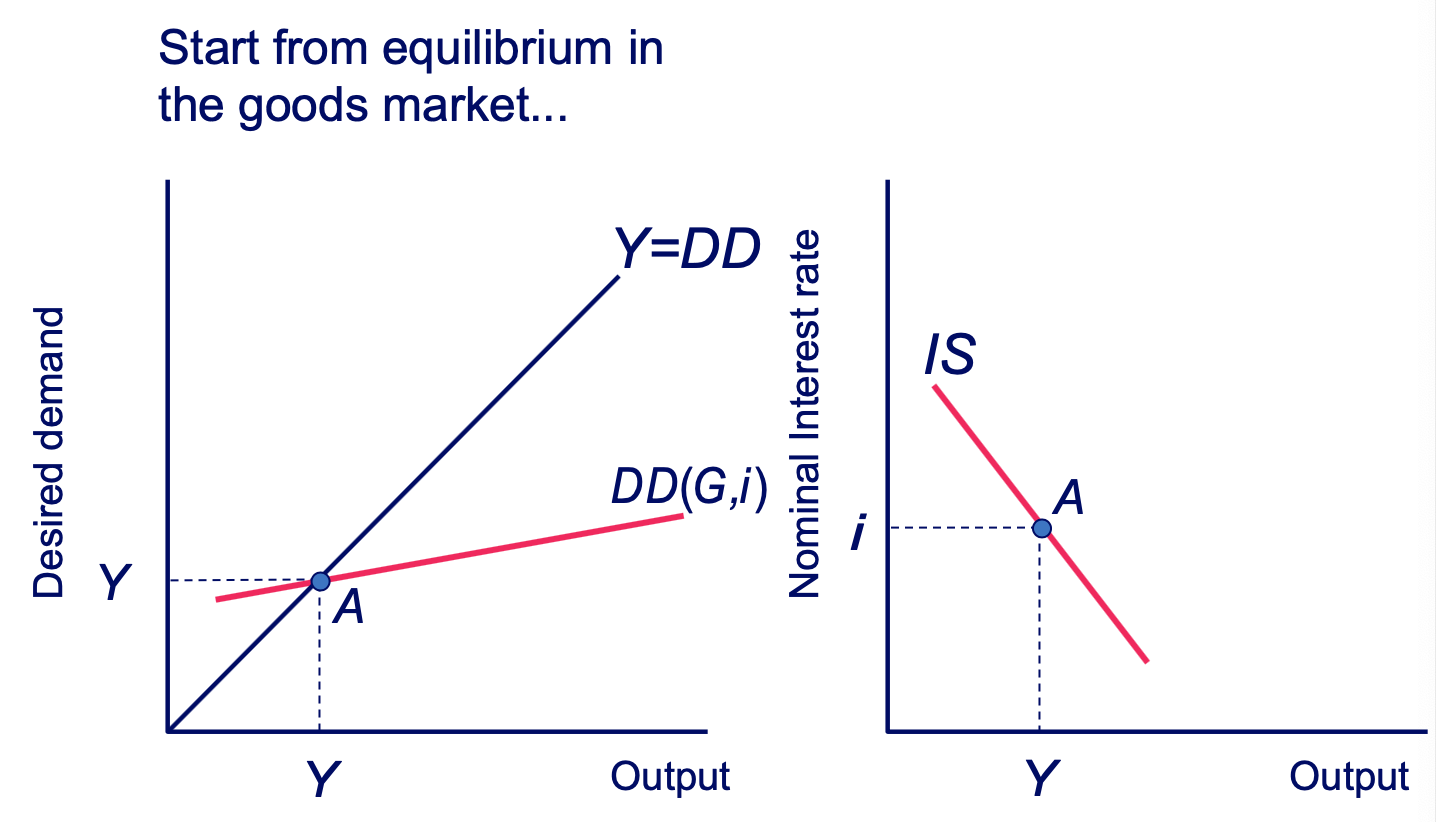
Movement of the IS Curve: Aggregate Demand - Initial Equilibrium Diagram
Movement of the IS Curve: Aggregate Demand - Exogenous Increase Diagram
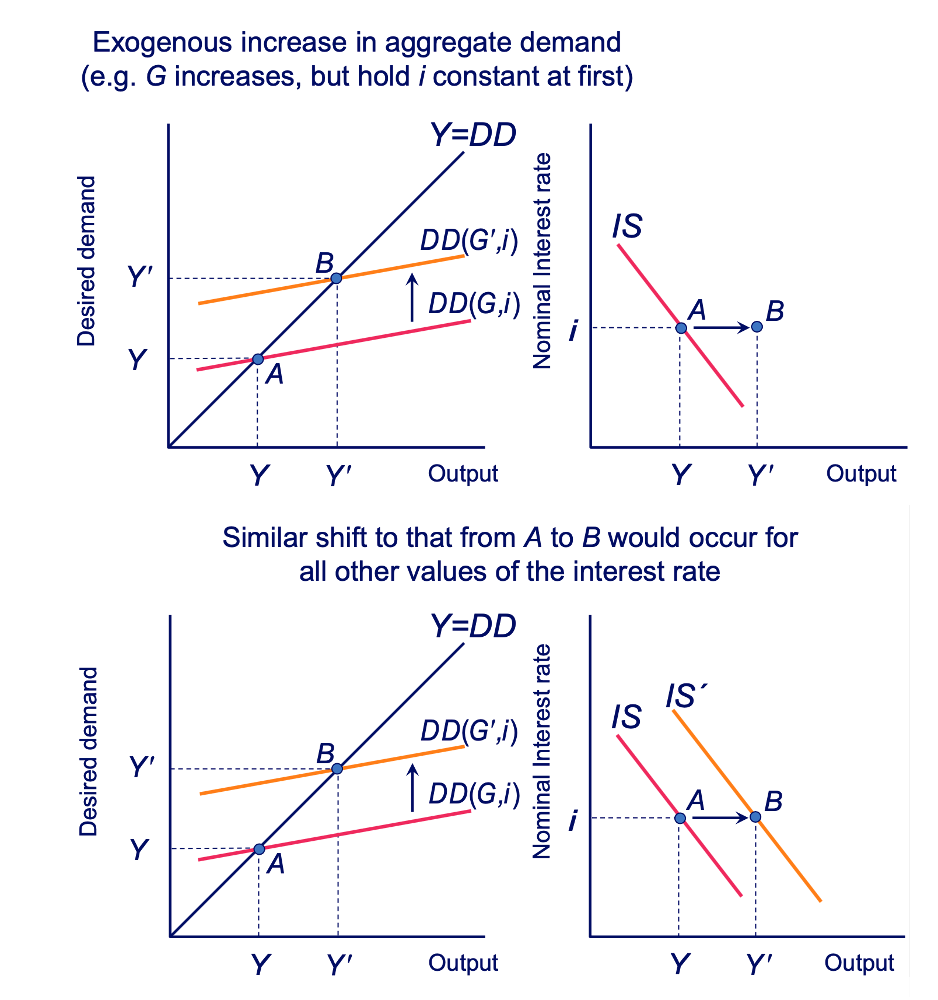
Movement of the IS Curve: Aggregate Demand - Shift of IS Curve Diagram
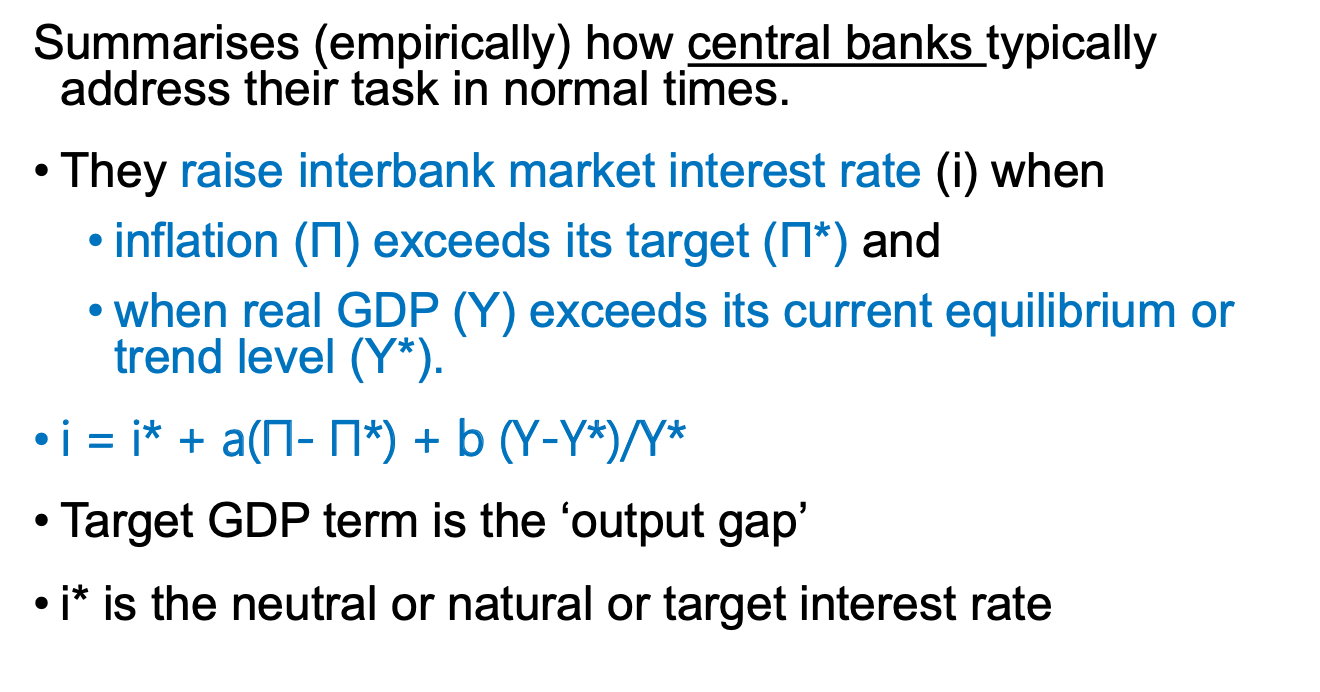
What is The Taylor Rule?
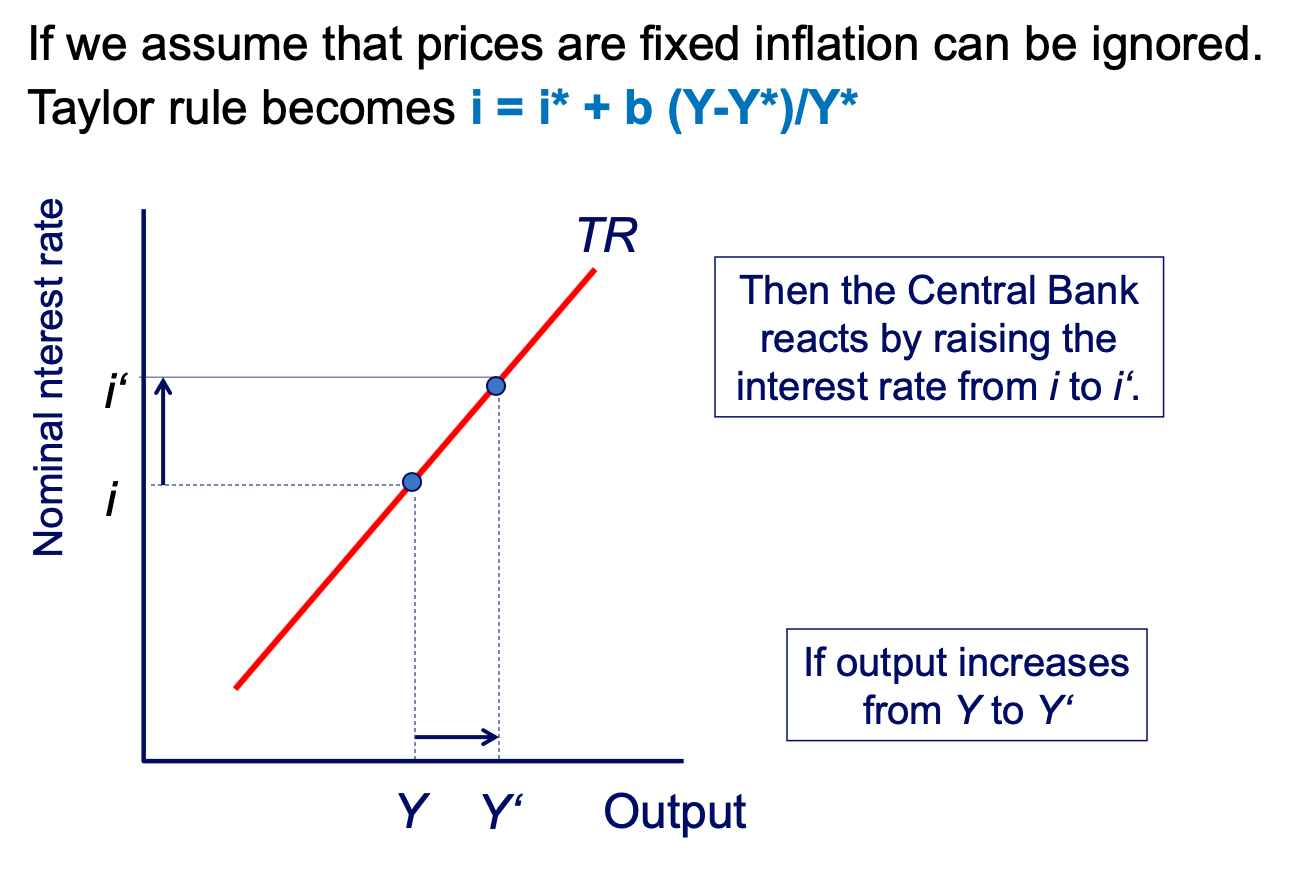
TR curve diagram
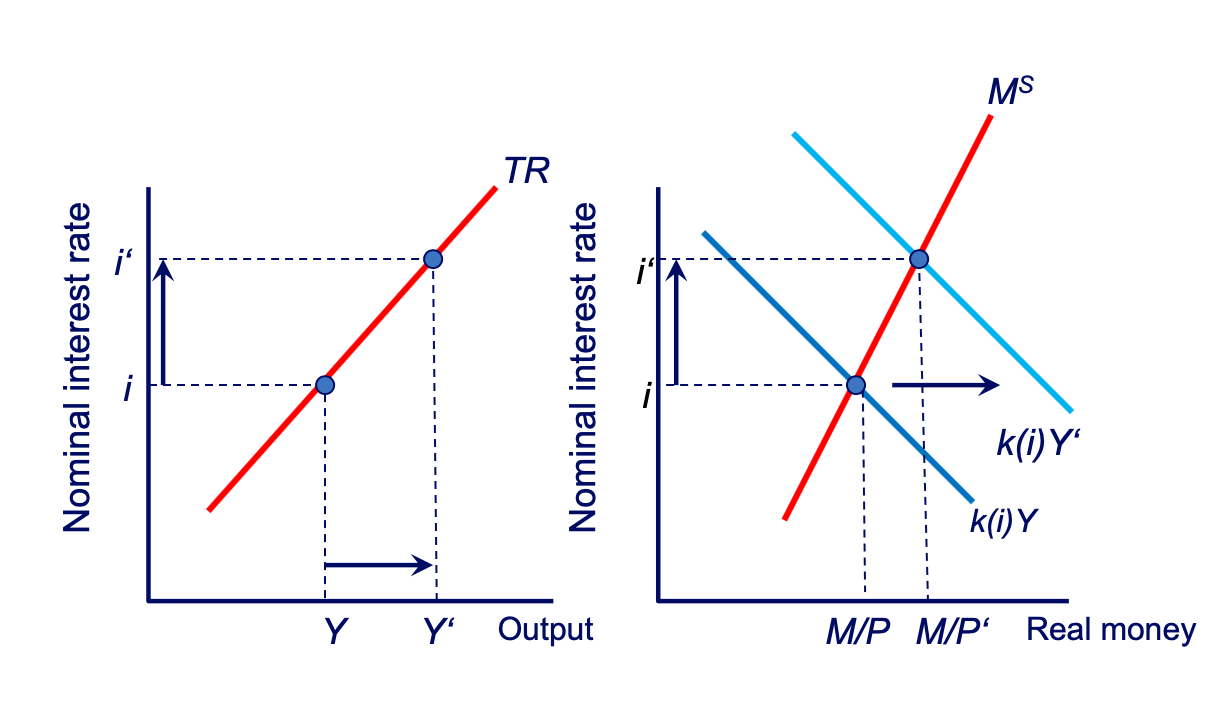
TR Curve and Money Market Equilibrium diagram
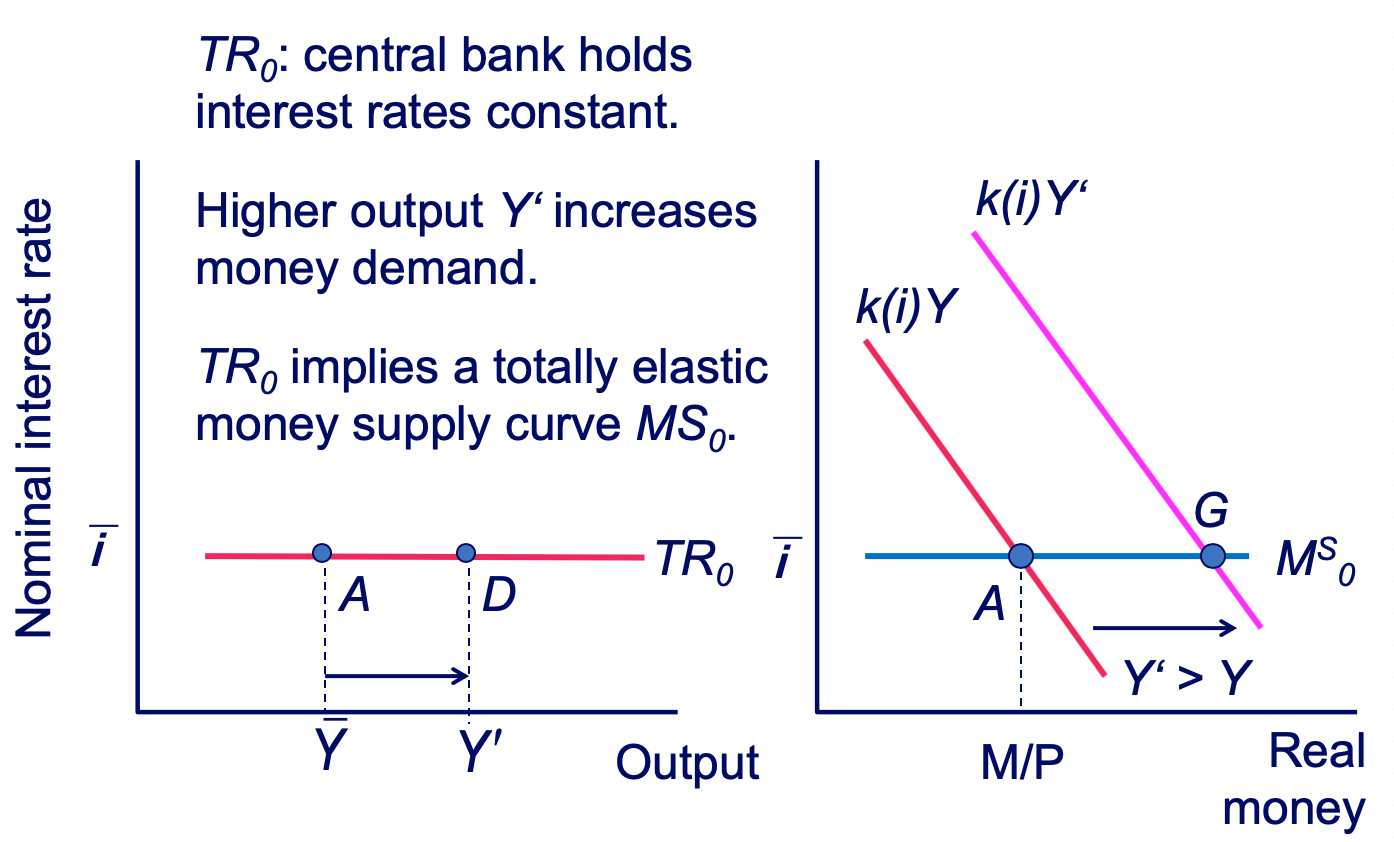
The Slope of the TR Curve: TR0 diagram
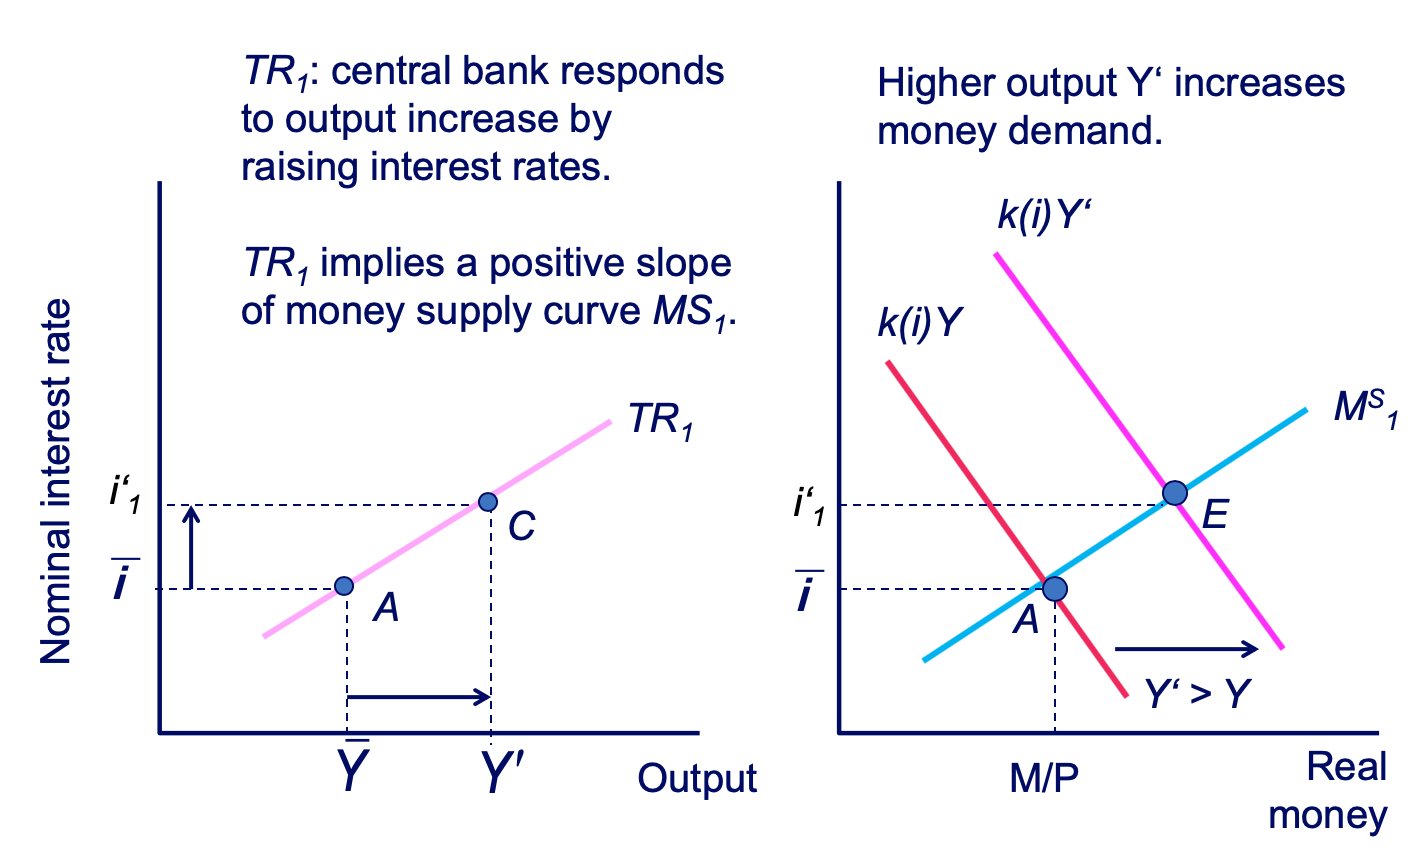
The Slope of the TR Curve: TR1 diagram
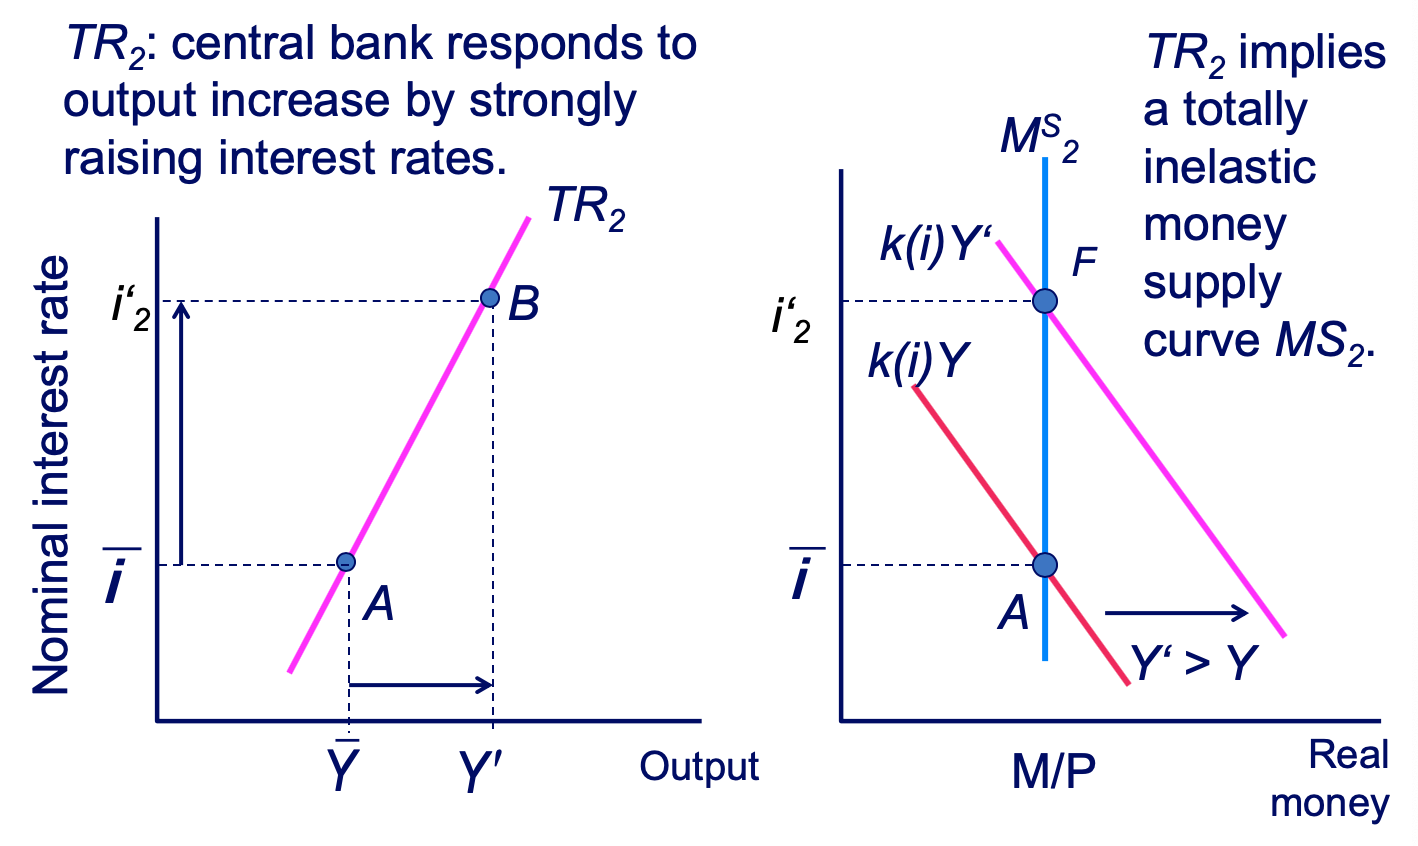
The Slope of the TR Curve: TR2 diagram
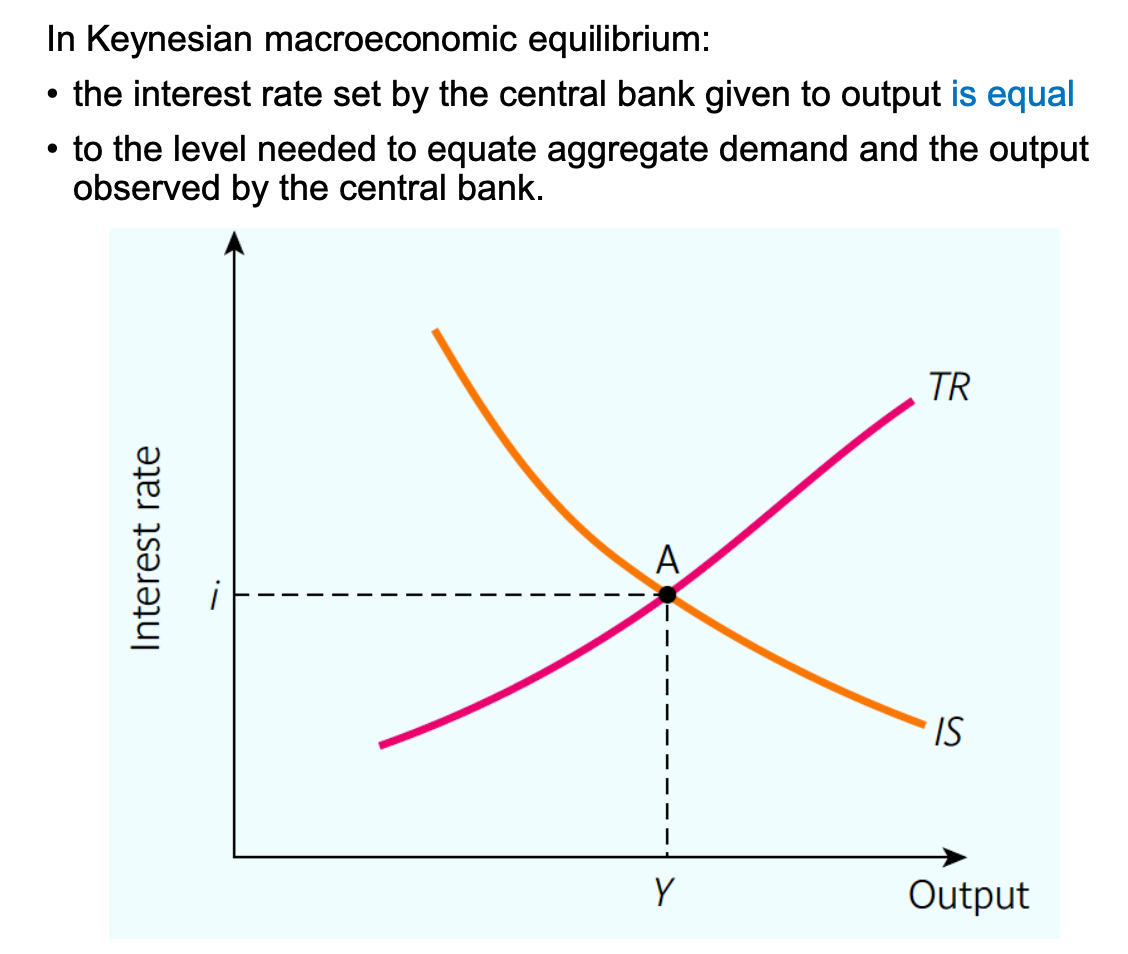
Macroeconomic equilibrium in the IS-TR model explanation and diagram
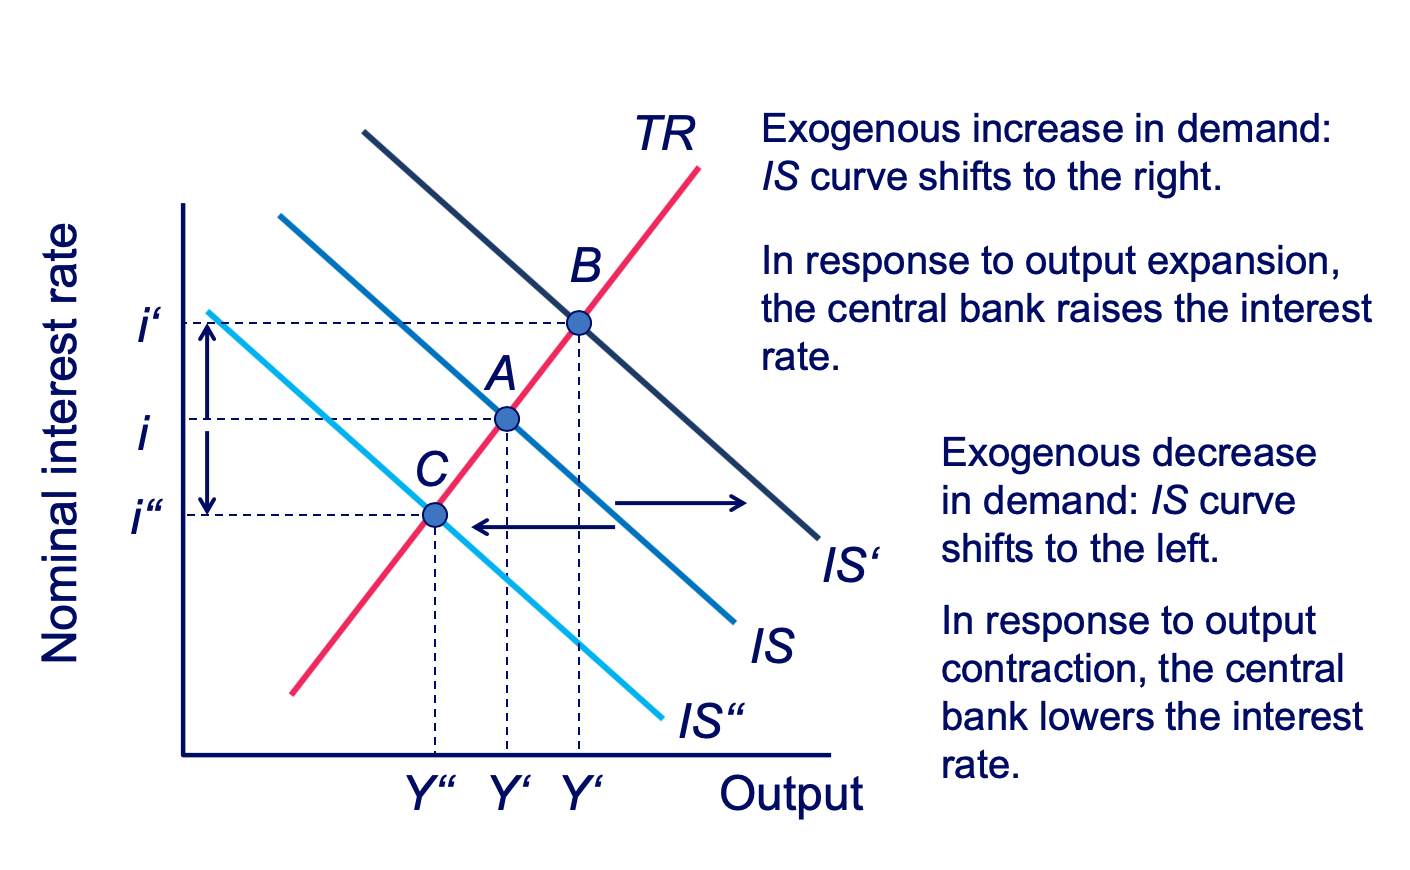
Macroeconomic Shocks: Real (IS) Shocks diagram and explanation
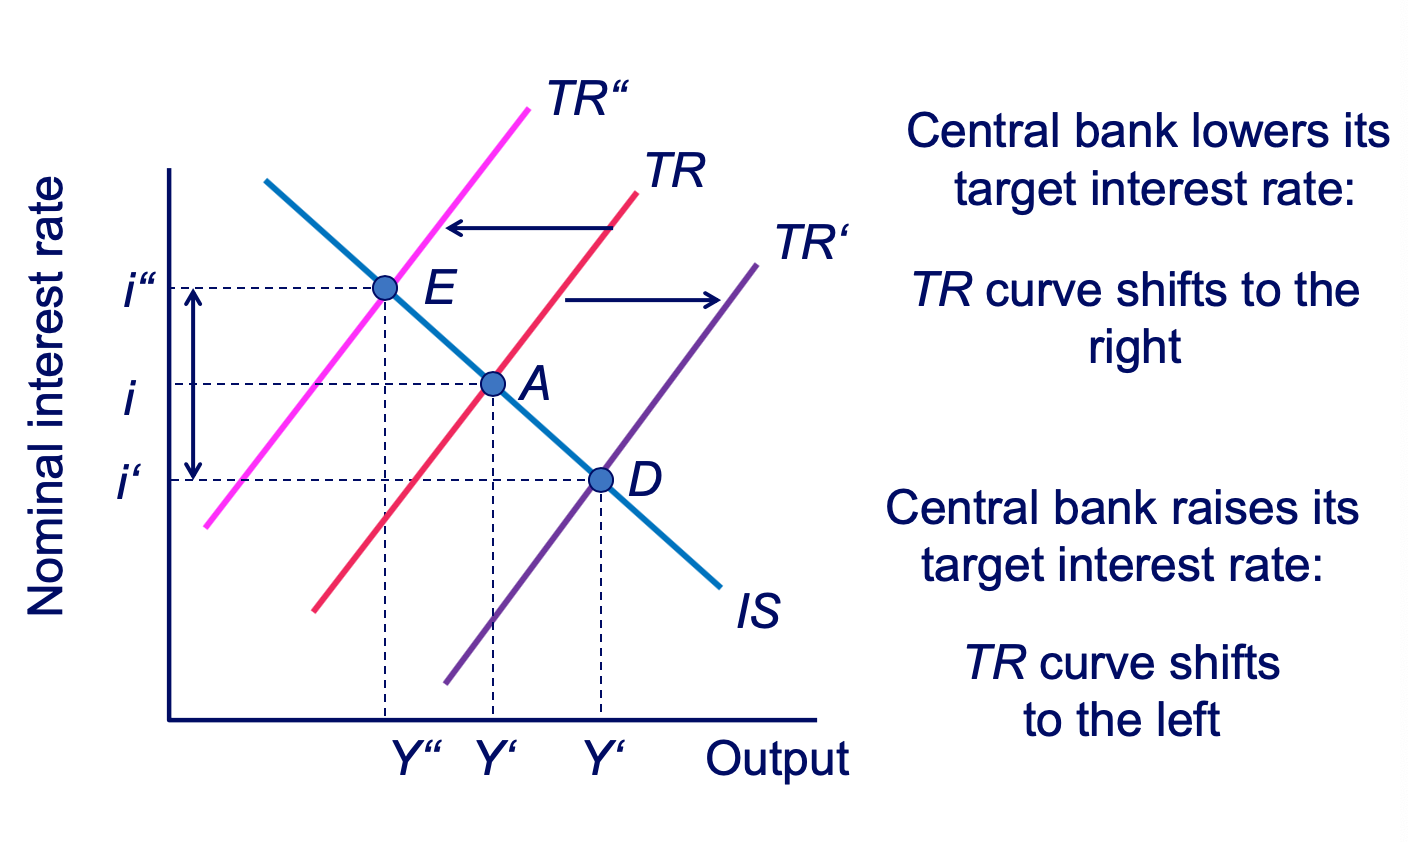
Macroeconomic Shocks: TR Shocks diagram and explanation
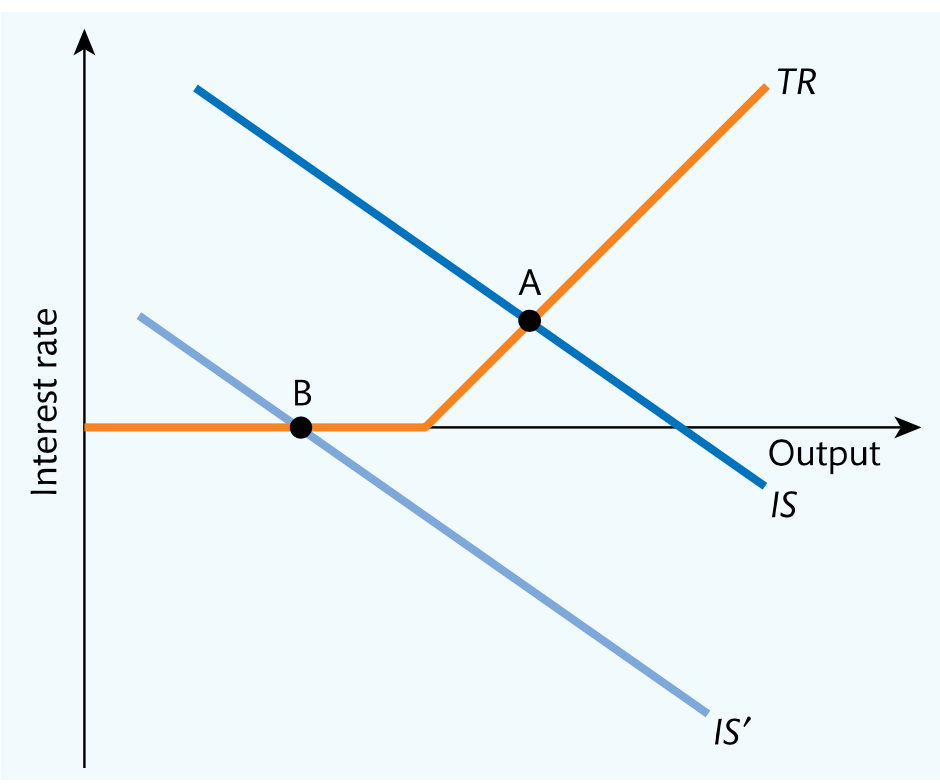
IS-TR macroeconomic equilibrium diagram

IS-TR diagram: The Zero Lower Bound and the Great Recession diagram