STATS 1123 - Descriptive Statistics
1/19
There's no tags or description
Looks like no tags are added yet.
Name | Mastery | Learn | Test | Matching | Spaced | Call with Kai |
|---|
No analytics yet
Send a link to your students to track their progress
20 Terms
vocab: subjects
refer to the things we are interested in
need to specify n
vocab: variable
direct characteristics of the subject (e.g. height)
vocab: measurements
the process we use to assign numbers, letters, or words to various of elements
vocab: observations
set of measurements obtained for a particular element
**NOTE: sample size = # of subjects = n
scales of measurement
numerical:
interval/ratio scale
categorical:
ordinal (order)
nominal (no order)
categorical graphs
bar graph → good for ordinal
pie chart
numerical graphs
histogram
stem-and-leaf plot / stemplots (need scale)
boxplot
scatterplot
side-by-side bar chart
historgram descriptions
centre
spread
shape (uni / bi -modal / symmetric / bell / skewed)
outlier
cumulative distributions
cumulative frequency (number)
cumulative relative frequency (decimal)
cumulative percent (percentage)
pg.14
numerical summaries
mean (average) → not resistant
median (middle) → resistant
mode (most frequent)
measure of spread
range
standard deviation
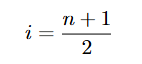
formula for finding the median number
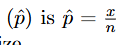
sample proportion
Xth quartile form
how to find the quartiles (Q1, Q2, Q3)
Q1 - median of the lower half
Q2 - median for the entire data
Q3 - median for the upper half
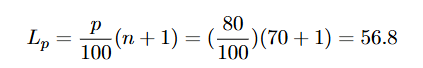
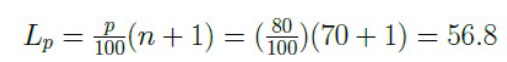
finding pth quartile formula
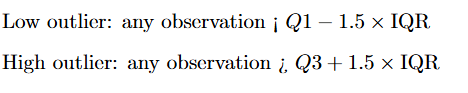
how to calculate for outliers for boxplot
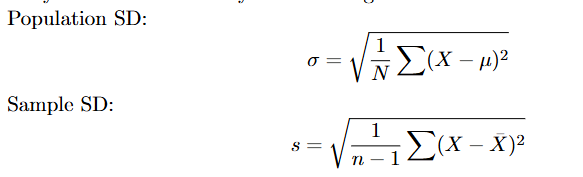
standard deviation formula
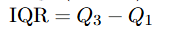
IQR formula