Resource Consumption - Concepts and Case Studies
1/47
There's no tags or description
Looks like no tags are added yet.
Name | Mastery | Learn | Test | Matching | Spaced |
|---|
No study sessions yet.
48 Terms
Global and regional progress towards poverty reduction, including growth of the “new global middle class” and consumption (patterns, implications)
Global Trends:
Development in Asia → especially China and India
Sub-Saharan Africa has increasing number of people in poverty, but also increasing number moving into the middle class
increased productivity of global trade leads to growth in emerging economies
Decrease in reliance on subsistence agriculture, rapid urbanisation, and modernisation
Relationship between Rise in Global Middle Class and Increased Consumption
People are left with disposable income after essentials, and can buy their wants
Significant increase in the number of people worldwide who achieve a certain level of income, education and consumption capacity
Trends fuelled by economic development and globalisation, particularly in developing countries
Non-manual class - still have 33% of their income left over after essentials→ left with disposable income
Growing middle class drives economic development and social changes
Eg. the more educated citizens, the more people will participate in political processes
Middle-class consumers prioritise quality, convenience and lifestyle choices, willing to pay for products that offer better features, durability and status symbol
Growing interest in experiences like travel, dining out, cultural events
POSITIVE: economic growth, job creation, poverty reduction
NEGATIVE: increased consumption of goods and energy has put pressure on the environment and natural resources production and disposal of consumer goods contribute to waste generation and pollution
How ecological footprint is measured + definition
A measure of how much biologically productive land and water an individual, population or activity requires in order to produce all the resources it consumes, and absorb all the waste to generate
if consumption exceeds biocapacity, we will be in an ecological overshoot
Biocapacity: earth’s ability to reproduce land and sea - forests, rivers etc…
Current consumption habits→ takes 1.6 planets to meet demand we put on nature
Demand on nature is 60% more than what Earth can renew
Biocapacity increased over last 50 years by 20%
Demand: considers the amount of productive land we need to provide our resources and space for our infrastructure
Limitations of ecological footprint
The reliability of data is hard to measure and obtain
In calculating GHGs, only CO2 was included
Consumption of freshwater is not included
Impact of trade is diminished
Impact of tourism is not included
Only considers land and water areas that are usable by humans, all others, wetlands, deserts, etc not included
individual ecological footprint
used to measure impact of one’s lifestyle on planet’s resources
allows individuals to measure the scale of their impact
an educational tool
local ecological footprint
At the city and regional scale
Helps governments track a city or region’s demand for natural capital, and compare this demand with the natural capital available.
Informs a broad set of policies, ranging from transportation to building codes to residential development.
Highlights the significance of long-term infrastructure decisions, amplifying future opportunities or risks.
Adds value to existing data sets on production, trade and environmental performance by providing a comprehensive framework to interpret them
Helps understand the link between local consumption and global environmental impact.
Raises sustainability awareness and engagement among citizens.
factors that increase/decrease national ecological footprint
Governments can benefit from the metric as it is an accurate measure of resource use and can guide their policies towards sustainable development
factors increasing ecological footprint at national level include
relying heavily on fossil fuels
large per capita production of carbon waste
increasing use of technologies
large per capita consumption of food
high lvl of imported resource
meat rich diets
ways to reduce ecological footprint
reduce amount of resources used
recycling and reuse
improve efficiency of resource use
transporting waste to other countries
reducing population to reduce resource use
Describe the availability of freshwater
2.5% of water is freshwater (made up of)- Permanent ice, Groundwater, Freshwater
70% of freshwater - Glaciers, Permafrost, Perennial snow
0.5% of freshwater subsurface water - 0.25% freshwater lakes, 0.04% atmosphere, 0.04% soil moisture, 0.05% swamps/marshes/wetlands, 0.006% rivers
30% of freshwater = ground water
only 0.007% of water is safe for consumption
Types of water (green, grey, blue)
grey water = waste water
green water (60%) = precipitation absorbed into soil and plants
blue water (40%) = water collected in lakes, rivers, wetlands, and groundwater
Explain virtual and embedded water
Embedded or virtual water is water embedded in a product; all products require water to create, and therefore is the water used to create the good consumed. (ex. 2,700 litres of virtual water is in a t-shirt)
Distinguish physical and economic water scarcity
Water scarcity occurs when the demand for water form all sectors is higher than the available resources
Physical Water Scarcity - when the demand for water is higher than the supply of water. Physical Water scarcity does not have to be in an arid environment, because there, the demand for water is normally low, so there wouldn’t be a shortage. Economic Water Scarcity - when there is water available but for some economic reason it is not possible to fully utilise the source of water. This might be because extraction or transportation costs are too high, or because water is polluted and is not possible to treat.
Explain causes of physical and economic water scarcity
physical
arid environment
drought/climate change
overpopulation
economic
water is polluted
lacking infrastructure to access water supplies (ex. pipes to extract ground water)
high water transport costs
Global patterns in water availability/scarcity
Little to no water Scarcity
USA, Canada, Most of South America, Europe and West Russia, Japan, South Korea
Physical water scarcity
North Africa + Middle East = Desert ⇒ physical water scarcity
Middle of China
South of India
central asia
Economic Water Scarcity
North of India
Sub-Saharan Africa (availability ground water, but lacking infrastructure )
Peru
Identify reasons for Water Scarcity
Population Growth
Pollution
Domestic Demand
Agricultural Demand
Industrial Demand
Sewage
Climate Change - water sources dried up
Political - water sources are shared
Mismanagement - not sustainably managed, causing shortages
Ground water depletion
Energy Production
Consequences of Water Scarcity
Water Shortages & pollution can lead to:
crop failure
drought
livestock death
famine
refugees
conflict
Saltwater intrusion into ground water
biodiversity lost
eutrophication - excess growth of algae due to fertilisers going into water sources, this can cause water to not oxygenate properly, or let enough light in, leading to deaths of animals and plants underwater
Global patterns in consumption of water (Global, HIC, LIC)
World
Global demand of water expected to increase by 70% by 2050
Domestic Use 8%
8% of water is for domestic use ⇒ laundry, showers, toilets
Urban areas require water for drinking, sanitation and drainage
Industrial Use 22%
22% of water consumption
Agricultural 70%
primary sector- extraction of natural resources (agriculture, mining)
HIC
Domestic use 11% ⇒ slightly higher as they have reliable infrastructure to provide clean water.
Industrial use 59% ⇒ move to secondary industries and manufacturing (ex. Tech requires a lot of water), industrialisation
Agricultural use 30% ⇒ import food from MICs/LICs, move away from primary/agricultural as the main industry.
LIC
Domestic uses 8% ⇒ have less reliable access to water systems causing domestic water use to be more limited
Industrial use 10% ⇒ less secondary industries
Agricultural use 82% ⇒ prevalence of subsistence farming and agriculture/primary sectors being the main source of income and industry in lower income countries
Global patterns in embedded water imports and exports (mostly Europe)
More virtual water is being imported rather than it being exported
Strong import flows
From all around the world, most notably Brazil, the USA, Argentina, India, China, Russia, etc.
Virtual water imports are very high at net 100-305 Gm^3/year
High demand for water-intensive products
Reliance on virtual water imports → needs imports as not as water rich.
Europe mainly exports virtual water to the USA ⇒ trade relations
Concentrated into one place for exports
Export of virtual water relatively low overall.
this allows Europe to protect their domestic water resources by importing water-intensive products
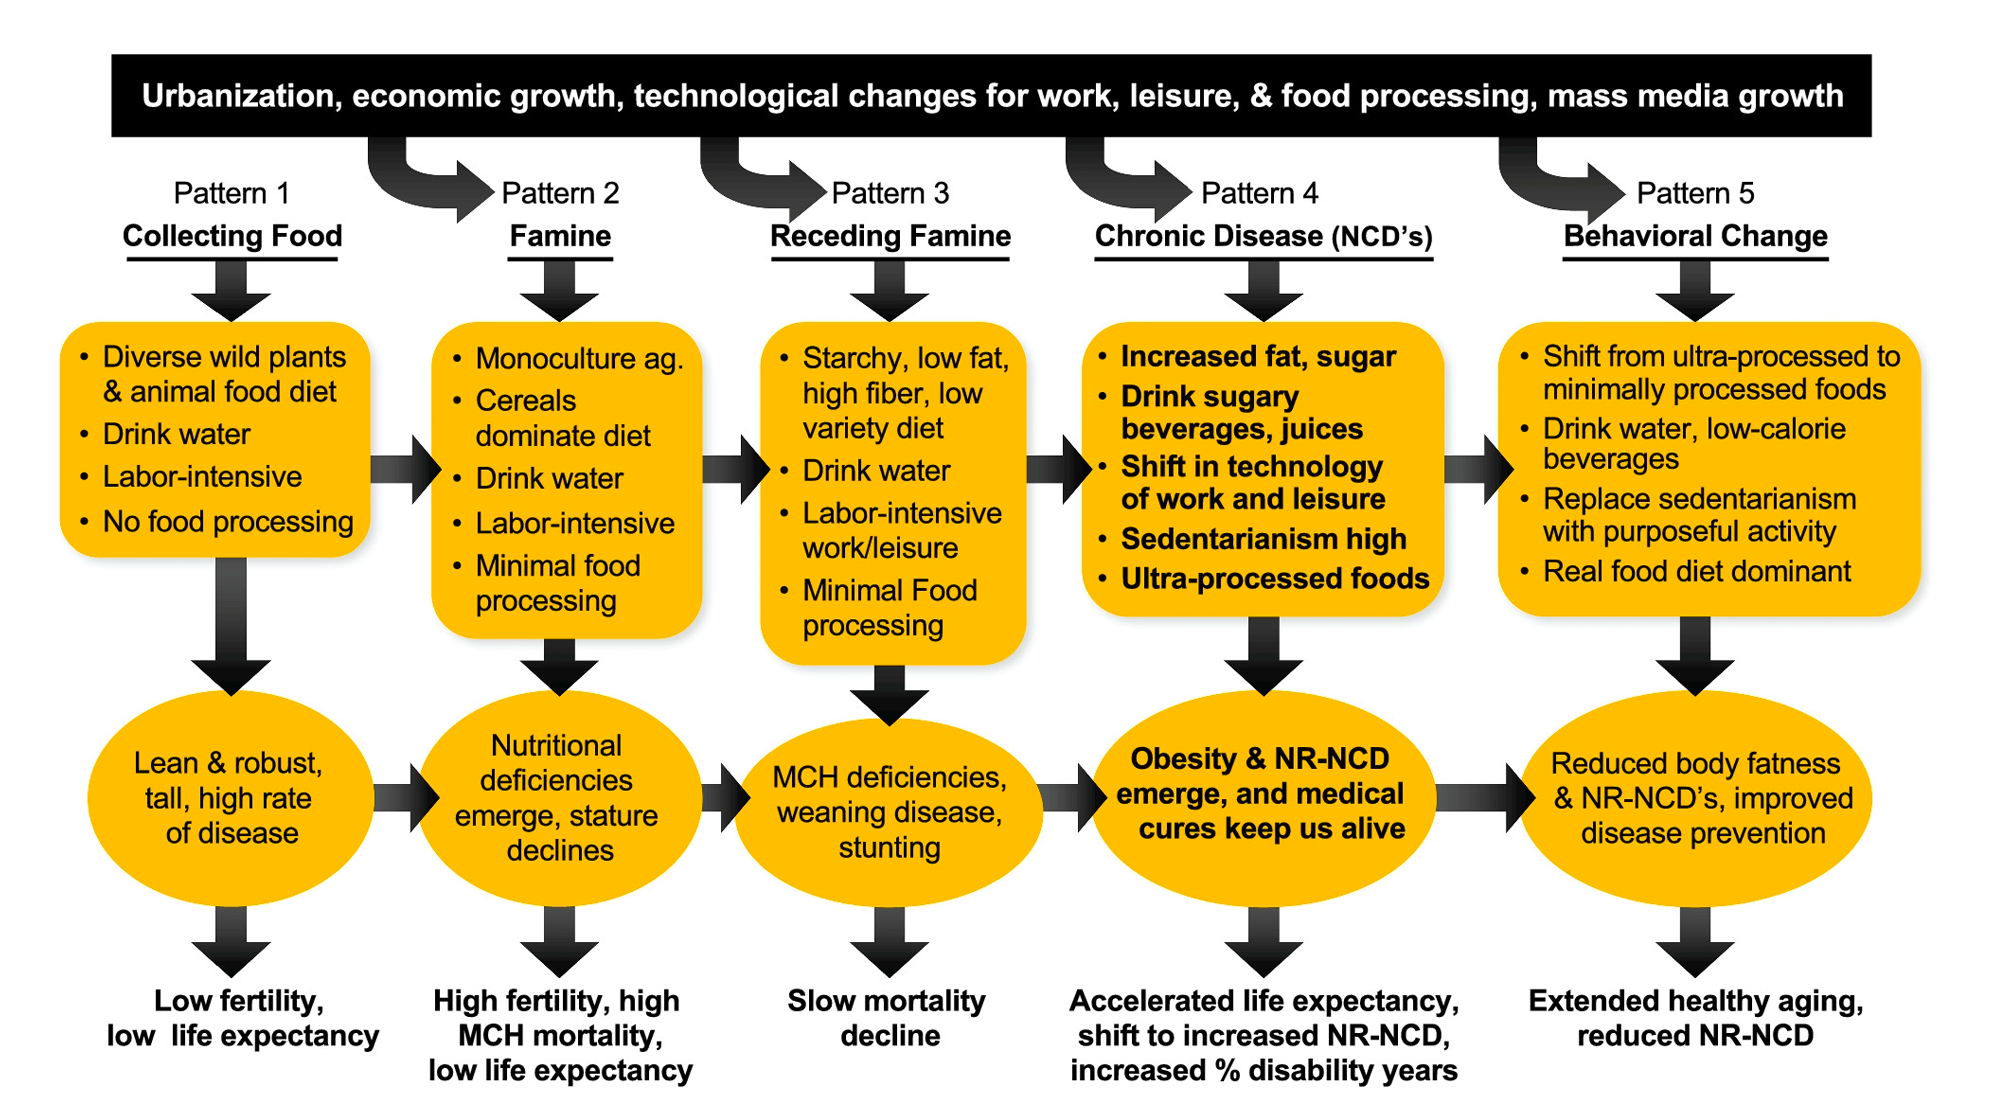
The Nutrition Transition based on increased development
Causes of increasing and decreasing food production
Increase in Food Production
Technological innovation
Increase of demand
Climate change
Increased export demand
Increased use of agrochemicals
Agribusiness
GMOs
Decrease in Food Production
Arid Land
Soil Erosion
Decrease in Demand
Brazil food case study: Food production ⇒ Land used for agriculture
Agricultural production mostly concentrated in southern half of Brazil, especially for crop growth
For pastures, land used is more scattered, some in the south half, but some also near the northern coasts
A large majority, around 50% of Brazil’s land is dedicated to agriculture
Brazil food case study: 4Ps ⇒ place, processes, possibilities, power
power
Proffiters in Power - Western big businesses such as Nestle, PepsiCo, General Mills
Expanding in developing countries as growth slows in wealthier countries
Rise in availability of of inexpensive processed food (sugary, high in calories + fat)
Transforming local agriculture
Favouring farmers growing commodities such as sugar cane, corn, soybeans…
Moving away from subsistence crops (variety, self sustain)
Abundance of marketing and perceived benefits leads to citizens believing that products from Nestle are “good” for you
President - Michel Temer
Ties to large corporations and support for fast food businesses
Stop limiting their advertisements and less encouragement of health eating/propaganda
These food and beverage conglomerates have political power in these countries
Millions of dollars in donations to Brazil congressional candidates (leverage → change policies in favour of fast food conglomerates)
Government banning KFC and Pepsi from sponsoring sports and cultural events
places
Brazil is a microcosm of how growing incomes and government policies have led to longer, better lives and largely eradicated hunger. But now the country faces a stark new nutrition challenge: over the last decade, the country’s obesity rate has nearly doubled to 20 percent, and the portion of people who are overweight has nearly tripled to 58 percent.
processes ⇒ how are diets changing
Rise of middle class/disposable incomes → Availability of affordable inexpensive processed food → people can afford to pay for food, but opt for cheaper/efficient options → becomes a staple in diet → rising rates of obesity
Economic changes ⇒ increasing middle class in Brazil, epidemiological, and demographic changes.
Afford more food → overeating
Less time to cook → Fast food
Fast food/buying from western food businesses = status
Nestle Door to Door programme
Serves 700,000 “low income consumers each month”
Serves those who don’t always have ready access to supermarkets Nestle products for main food source
Advertises only nutritional benefits while omitting potentially harmful or unhealthy aspects (omission bias)
Though nestle has reformulated many products (they are actually healthier), clients in this programme are more interested in the unhealthy ones like kitkat and pudding
“‘On one hand, Nestlé is a global leader in water and infant formula and a lot of dairy products,’ said Barry Popkin, professor of nutrition at the University of North Carolina. ‘On the other hand, they are going into the backwoods of Brazil and selling their candy.’”
This is part of a greater effort to integrate their company into the lives of those living in Brazil → growth and makes money for company
possibilities ⇒ consequences
malnutrition due to not lack of food, but lack of food with proper nutrients
Increase in diabetes, chronic illness, heart disease
300,000 diagnosed with type 2 diabetes every year
Rise in obesity → more people are obese than underweight.
1 in 7 obese individuals are children
Stunted growth in children due to high salt, sugar and fats diets
Prevalence of obesity has doubled in 73 countries since 1980
4 million Premature obesity related deaths since 1980
In brazil obesity has increased by 2.5 times, percentage of 7% to 18% since 1980 to 2015
9% children obese
Children with impaired cognitive abilities, physical abilities due to their diets or parents during pregnancy
Patterns in crude petroleum imports and exports
Exports
The Middle East is one of the Largest Exporters of Crude Oil in the world.
E.g amount of crude oil in barrels: Saudi Arabia (212 billion), Iran (143 billion), Oman (5.2 billion), UAE (107 billion), Qatar (25.2 billion), Iraq (145 billion)
All of these countries' primary sources of income is their oil.
Imports
USA, Japan, South Korea, India, Europe ⇒ most imports
mostly HIC countries except India
Over 80% of India's crude oil demand is met through imports (large population and not enough oil reserves)
Lower imports ⇒ South America, Africa
demand is lower, and less developed communities have less access to electricity and efficient transportation
Lower imports ⇒ Canada, China, Russia
These are countries that are oil producers and have enough reserves and produce enough to sustain themselves without requiring exports
Geopolitical influence from + importance of having energy security
energy ⇒ vital component of a developed and industrialised economy and therefore it is of huge geopolitical importance.
source regions of energy (ex. Middle East) are of huge geo-strategic importance to powerful countries (ex. USA, Russia)
priority to secure safe production and supply routes
how countries prioritise energy:
USA has huge capital investments into shale gas fracking, which now accounts for about 30% of its energy mix and 94% of it natural gas use, providing it with energy independence.
Oil and gas exports for Russia represented 68% of its export revenues in 2013.
This economic dependence has led to Russia's militarisation of the Arctic beyond that of all other Arctic nations combined.
Its influence over energy supplies to Europe is also a geopolitical tool over the region, which provides it with leverage over European policy. Therefore energy security can be seen as a critical factor in many countries' foreign policies
global trends in consumption of renewable and non-renewable energy
Energy Consumption Trends
Economies of HICs are based on high-energy generation primarily from fossil fuels.
LICs have traditionally lower energy demands due to less technology and reliance on natural resources (e.g., wood burning, biomass)
Future fossil fuel consumption in LICs is expected to increase due to rising populations, incomes, and technological development.
Renewable Energy Growth
over 20% of global energy production = renewable
5% solar energy
6% wind energy
16% hydropower
Global adoption of renewable sources has been sluggish for several reasons:
Non-renewable energy is generally cheaper than renewables; gas is abundant and can be burned directly without refining.
Existing infrastructure allows for gas extraction and use in gas-fired power stations.
Wind power and other renewables often require significant investment for new infrastructure (e.g., wind turbines).
Some renewable sources may still be unreliable compared to established fossil fuel technologies.
future trends in consumption of renewable and non-renewable energy
Future non-renewable energy costs are expected to rise as stocks deplete and easier-to-access resources are exhausted.
Increasing scarcity of resources means remaining non-renewable resources will be harder to access, leading to higher costs.
Implementation of environmental taxes to address global warming will further increase fossil fuel prices.
As non-renewable energy becomes more expensive, renewable sources will become more appealing.
Increased use of renewables is likely to have significant positive effects on the planet.
trends in consumption of nuclear power
Nuclear Power Consumption Trends
Global Nuclear Power Consumption: Approximately 10% of global electricity comes from nuclear power as of 2023.
United States: Largest producer of nuclear energy, contributing about 19% of total electricity generation.
China: Rapidly expanding nuclear capacity, aiming for 70 gigawatts by 2025, up from 56 GW in 2023.
France: Relies heavily on nuclear energy, with around 70% of its electricity generated from nuclear power.
Japan: post-2011 Fukushima Daiichi accident, Japan suspended operations at 48 nuclear power stations between 2011-13
global impact: after the accident, many countries began to reduce their nuclear power usage
germany: permanently shut down eight of its nuclear reactors
switzerland and spain: banned the construction of new nuclear reactors.
advantages and disadvantages of nuclear power
Nuclear power generation has the following advantages:
no GHG emissions
The technology is readily available.
efficient: 1 kg of uranium contains 20,000 times more energy than 1 kg of coal.
Nuclear power generation has the following disadvantages:
The radioactive waste from nuclear power stations is highly radioactive, stays like that for 1000s of years ⇒ cannot dispose
potential for nuclear accidents are disastrous ⇒ possible if reactor is destroyed, or failure in technological components occurs
The energy source for nuclear energy is uranium, which is a scarce and non-renewable resource.
The time frame needed to plan and build a new nuclear power plant is 6-8 years
The water–food–energy “nexus” and impacts on water security
better management of water supplies → solve issues in the world
food security, better health, liveable cities, climate change
strain on water supply → population growth, unsustainable econ growth, pollution, mismanagement
Water crisis is result of bad water governance
Water is a shared resource
Countries need to agree on how to manage water supply to share costs + benefits
Shared water resources can cause tension + conflicts
Water diplomacy ⇒ solutions to address needs of countries
Joint water management ⇒ improve relations between countries, enhance security/stability, and protect environment
impacts:
threats to water availability:
water used for the intensive agricultural processes of food
safe drinking water
water used in intensive energy production process
Agriculture accounts for 70% of total global freshwater withdrawal.
35% of water is in industrial sectors, including mining, transport, processing or energy
High exploitation of domestic shale gas is seen as a way to reduce energy security concerns by dependency on energy imports
Uses a lot of water
Water can get contaminated → eg Pollution from cattle threatens water safety
Large-scale water, and hydropower infrastructure projects can have positive Nexus impact by providing water storage for irrigation in urban uses
The water–food–energy “nexus” and impacts on food security
Nearly one billion people go to bed hungry every day
Millions of farmers (mostly women)
Struggle to feed family
Lack of access to quality seeds, markets, innovations, water
Solutions:
Irrigation systems, Improved fertiliser
Alliance between farmers → marketplace, sell products
Education programmes on vitamins → more nutritious foods for their family
impacts:
threats to food security:
resource consumption of food can lead to conflicts with agricultural needs
large volume of water to produce food
water for energy production in extraction of food and agriculture
Many agricultural centres are threatened by water scarcity
Most Megacities suffer from water stress
High land use for biofuels takes up land that can be used for agriculture
Marine pollution from oil spills can harm fish stocks
Fossil fuel extraction impacts food prices in supply
The water–food–energy “nexus” and impacts on energy security
Energy security of specific systems: electricity, energy, oil used in transport
Vulnerability:
Sovereignty: who controls energy (oil all imported or produced domestically)
Robustness: how long will it last, will we run out, will the infrastructure hold up
Resilience: how fast can the system respond and recover from disruptions
impacts:
Food, production and supply chain currently consume, about 30% of total energy consumed globally
Energy is required to produce transport and distribute food as well as to extract, pump, lift, collect, transport and treat water
Surface mining of coal leads to the position of large amounts of rock and soil waste running into productive land, or impacting water quality from run-off
Run-off of acid mine drainage
Clean water supply requires energy
Food-processing requires energy
Summarise the water-food-energy nexus approach (energy+food, food+water, water+energy)
the complex interrelationships that exist between energy, food and water
important for understanding how to develop sustainably + reasons to implement renewables/stop using fossil fuels
Nexus has emerged as a policy concept as a response to global crises concerning energy, water, & food demand
Nexus of food, water, and energy is all interlinked
Energy + Food
food production is energy intensive
irrigation, harvesting, processing, transporting
resource intensive foods such as meat, dairy
requires more energy
some food crops may be turned to fuel for vehicles
Food + Water
production of food is water intensive
water is used in irrigation, livestock, crop growth
agriculture is responsible for 70% of freshwater consumption
Water + Energy
water is required for energy production → eg in thermal power plants for cooling, fracking shale gas
hydropower also requires water to produce energy
energy is also required for water management
eg pumping, water treatment
creates dependency on these two factors
impact of climate change on food/water/energy security
impact on food and water
Climate change can lead to adverse and extreme weather, making agricultural land more prone to drought, floods, wildfires, natural disasters etc. ⇒ impact/destruction of crops, contaminate water/no more water
glaciers melting ⇒ less available freshwater
inconsistent weather ⇒ lowered quality of produce
UAE Nexus Case Study
Context
one of the richest countries in the world
population: 9.441 million
GDP PPP per capita 75,600 USD
rich in oil ⇒ economy based on oil, has 107 billion barrels of oil
water security
annual precipitation: 140 – 200 mm
High usage of water and using tech to maximise amount of drinking water
Releasing small amounts of potassium, chloride and sodium chloride from planes to stimulate rainfall
water insecure, desert country
Little water but one of the world’s biggest consumers
Desalination plants: powered by fossil fuels
Suck up a huge supply of seawater and energy
Food security
23/113 countries in the global food security index
Food consumption growing due to pop growth and an increase in tourists
Not self-sufficient
80% of the UAE's agricultural products are imported
Lack of natural resources
Energy security
Largest oil producers (member of OPEC) — has 107 billion barrels of oil in reserves
Prosperity lies heavily in the oil sector
Strait of Hormuz:
world’s most important oil chokepoint
17 million barrels of oil per day (2011)
almost 100% of energy from gas power plants
Highly energy, secure
Trying to move towards renewable energy
has capacity to move towards solar power (hot environment)
4.5% of energy currently from solar power
Switzerland Nexus Case Study
Context
alpine state
population of 8.341 million
direct democracy
HDI 0.962 (rank 1)
highest nominal wealth per adult, and highest per capita gdp
$88,000 (PPP, 2023)
Water security
High usage of water
Use tech to maximise amount of safe drinking water
Waste treatment plants
NoMix toilets, that separate urine, and faecal matter from water
purifies water and is used for crops
Highly water secure as there is a lot of rain in large water reserves
Has 340 km^3 reserves of water (lakes, glaciers, natural groundwater)
80% of drinking water is from natural springs, groundwater and lakes
Food security
Not self-sufficient
Lacks natural resources + land area
Only small area for cultivation
Trying to promote and prioritise locally grown food
Produces only 50% off all food ⇒ a lot of imports
High resilience in food security
Ranked 11/113 in the global food security index
Energy security
Consumes, large amounts of energy
domestic energy prduction
Hydroelectricity power (62%)
Nuclear power (29%) in electricity production
imports hydrocarbons, mainly oil and natural gas
Wants to move towards renewable energy by 2050
energy consumption
36% of energy from oil, 13% of energy from natural gas
around 30% of energy produced domestically
around 70% of energy sources imported
Incineration — disposal method
converts waste into ash and gas particulate
The heat, in turn, can be used to generate electricity
Can reduce the volume of the original waste by as much as 80-90%
significantly reduce the volume of waste for which landfill disposal is necessary.
Incineration has particularly strong benefits for the treatment of certain types of waste
notable clinical and hazardous waste → safe disposal of these products
E-waste — disposal method
Contains toxins and released when burned or taken apart has negative impacts on health and environment
Destinations of e-waste
Mexico, Brazil, Nigeria, Pakistan, India, Thailand, Singapore, Philipines
Illegal flows
Developing nations are primary receivers of exported e-waste
Basel convention
Initial goal to develop framework to control, cross border movement of hazardous waste and to identify and define an environmentally sound management system for hazardous waste
Threats of e-waste
Over 18 million children and teens involved in informal industrial structures
High lead in Mercury levels impacts mental intelligence
Bad for health
Agbogbloshie, Ghana
Ewaste sent to Agbogloshie, Ghana
E-waste imported as secondhand E products
Purchase by e-waste plants
Workers, burn the waste to extract gold and other valuable metals to sell
All handpick with no safety
Many people from northern Africa come here for better opportunities for their families
LIC’s import waste because they receive money for it
valuable metals
Some countries with strict environmental laws export waste because they cannot dispose of it domestically
Eg: EU exports waste to countries with less stringent environmental policies, where disposal costs are lower
recycling is cheaper in these locations
Recycling — disposal method
Case study: China
Waste is sent to China
Eg: UK sends 66% of its waste to China
countries have insufficient recycling facilities
mostly plastic waste. there are 24 types of solid waste
China introduced a ban on solid waste from foreign countries
established in 2018
reasons for introducing a ban: environmental concerns, plastics contain non-recyclable components, enforce stricter import standards on low quality recyclables
this has impacted international flows of waste by:
forced other countries to adapt their recycling systems, instead of relying on China
Denmark - SDG 7: Affordable and Clean Energy (7.1 + 7.2)
7.1: universal access to modern energy
100% access to energy in Denmark
66% of Danish homes have access to district heating systems (uses biomass/municipal waste)
subsidies on electricity for low income homes
7.2: increase global percentage of renewable energy
over 83% of Denmark's electricity comes from low-carbon/renewable sources:
with 60% generated from wind energy, nearly 13% from biofuels, and just over 10% from solar power
accountability: set legally binding targets to reduce GHG emissions by 70% by 2030
high taxation on use of fossil fuels (reduces incentive) — has the most expensive petrol prices in Europe
Limited Progress in Saudi Arabia + South Sudan - SDG 7 (7.1 + 7.2)
South Sudan - 7.1: universal access to modern energy
8% access to modern electricity
no operational oil refineries and it depends on imported diesel for electricity generation
LIC = limited capability to import energy sources for population
Saudi Arabia - 7.2: increase global percentage of renewable energy
exported USD 236 billion in crude petroleum in 2022
2nd largest exporter of oil in the world
extracts 13.39 million barrels per day
South Korea - SDG 12: Responsible Consumption and Production (12.3 + 12.4)
12.3: halve per capita food waste
mandatory food waste recycling
reduced food waste by 10% between 2013-9
avg. food waste per capita per year: 33kg (versus 79kg global avg.)
food waste recycling rate grew to 95%
12.4: responsible management of chemicals and waste
recycles 86% of all municipal waste
volume-based waste fee: taxes households based on volume of waste produced; ₩16.5 per litre of waste.
1994-2013: buried waste rate fell from 81.2% to 9.6%
gov provides phone apps that educates public on waste separation practises
Limited Progress in India + USA - SDG 12 (12.3 + 12.4)
USA - 12.3: halve per capita food waste
U.S. generates approximately 60 million tonnes of food waste per year
22% of all municipal solid waste in landfill is food waste
on average 100-150 kg of food waste per capita per year
Limited food recycling platforms
India - 12.4: responsible management of chemicals and waste
insufficient public bins and open top rubbish trucks + lacking awareness of issue
31 of 43 million tonnes of waste collected untreated of toxic chemicals
chemicals from industrial discharge: 38.3 billion liters of wastewater produced daily, 60% untreated
Neo-Malthus — criticisms, characteristics, Paul Ehrlich’s theory
expands on malthusian ideas
emphasises population control programs → ensuring sustainability for present + future
proactive and resolved measures: supports contraception use, concerned with widespread famine + env degradation
Limits to growth model
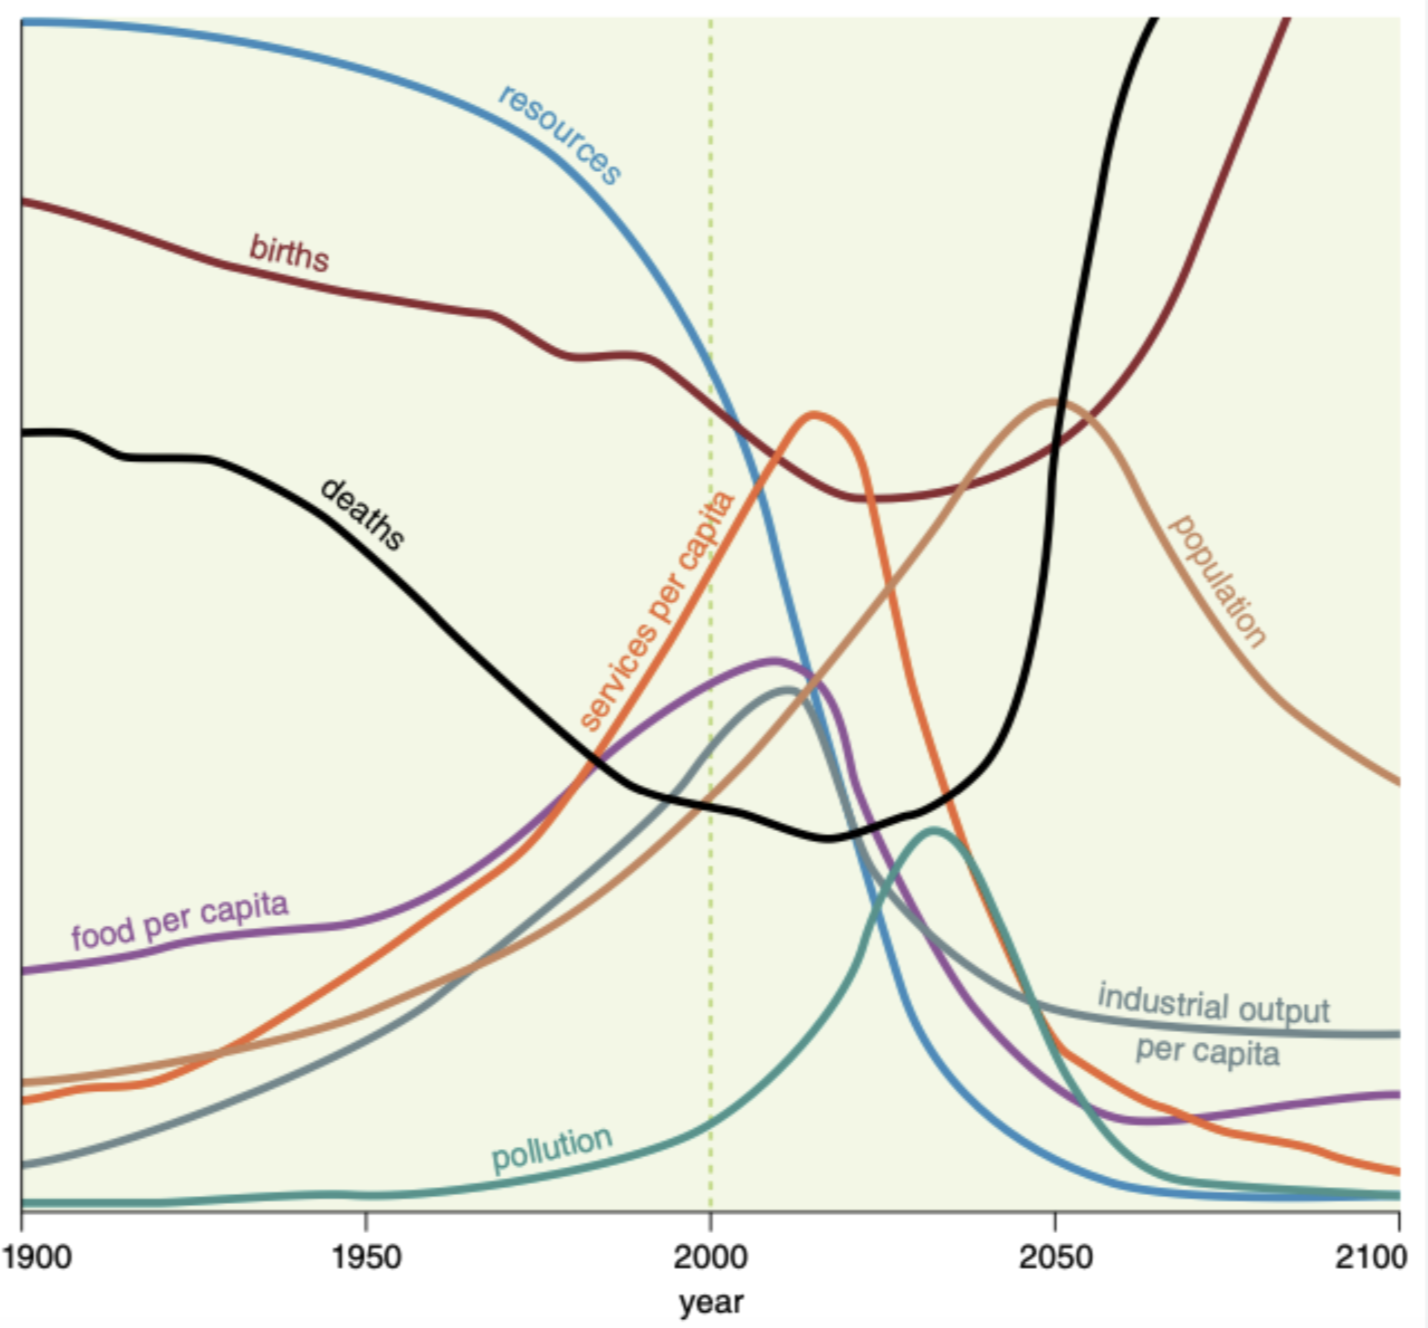
Five basic factors
Population, agricultural production, natural resources, industrial production, and pollution
Created by the Club of Rome: nonprofit, informal organization of intellectuals and business leaders whose goal is a critical discussion of pressing global issues
Growth till the limit is reached the limit and results in a decline
Need for preventative checks
One child policy in china
predicted that limits to growth will be reached in 2070
ability of resources, food, env, etc to meet human needs will be reached
beyond this if population not controlled naturally, it will decline due to increased deaths
Paul Ehrlich’s theory
overpopulation — a disaster for humanity
1970’s would see 10 million deaths/year due to starvation
US can only support 150 million ppl
nothing can be done to stop in 1960’s
suggested that
luxury tax be placed on children’s items
prizes for men w/ vasectomies & ppl w/ no kids
Criticisms:
inaccuracies
eg US currently has 334.9mil ppl
overly alarming
incite too much fear
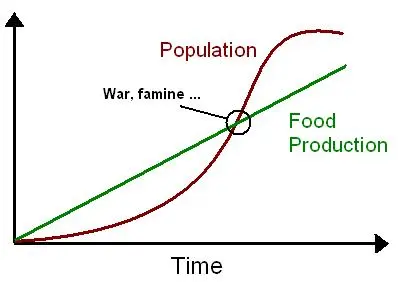
Malthusian — checks, criticisms, characteristics, evidence of theory
Created by Reverend Thomas Malthus (1766 - 1834) in ‘An Essay on the Principle of Population’ (1798)
“The available farmland was insufficient to feed the increasing population”
Human Population grows geometrically/exponentially
hypothesised to double every 25 years by Malthus
Food production grows arithmetically/linearly
population crash as numbers exceed the ability of the environment to provide.
2 types of checks
preventative or negative checks : within people’s control
delayed marriage, sexual abstinence, reduced marriage
positive checks: outside of people’s control
disease, death, starvation, war, famine
These checks occur when human population exceeds food supply.
They would return the population to a lower, more sustainable level —argued to be evident in LICs, but not HICs
Criticisms
Underestimates the role of technology and innovation and Growth rates are not as rapid ⇒ likely the reason why pessimistic predictions do not usually occur in HICs
Limited to food as the only resource, countries with wealth are not limited to the resources produced (carrying capacity) of their own land/ immediate surroundings
Living standards are set by subsistence farming which is outdated and no longer as prevalent, especially in HICs
Assumes that increased living standard is correlated with increased birth rates, which is obviously not true
EVIDENCE: Irish Potato Famine
A blight in potato crops caused widespread famine in Ireland.
Great Britain did not come to Ireland’s aid during this famine, because:
they believed it was caused by the rapid population growth, not a potato crop disease
Thought the Great Famine that Malthus had theorised was occurring
Thought that they should allow the famine to reduce the Irish population, as it was necessary to restore the balance or population to a sustainable level
Boserup — criticisms, characteristics, evidence of the theory
Ester Boserup was a economist who focused on agricultural development in low and middle income countries
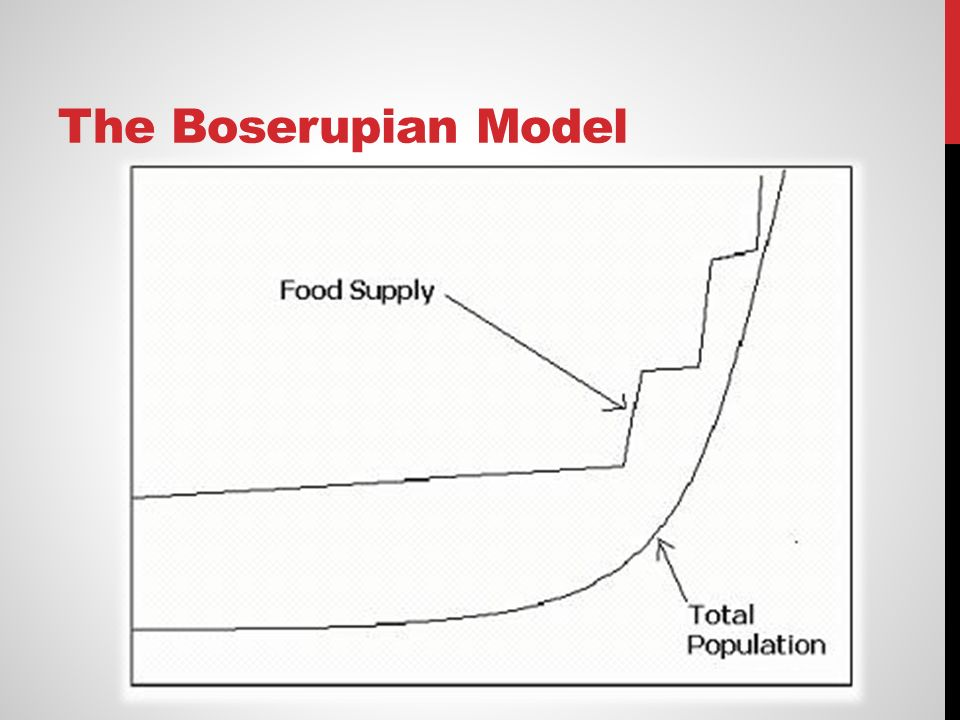
Believe that people have the resources of knowledge and technology to increase food supply
Population growth will stimulate developments in technology to increase food production
Theory assumes we knew of techniques required by more intensive systems and use them when population grew
Demographic pressure promote innovation in higher productivity in the use of land and labour
More efficient resources will be discovered/used
Renewable resources will replace non-renewable
EVIDENCE
Green Revolution
between 1950-1984 grain production increased by 250% → in pace with population growth
famine is due to poor distribution of food, NOT inadequate production
the world has enough food to feed the global population
The world produces 150% more food on only 13% more land compared with 1960 → enough food to feed 10 billion ppl
Criticisms
Highly simplified and generalised
Based on a closed society, with no migration
This pattern is not sustainable
not applicable to those economies where the urban industrial sector is less developed, The U.S. A. or Canadian economies even, if it is sparsely populated as compared to many other economies is, thus, no longer a test case for this theory.
characterstics resource stewardship and sustainable development
Resource Stewardship
Encourages a sustainable and responsible approach to managing resources that look towards the needs of future generations, rather than seeking short-term outcomes
Stewardship is an ethical stance that promotes responsible, planning and management of resources ⇒ the appropriate allocation of resources.
Can be applied to natural resources, human resources, money and information
The idea is that these resources will be available for subsequent generations. Sustainability is similar to its ability to continue a particular behaviour indefinitely
Pillar of Sustainable Development
Sustainable development is development that meets the needs of the present, without compromising the ability of future generations to meet their own needs. It contains within it two key concepts:
the concept of needs, in particular the essential needs of the world's poor, to which overriding priority should be given
the idea of limitations imposed by the state of technology and social organisations, on the environment's ability to meet present and future needs.
society: this will benefit the community in some way, by forming a safe social system that ensures that everyone has equal opportunities
safety
health
community + equal rights
education
environment: this will not have a negative impact on the environment and rather benefit it by bringing in biodiversity.
clean air and water
climate protection
healthy soil ⇒ use less inorganic chemicals
nutritious food
economy: this will benefit the economy in some way or be economically realistic to run
good jobs
fair wages
fair prices
opportunity
Case Study: Issues with Conservation - Turkey ⇒ SUCCESS
Too many fishers and NOT ENOUGH suppy ⇒ fishing practises were unsustainable and unfair
Fishermen created a system, where limited areas where people could fish in order to allow for fish migration
created a list of licensed fishers, allowed to only fish in certain areas ⇒ don’t disrupt fish migration.
fishers rotated fishing spots east each day
had a rotation system to ensure that this rotations and boats were monitored every day
organised ⇒ the system was simple, ex. each boat had its spot, if someone is in you spot, its obvious
monitoring was easy due to rotation system and organised guidelines
fishermans carried out punishments themselves to ensure fair fishing practises, ex. cutting nets, or removing fisherman license
system was beneficial, as everyone got to fish in all spots due to rotation, and ensured fair fishing practises to avoid exhausting the fish supply
Case Study: Issues with Conservation - Nepal ⇒ FAILURE
overall: conservation failed
population rise = forest degradation
attempt to alleviate the issue ⇒ government took control forest land in 1957
aimed to count trees, decide on carrying capacity, give ppl permit to take from forest based on this
Did not communicate well with people ⇒ locals considered the forest as personal property ⇒ used to conserve on their own private land or with the village
Everything taken requires a license ⇒ increases competition, ppl don’t work together
When the resources are public to people out act of their own interest
This resulted in the tragedy of commons as getting a permit was inefficient, most took illegally
monitoring the resources was impossible ⇒ covers too much area
government had right to take land if it was not used for longer than 2 years
often land was left to regenerate to avoid degradation
but ppl don’t want land taken away ⇒ degrade land to preserve ownership
circular economy: goal is to minimise output (waste)
make, use, recycle
biological materials - items we consume/eat
when the items we use is made/designed
waste can go back to the user
maintenance
reuse/re-distrubuted
refurbish/remanufacture
recycle
waste can cascade back to the consumer, or it can:
composting/anearobic digestion (create feed for animals)
back to the biosphere (replenish soil)
biogas (burn food for energy)
farming/collectiontechnical materials - items we use
key principles
there is no such thing as waste
biological cycle components are composted/go back into the biosphere, while technical cycle components are durable
energy to drive circular economies should be infinitely renewable
the idea behind the circular economy is to mimic the natural ecosystem cycle. Nature’s ecosystem is the community of flora and fauna interacting together in the environment. It is the only system that doesn’t create waste that isn’t used as a resource elsewhere.
A circular economy can be seen as an economic ecosystem with the interaction of the biological and technical cycles. It is human’s way of copying nature’s system.
energy that drives the circular economy should be renewable to increase resilience of the systems and reduces the dependance on finite resources. circular economy:
make → use → recycle → make → use → recycle
products and system is designed to be upgrade, maintain, refurbish, redistrubute… all the items we consume, to reduce output/output becomes input
change of ownership from user to service provider ⇒ leasing resources, rather than owning a resource, so that the resource can go back to the service provider to be reused or refurbished instead of the resource becoming waste.
Apeel Case study of circular economy
Reusing food waste, the company Apeel has created a layer of edible, plant-based coating applied to fresh products that mimics and enhances the natural defences of fruit and vegetables (biomimicry).
It acts an extra layer of coating on the food, slows down the two main things that cause spoilage – water loss and oxidation. Apeel Sciences uses the building blocks that exist in the peels, seeds, and pulp of all fruits and vegetables – lipids and glycerolipids.
These natural substances retain moisture in the food and keep oxygen out, preventing spoilage. Maintaining moisture and reducing oxidation slows the rate that fruits and vegetables spoil, and supports the plant’s natural abilities to protect itself.
Apeel is biodegradable and can be thus disposed of in the biosphere, acting as natural plant nutrients.