Economics Exam - IB
0.0(0)
Card Sorting
1/111
Earn XP
Description and Tags
Last updated 2:31 AM on 5/7/23
Name | Mastery | Learn | Test | Matching | Spaced | Call with Kai |
|---|
No analytics yet
Send a link to your students to track their progress
112 Terms
1
New cards
fiscal policy on shifting AD
Government spending increases, G ↑ and vise versa
Transfer payments ↑, disposable household income ↑, C ↑
Income tax ↑, disposable income for households ↓, C ↓
Subsidies ↑, disposable income for firms ↑, I ↑
Corporate tax ↓, disposable income for firms ↑ , I ↑
Transfer payments ↑, disposable household income ↑, C ↑
Income tax ↑, disposable income for households ↓, C ↓
Subsidies ↑, disposable income for firms ↑, I ↑
Corporate tax ↓, disposable income for firms ↑ , I ↑
2
New cards
expansionary fiscal policy
Ad shifts right
boosts inflation
reduces unemployment
boosts inflation
reduces unemployment
3
New cards
contractionary fiscla policy
ad shifts left
weakens inflation
weakens inflation
4
New cards
goals of fiscal policy
low and stable inflation
reduce business cycle fluctuations
promote stable economic enviroment
equitable distribution of income → gini coefficent decreases
extneral balance
reduce business cycle fluctuations
promote stable economic enviroment
equitable distribution of income → gini coefficent decreases
extneral balance
5
New cards
strengths of fiscal policy
can target specfic sectors of economy
effectivness in deep recession
effectivness in deep recession
6
New cards
constratints of fiscal policy
political pressure
time lags
debt
time lags
debt
7
New cards
supply side policies
Shifting LRAS right to increase potential output of the economy and long term growth
8
New cards
inverentionist supply side policies
Governments intervene with direct policies to increase potential output
Increase LRAS, SRAS, AD
education/human capital
health care
new tech
infastruture
buisness support
Increase LRAS, SRAS, AD
education/human capital
health care
new tech
infastruture
buisness support
9
New cards
inverentionist supply side policies constraints
short term inflation - shifts SRAS, AD, LRAS
time lags
costly
time lags
costly
10
New cards
market based supply side policies
Getting out of the way of competitive markets, letting competition occur
privitisation - shifts LRAS, SRAS
deregulation - shifts LRAS, SRAS
trade liberlistaion - shifts LRAS, SRAS, AD
restricting monopoly power - shifts LRAS, SRAS to increase competion and promote productivity
minimum wage reform - shifts LRAS, SRAS to decrease business costs, increase investement, reduce natural unemployment
reduce unemployment benefits - shifts LRAS, SRAS to incentivse pepole to find work
reducing labour unoin power - shifts LRAS, SRAS to increase competitvenss
lowering income tax - shifts LRAS, SRAS to incetivise productivity
lowerin business tax - shifts LRAS, SRAS to incetives investment
11
New cards
market based supply side policies constraints
equity issues, impacts of deregulation, vested intrest, unemployment, time lags,
12
New cards
privitisation
selling of government enterprises to the private sector
13
New cards
demand side policies
involved with minimising harmful fluctuations
14
New cards
deregulation
removal of government rules and requirements to increase efficiency
15
New cards
trade liberlisation
makes international trade more free by elimination or reducing trade protection
16
New cards
labour union
association of workers w/ goal to improve working conditions and defend worker rightss
17
New cards
substitue goods
goods that replace each other e.g coke and pepsi
18
New cards
Complement goods
goods that are used/bought together e.g. pen and paper
19
New cards
normal goods
goods for which demand increases in response to increases in consumer income
20
New cards
Inferior goods
goods for which demand falls in response to increases in consumer income
21
New cards
luxury goods
luxurious items e.g. sports cars, luxury watches
22
New cards
independent goods
goods that aren't complementary
23
New cards
shortage
when quantity demanded exceeds quantity supplied; below equilibrium point
24
New cards
surplus
when quantity demanded is less than quantity supplied; above the equilibrium point
25
New cards
demand and its shifters
the quantity of a good that consumers are willing and able to buy at different price
shifters: tastes and prefrence, related goods, income, future price expectation, no of consumers
shifters: tastes and prefrence, related goods, income, future price expectation, no of consumers
26
New cards
supply and its shifter
The quantity of something that producers have willing and able to sell at differnet prices
shifters: FoPs, relates goods, taxes/subsidies, future price expectations, no of firms, tech, shocks
shifters: FoPs, relates goods, taxes/subsidies, future price expectations, no of firms, tech, shocks
27
New cards
price elasticity of demand (PED)
measure of the responsivness of the quantity demanded for a good to changes in its price
inelastic (not repsonsive to price) when less than one, elastic (responsive to price) when more than 1
inelastic (not repsonsive to price) when less than one, elastic (responsive to price) when more than 1
28
New cards
PED formula
PED = % ∆ QD/ % ∆ Price
Answer is writtern (-) x
Answer is writtern (-) x
29
New cards
Perecentage change formula
change in price/ original price
30
New cards
factors of PED
Substitues
Portion of income
Luxury or neccesity
Addictivness
Time period to make the decision
Portion of income
Luxury or neccesity
Addictivness
Time period to make the decision
31
New cards
income elasticity of demand (YED)
A measure of the responsiveness of quantity demand to changes in income
32
New cards
YED forumla
YED = % ∆ QD/ % ∆ Y
33
New cards
YED for normal goods
inelastic, YED < 1
34
New cards
YED for luxury goods
Quantiy demanded changes drastically depending on a increase/decrease in income as they are not neccesities
Elastic, YED > 1
Elastic, YED > 1
35
New cards
YED for inferior goods
YED < 0
36
New cards
price elasticity of supply (PES) and factors
A measure of the responsiveness of quantity supplied to changes in price
factors: time period, ability to store shock, mobility of FoPs
factors: time period, ability to store shock, mobility of FoPs
37
New cards
PES formula
PES = % ∆ QS/ % ∆ Price
38
New cards
Elastic supply and its causes
PES > 1
Company can produce more easily as they have ability to change due to having extra space, captial, workers etc,
Company can produce more easily as they have ability to change due to having extra space, captial, workers etc,
39
New cards
Inelastic supply and its causes
PES < 1
Company can't produce more easily as they don't have ability to change due lack of extra space, captial, workers etc,
Company can't produce more easily as they don't have ability to change due lack of extra space, captial, workers etc,
40
New cards
a steeper demand or supply curve means
a more inelastic demand/supply
41
New cards
a flatter demand or supply curve means
a more elastic demand/supply
42
New cards
For businesses, what does a inelastic PED mean?
raising the price will increase total revenue
decreasing the price will decrease total revenue
decreasing the price will decrease total revenue
43
New cards
For businesses, what does a elastic PED mean?
raising the price will decrease total revenue
decreasing prices will increase total revenue
decreasing prices will increase total revenue
44
New cards
unit elastic demand
demand in which any change in the price of a good leads to an equally proportional change in quantity demanded
45
New cards
what does a PES of 0 mean
There is no change in quantity supplied as it is perfectly inelastic. No more is able to be supplied.
46
New cards
price mechanisim
1. sigals price is too high/low
2, incetivies to change price
3. rations exceed demands
4. allocates scarce resources
2, incetivies to change price
3. rations exceed demands
4. allocates scarce resources
47
New cards
soicety vs. consumer vs producer surplus
consumer = difference between what consumers are willing and able to pay and what they actually pay
produer = difference between what producers are willing and abl to supply and what they actually supply
soicety =consumer + producer
produer = difference between what producers are willing and abl to supply and what they actually supply
soicety =consumer + producer
48
New cards
4 key economic assumptions
scarcity - society's wants are unlimited but resources are limited
trade-off - due to scracity choices must be made and each has a trade off
everyone makes chouce to maximize their own benefit
real life situation can be explained through graphs and models
trade-off - due to scracity choices must be made and each has a trade off
everyone makes chouce to maximize their own benefit
real life situation can be explained through graphs and models
49
New cards
invisible hand
concept that through competition and self-interest the market is regulate as those who can afford buy and those who cant dont so there is perfect equilibrium
50
New cards
types of economies
centrally planned - gov owns all resources, answers are 3 econ questions
free market - low gov involvment, indvidual resource ownership, profit incentive, self-regulating market
mixed economy
free market - low gov involvment, indvidual resource ownership, profit incentive, self-regulating market
mixed economy
51
New cards
GDP
dollar value of all final goods and services produced within a country's borders in one year
C+I+aG+(X-M) = GDP
C+I+aG+(X-M) = GDP
52
New cards
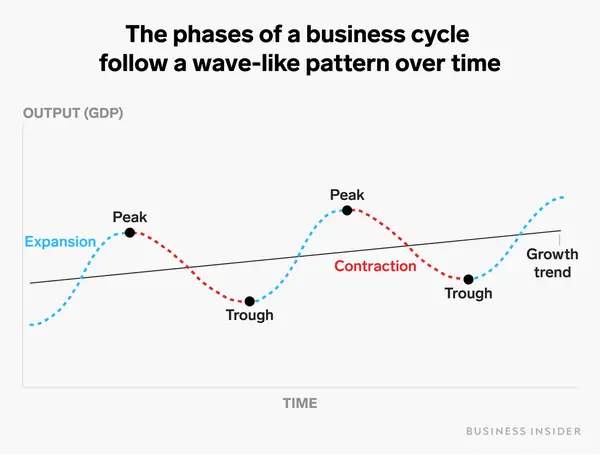
buisness cycle
represents short-term real GDP fluctuations around its long tterm trend/potential output
not predictable
strong correlation between emplyemnt and real GDP
not predictable
strong correlation between emplyemnt and real GDP
53
New cards
common access reources and the tragedy of the commons
non-excludable and rivilarous goods not owned by private firms
the tragedy of the commons = as everyone acts in sefl-intrest they will use as much of the goods as possible and deplet the resources creating market failure
the tragedy of the commons = as everyone acts in sefl-intrest they will use as much of the goods as possible and deplet the resources creating market failure
54
New cards
low unemployemnt
unemployment = when people of working age activley looking for work are without it
55
New cards
difficulties in measuring unemployment
hidden unemplyment - discourgaed workes, under employed, skilled but low skilled workers, redutant/retraining, undergournd economies
lack of specificity - riegion, gender, age, ethinicity, education level
lack of specificity - riegion, gender, age, ethinicity, education level
56
New cards
types of unemployment
structural: demand decreases for a type of labour, strcuture of economy/tech changes, invetibale
Fricitional: jon seekers entering/retutning to the labour force and looking for a job, new job seekers, people between jobs, invetiable
sesonal: demand changes based on season
cyclical: when ecoenomy is in recessionary gap from low AD causinf low demand and low production and labour demand, goes w business cycle, demand deficit unemployemtn
57
New cards
full employment
means natural rate of unemployment when economy is prodicying at potential or full emplyemnt lvl of output equal to structural, frictional and seasonla unemployemnt (around 4%)
58
New cards
subsidies
grants providede by governments to firms aimed at lowering production costs and increasing output
59
New cards
taxes
direct tax: paid directly to gov
indriect: spending on goods and services by consumers collected by the supplier on behalf of gov
used to raise revenue and discourage undesirable behviours
indriect: spending on goods and services by consumers collected by the supplier on behalf of gov
used to raise revenue and discourage undesirable behviours
60
New cards
price floors vs celiings
floor =gov imposed min price for sale of good or service
ceiling = gov imposed max price when below equilibrium (shortage)
ceiling = gov imposed max price when below equilibrium (shortage)
61
New cards
impact of economic growth
increased standrd of living
gretaer tax revnue if gov spends on merit goods
decreased unemployemnt
created wants
increased envriomental standrad
sime envriomental degreadtion
decreased soical inequality
gretaer tax revnue if gov spends on merit goods
decreased unemployemnt
created wants
increased envriomental standrad
sime envriomental degreadtion
decreased soical inequality
62
New cards
economic growth
increase in real/potential GDP
63
New cards
keysian model faults
wages rise faster than fall
prices raise faster than fall due to the high wages meaning that firms dont decrease price
stuck in short run faults if SRAS wont shift, recessionary gap stays
prices raise faster than fall due to the high wages meaning that firms dont decrease price
stuck in short run faults if SRAS wont shift, recessionary gap stays
64
New cards
keysian model
3 sections: depression, normal, physical limit
3 equilibriums: depression, normal and physical limit equilibrium
recessionary gaps can persist: reject that economies tend to fall to full employment
increase AD doesn't push up prices
3 equilibriums: depression, normal and physical limit equilibrium
recessionary gaps can persist: reject that economies tend to fall to full employment
increase AD doesn't push up prices
65
New cards
factors of LRAS
increase in quanity of resources
increase in quality of resources
tech advancements
increase in efficency and porductivity
institauional changes (privitastion, competition polices, regulation)
increase in quality of resources
tech advancements
increase in efficency and porductivity
institauional changes (privitastion, competition polices, regulation)
66
New cards
inflationary, ressionary and full SRAS Gap
inflationary = too much demand, increase employment, increase prices, output beyong full employment, behind eq.
ressionary = not enough demand, not worth to produce at capacity, unemployment hihger than natural rate, after eq.
full = at eq.
ressionary = not enough demand, not worth to produce at capacity, unemployment hihger than natural rate, after eq.
full = at eq.
67
New cards
LRAS
Represents potential output and full-employment level of output
Independent of price level
Determined by the quantity and quality of factors of production
In long run, always produce for potentioal GDP
Always return to full emplyment as: high job seekers cause low wages causes increase SRAS and high demand for labour causes high wages and decrease SRAS
Independent of price level
Determined by the quantity and quality of factors of production
In long run, always produce for potentioal GDP
Always return to full emplyment as: high job seekers cause low wages causes increase SRAS and high demand for labour causes high wages and decrease SRAS
68
New cards
costs of unemployemtn
stress
increased debt
family breakdown
subsatnce abuse
incrase crime
homelessness
increased debt
family breakdown
subsatnce abuse
incrase crime
homelessness
69
New cards
public goods and free rider problem
non-rivralours and non-excludable regardless of payment
free rider problem = anyone can use w/o paying so firms won't orivide as theres no profitincentive
free rider problem = anyone can use w/o paying so firms won't orivide as theres no profitincentive
70
New cards
externalities and responses to it
positve or negitve effects on a third party when a good or services is consumed and produced
responses: inofrmation campaigns, ads, legislation and regulation, indriect taxes, subsideis, government provision
responses: inofrmation campaigns, ads, legislation and regulation, indriect taxes, subsideis, government provision
71
New cards
GNI
= GDP + net income from abroad
total income of a country's FoPs regardless of location
total income of a country's FoPs regardless of location
72
New cards
real GDP and GNI
adjusted for inflation = real
not adjusted = nominal
real = nominal/deflator x 100
not adjusted = nominal
real = nominal/deflator x 100
73
New cards
desribe the buisness cycle
peak = max real GDP, low resource unemployment, low PL
expansion = growing ecnoomy, high reource emplyemny, hihg PL
contraction = shrinking economy, high resource unemployment, PL increase very slowly or decreases
trough = min real GDP, PL rises very slowly or falls
expansion = growing ecnoomy, high reource emplyemny, hihg PL
contraction = shrinking economy, high resource unemployment, PL increase very slowly or decreases
trough = min real GDP, PL rises very slowly or falls
74
New cards
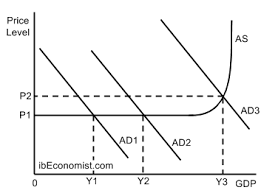
AD
total demand for all goods and services produced in an economy by c, g, i and x-m at diff prices
75
New cards
AD factors
c: consumer confidence, interst rates, wealth, income tax, debt, inflation expectations
i: business confidence, interst rates, tech, corporate tax
g: policatl and econominc priorities
x-m: income of other countreis, exhcnage rates, trade policies
i: business confidence, interst rates, tech, corporate tax
g: policatl and econominc priorities
x-m: income of other countreis, exhcnage rates, trade policies
76
New cards
AS
total quanitity of goods/services produced in an economy (real GDP) over a particular time at diff prices
77
New cards
AS factors
wages
commodities price
oil prices
taxes/subsisds
import prices
shocks
commodities price
oil prices
taxes/subsisds
import prices
shocks
78
New cards
expansionary vs contractionary monetary policiy
contractionary = increase intrest rates to weaken inflation, shifts AD down, reduces peaks on buisness cycle
expansionary = decrease interst rates to boost inflation to avoid deflation, reduces unemplyemnt as more labour needed for more consumption, shift AD up, reduces troughs on buisness cycle
expansionary = decrease interst rates to boost inflation to avoid deflation, reduces unemplyemnt as more labour needed for more consumption, shift AD up, reduces troughs on buisness cycle
79
New cards
strengths vs contrasints of monetray policiy
streghts: quick implementation, incremental, flexible, easily-reversible, apolitical
constraints : not effective for supply issues, limited cscope in reducing rates, low cosumer and business confidencede but spending is required for it to work
constraints : not effective for supply issues, limited cscope in reducing rates, low cosumer and business confidencede but spending is required for it to work
80
New cards
affects of monetary policy
c: increase intrest rates cause decrease c as dispsoable income decreases, cost of borrowing money increases and increased return on savings incentives it, and vise versa
i: increase intrest rate decrease i as cost of borrwoing money increases and vise versa
i: increase intrest rate decrease i as cost of borrwoing money increases and vise versa
81
New cards
monetray policiy
chnaging of money supply and intrest rates by central banks to influence AD
82
New cards
intrest rates
cost of borrrowin/reward for saving money
83
New cards
central bank
exsists for every currency, regulator of banks, banker to gov
84
New cards
goals of monetray policy
low and stable inflatio (2-3%)
low unemployment
decrease buisness cycle fluctuations
promote stable economice enviroment
external balance
low unemployment
decrease buisness cycle fluctuations
promote stable economice enviroment
external balance
85
New cards
limitation of CPI
no typical household
consuemrs often buy at sale CPI doesnt
chages in consumption patterns
international comparisons are difficult
consuemrs often buy at sale CPI doesnt
chages in consumption patterns
international comparisons are difficult
86
New cards
inflation
sustained increase in PL
87
New cards
deflation
sustained decrease in PL
88
New cards
disinflation
PL rises at decreasing rate
89
New cards
inflation rate
= current yr CPI - previous yr CPI/current yr CPI x 100
90
New cards
CPI
consumer price index, compares a basket of goods from yr to yt to relfect consumption habits of an avergae household
each good weighted on a frequency of purchaswe
each good weighted on a frequency of purchaswe
91
New cards
progressive tax
as income increases, tax rate incrases
92
New cards
regressive tac
as income increases, tax rate decreases
93
New cards
proportional tax
as income increasesm tax rate is constant
94
New cards
downwards deflation cycle
AD decreases so PL decreases so incentive to consume decreases as they wait for PL to fall more so I decrease and Production decreases so unemplyemnt increase and c decreases and production decreases and so on
95
New cards
downwards deflation cycle w bankruptcies
bankrupticies so real value debt increases so its harder to pay off so AD decrease as your not earning as much as you lower price and real value of money increases
96
New cards
equality vs equity
equality = being fair or just
equity = being equal
economic inequality = unequal ditsribution of wealth or income (more wealth unequality)
equity = being equal
economic inequality = unequal ditsribution of wealth or income (more wealth unequality)
97
New cards
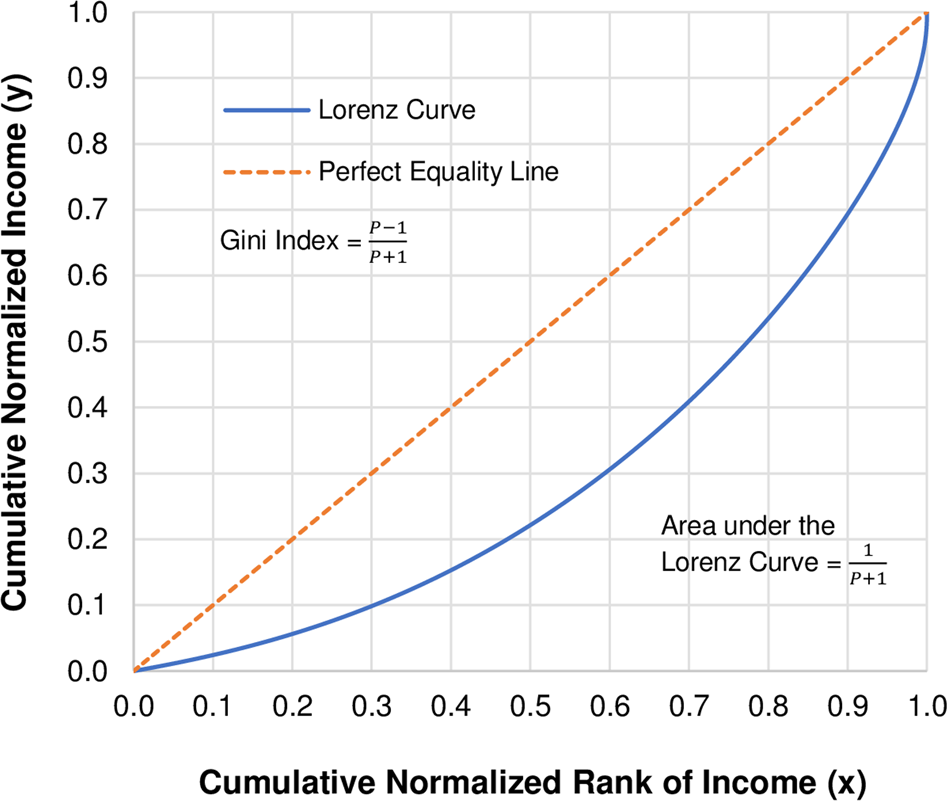
lorenz curve
visually represents income iequality, larger lorenz curve = larger inequality
98
New cards
gini coefficenent
numeroical representation of lorenz curve between 0-1
0 = prefect equality
hihger no = hihger inequality
gini coeff. = area between perfect line and lorenz curve/entire areas under perfect line
0 = prefect equality
hihger no = hihger inequality
gini coeff. = area between perfect line and lorenz curve/entire areas under perfect line
99
New cards
causes of inequality
inequality o opportunity
diff human capitak
diff resource ownership
discrimination
government tax and benfits policies
unequal status/power
tech changes
globalistaoin
market based supply side policies
diff human capitak
diff resource ownership
discrimination
government tax and benfits policies
unequal status/power
tech changes
globalistaoin
market based supply side policies
100
New cards
poverty
absoulte = ppl live below lvl of income neceassry to meeet basic needs (10% og global population0
relative = ppl earn income insufficent ot maintain a socially acceptable living standard, measured as % of ppl loving below 50% of median income
relative = ppl earn income insufficent ot maintain a socially acceptable living standard, measured as % of ppl loving below 50% of median income