Chapter 11: Process Analysis and Resource Utilization
1/18
There's no tags or description
Looks like no tags are added yet.
Name | Mastery | Learn | Test | Matching | Spaced | Call with Kai |
|---|
No analytics yet
Send a link to your students to track their progress
19 Terms
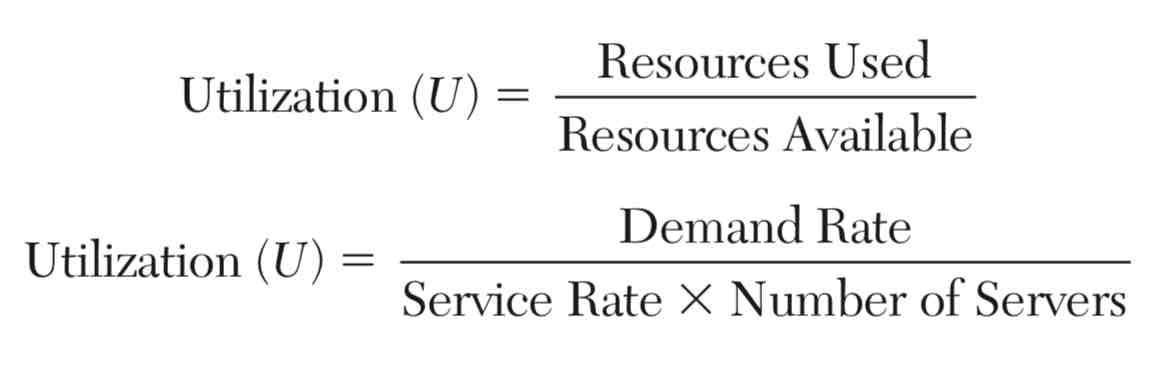
Utilization
The fraction of time a workstation or individual is busy over the long run
H
Two ways of computing resource utilization:
Based on proportion of available resources being used
Based on the ratio of demand rate to effective service capacity based on service rate and number of servers
Throughput
The number of units or tasks that are completed per unit time from a process
Bottleneck
The work activity that effectively limits the throughput of the entire process
Flow time (cycle time)
The average time it takes to complete one cycle of a process
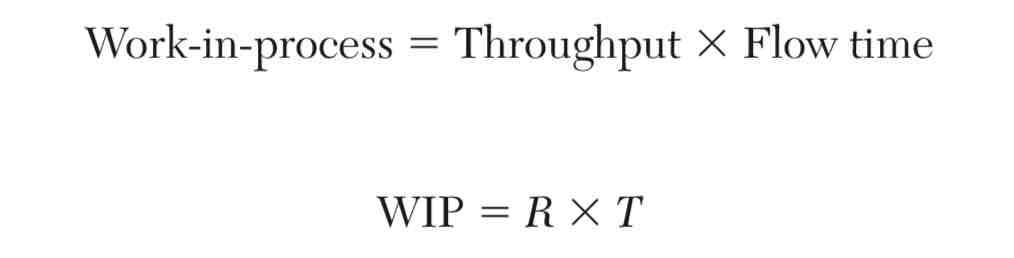
Little’s Law
A simple equation that explains the relationship among flow time (T), throughput (R), and work-in-process (WIP)
Queue
A waiting line
True
T or F: Queueing models help managers understand key performance measures such as waiting times, queue lengths, and machine or server idle times so that they can manage resources more effectively and provide better customer satisfaction.
Queueing system
It consists of customers that arrive for service, one or more servers that provide the service, and a queue (waiting line) of entities that wait for service if the server is busy
One or more parallel servers fed by a single queue
Several parallel servers fed by their own queues
A combination of several queues in series
Three (3) common queueing configurations:
Queueing theory
Analytical study of waiting lines

A simple model for the total cost of waiting for service (TCw) as a function of the number of servers as well as the average number of customers in the system:
where:
Cw = the waiting cost per hour per customer
Cs = the hourly cost associated with each server
L = average number of customers in the system(queue and in service)
k = number of servers
Fixed-time simulation model
A simulation model that increments time in fixed intervals
Theory of Constraints (TOC)
A set of principles that focuses on increasing total process throughput by maximizing the utilization of all bottleneck work activities and workstations
Physical constraint
Associated with the capacity of a resource such as a machine, employee, or workstation
Non-bottleneck work activity
One in which idle capacity exists
True
T or F: The TOC focuses on identifying constraints, managing bottleneck and non-bottleneck work activities carefully, linking them to the markets and financial performance metrics to ensure an appropriate product mix, and scheduling the non-bottleneck resources to enhance throughput.
The probability that the system is empty (i.e., the probability of 0 units in both the queue and in service).
The average number of units waiting for service in the queue.
The average number of units in the system (queue and in service).
The average time a unit spends waiting for service (time in queue).
The average time a unit spends in the system (waiting time plus service time).
The probability that an arriving unit has to wait for service.
The probability of n units in the system (queue and in service).
Typical performance measures that are computed using queueing theory:
True
T or F: Simulation models are also better equipped to capture the dynamic behavior of queues over time.