AP psychology Unit 1 Flashcards
1/18
There's no tags or description
Looks like no tags are added yet.
Name | Mastery | Learn | Test | Matching | Spaced | Call with Kai |
|---|
No analytics yet
Send a link to your students to track their progress
19 Terms
Experimenter bias
is a phenomenon that occurs when a researcher’s expectations or preferences about the outcome of a study influence the results obtained.
Demand characteristics
The clues participants discover about the purpose of the study, including rumors they hear about the study suggesting how they should respond. to eleminate this we should use single blind procedure.
between-subject design
research method in which different groups of participants are exposed to different conditions or treatments. Each group represents a different level of the independent variable being studied. For example, in a study examining the effectiveness of two different teaching methods on learning outcomes, one group of participants might receive Method A while another group receives Method B.
Within-subjects design
a research method in which the same group of participants is exposed to all levels of the independent variable being studied. Unlike between-subjects designs, where different groups receive different treatments, within-subjects designs involve repeated measures on the same group of participants. For example, in a study examining the effects of caffeine on cognitive performance, participants might complete a memory task under three conditions: with no caffeine, with a low dose of caffeine, and with a high dose of caffeine.
Counterbalancing
a procedure that assigns half the subjects to one of the treatments first and the other half of the subjects to the other treatment first.
Retrospective
a method of data collection or analysis that involves looking back on past events, experiences, or behaviors. It's a way to gather information about someone's thoughts, feelings, or actions after the fact, rather than in real-time.
Reliability
is consistency or repeatability, same score
Validity
is the extent to which an instrument measures or predicts what it is supposed to.
descriptive statistics
a set of methods used to summarize and describe the main features of a dataset, such as its central tendency, variability, and distribution
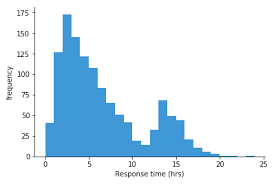
Histogram
a bar graph from the frequency distribution
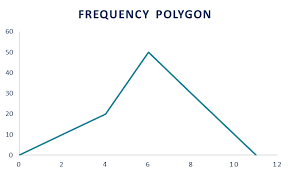
Frequency Polygon
A line graph that replaces the bars with single points and connects the points with a line
Central Tendecy
average or most typical scores for a set of research data or distribution
Mode
most frequently occurring score.if 2 scores appear most frequently the distribution is bimodal if 3 multimodal
Median
the middle score when the set of data is ordered by size
Variability
spread or dispersion of scores for a set of research data or distribution. measures of variability include Rage, variance and standard deviation
z-score
tells you how many standard deviations you are away from the mean. If a z-score is equal to 0, it is on the mean. A positive z-score indicates the raw score is higher than the mean average. For example, if a z-score is equal to +1, it is 1 standard deviation above the mean.
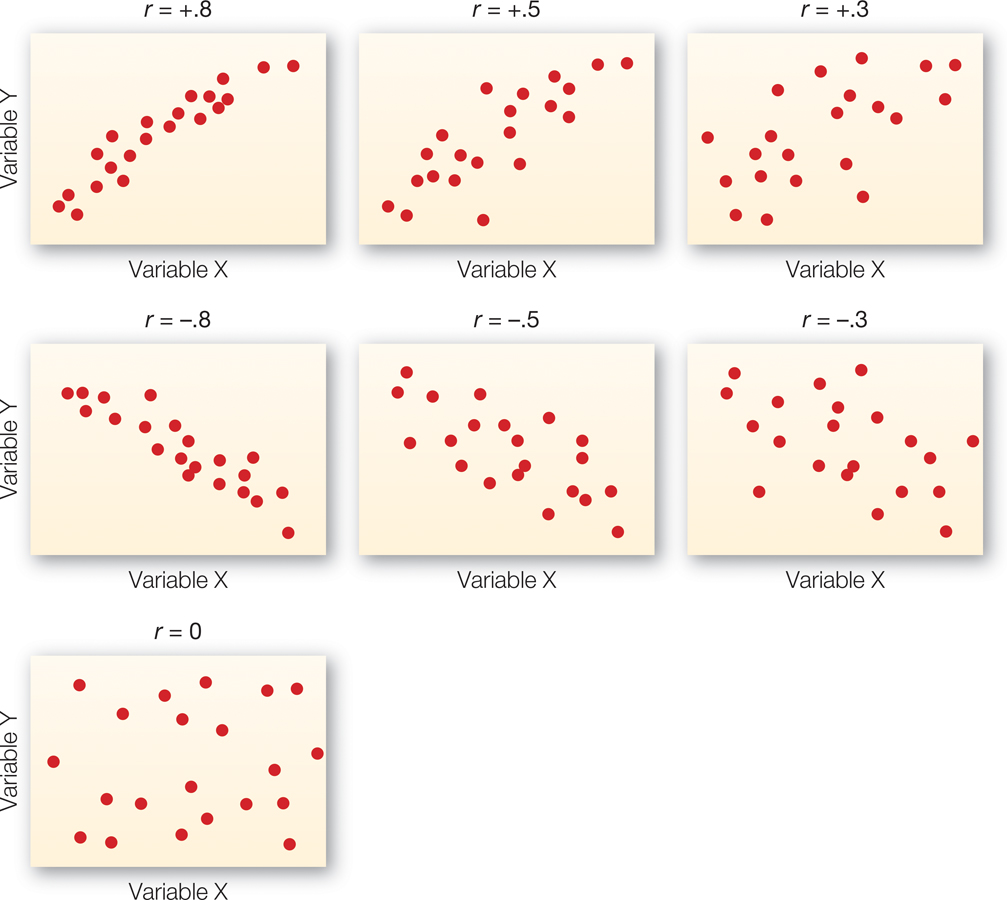
Correlation coefficient (R)
varies from -1 to +1 one indicates a perfect relationship between 2 sets of data. if R is -1 that perfect relationship is indirect of inverse
Inferential statistics
used to interpret data and draw conclusions they tell psychologists whether or not they can generalized from the chosen sample to the whole population.
Statistical significance (P)
measure of the likelihood that the difference between groups result from a real difference between the two groups rather than from chance alone. A p-value of 0.05 or lower is generally considered statistically significant.