PStats Exam 1
1/51
There's no tags or description
Looks like no tags are added yet.
Name | Mastery | Learn | Test | Matching | Spaced | Call with Kai |
|---|
No analytics yet
Send a link to your students to track their progress
52 Terms
Population
Entire group of interest
Sample
Individuals selected to represent the population
Parameter
Value describing a population
Statistic
Value describing a sample
Descriptive Statistic
Summarize, organize, and simplify data
Inferential Statistic
Use sample data to make generalizations about the population
Constructs
internal attributes (intelligence) that can’t be directly observed
Experimental Method
Purpose: Demonstrate Cause & Effect relationship
Includes: Manipulation, control experiment (group that does not receive the treatment; serves as a baseline), and random assignment
Operational Definition
Defines constructs in measurable terms
Discrete Variable
(Whole numbers) No values between categories (# of children —> can’t have 2.5 kids)
Continuous Variable
(decimals) Infinite possible values (ex: height)
Variable
Characteristic/condition that changes (varies)
Data (plural)
Measurements/observations of a variable
Datum (singular)
one measurement (also called score)
Data Set
Collection of measurements
Nominal
(N=Name) Categories with names (no order)
Ordinal
(Ord - Order) Ordered categories, but differences are not measurable (small, medium, large)
Interval
Equal intervals, no absolute zero (ex: Temp)
Ratio
Interval scale Absolute Zero (ex: weight)
Manipulation
researcher controls level of independent variable
Independent Variable
Manipulated
Dependent Variable
Measured outcome
Descriptive Research
Measure 1 or more variables per individual
Can use category or numerical variables
Correlational Method
Measure two variables in one group to see relationships
Describe type and magnitude of relationship
No cause and effect
Comparing Groups
One variable defines groups, another is measured
Experimental and non-experimental
ex: Violence/no violence vs aggressive behavior
Frequency Distribution
Grouping together all individual scores that are the same
∑f = N
sum of frequencies = total sample size (N) (add up the amount of numbers - 1,2,3 n =3)
Add up the total of Frequencies (4+1+2)
∑X
Sum of scores
∑f(X)
Multiply each X with their corresponding Frequency number, once you multiplied all numbers on the table, you add it together to get ∑X
What frequency distribution graphs are for Interval or Ratio data?
Histograms
Block histograms
Polygons (line graphs)
What frequency distribution graphs are for Nominal or Ordinal data?
Bar graphs
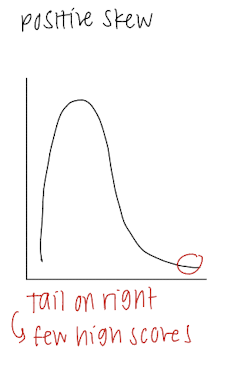
Positive Skew
Tail on right = fewer high scores
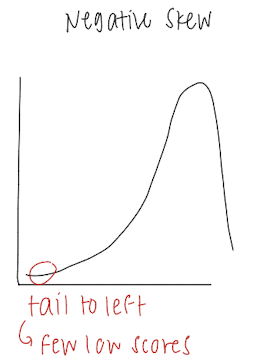
Negative Skew
Tail to the left = few low scores
What are the axis of the frequency distribution graphs?
Y = frequency
X = Scares
Mean
Sum of all scores divided by # of scores in data
Central Tendency
A single score that defines center of distribution
Measures of central tendency: Mean, Median, Mode
Proportions (p)
Fraction of the group associated w/ each score
p= f/N
Median
middle score when data are ordered from smallest to largest
If N (sample size) is odd —> middle score
If N is even —> average two middle scores
Mean vs Median
Mean = median —> normal distribution
Mean > median —> positive Skew (tail right)
Mean < median —> negative skew (tail left)
Outliers/skewed = use median
# balances w/o extreme scores = use mean
Mode
score or category that has highest frequency
When to use mean
Calculate Sum of variables (∑X)
Know value of every score
Ratio Scale
Interval Scale
When to use median
Extreme scores
Skewed distribution
Undetermined Values
Open-ended distribution
Ordinal Scale
When to use Mode
Nominal scales
Discrete variables (whole #’s only)
Describing shape
Variability
measure how spread out scores are in a distribution, in terms of distance
Standard Deviation
Average distance between individual scores and mean
Steps to find standard deviation
Find deviation score for each (x-µ)
Square each deviation score (x-µ)²
Sum the squared deviation SS = ∑(x-µ)²
Find variance
Find standard deviation
Sum of Squared Deviations
Definitional Formula
Computational Formula (only use when decimal #’s for the mean)
Find each deviation score (x-µ)
(x+µ)²
Sum of square deviation
Z-Scores
Tells us where a raw score (X) is located relative to the mean (population (µ) or Sample (M)) in units of standard deviation (𝞼 or S)
Mean is ALWAYS 0
Standard Deviation is ALWAYS 1
Z Score compared to mean
Z = 0 —> score is at the average/mean
Z > 0 —> Score is above average (+)
Z < 0 —> Score is below average (-)
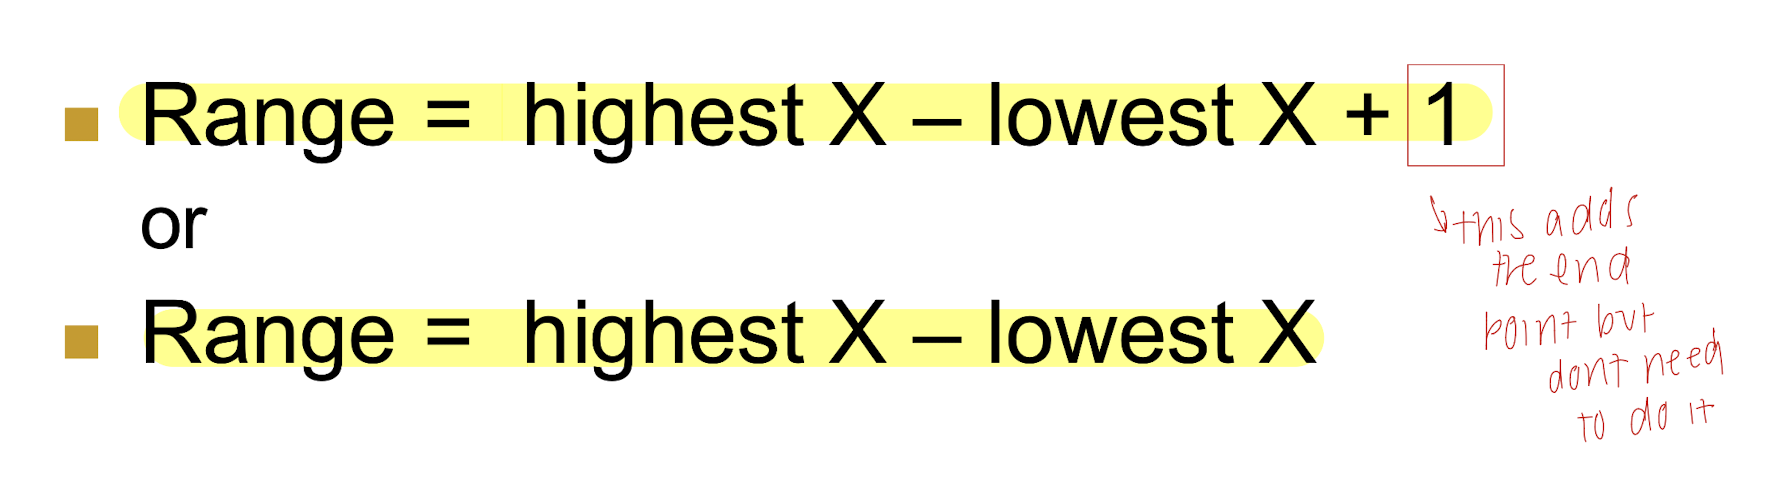
Range
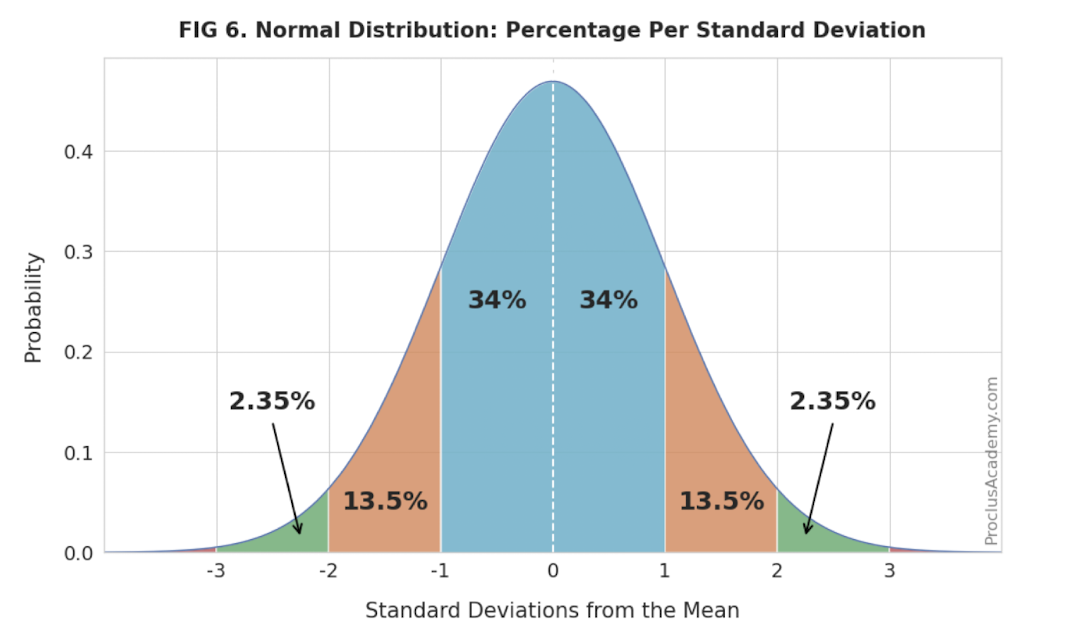
Normal Distribution
Control Condition
Does not receive the treatment:
This group serves as a point of comparison, acting as a baseline to show what happens without the experimental intervention.
Purpose:
To rule out alternative explanations for the experimental results and isolate the effect of the independent variable.
Experimental Condition
Receives the treatment:
Participants in this group are exposed to the independent variable, the factor that the researcher is manipulating or investigating.
Purpose:
To observe the effects of the independent variable on the dependent variable.