pp8
1/19
There's no tags or description
Looks like no tags are added yet.
Name | Mastery | Learn | Test | Matching | Spaced | Call with Kai |
|---|
No analytics yet
Send a link to your students to track their progress
20 Terms
SUPPLY
- the quantity of a good or service that producers are willing and able to offer for sale at each possible price during a given time period.
THE LAW OF SUPPLY
The law of supply states that, all other things being equal, the price and quantity supplied of a good or service are positively related.
The quantity supplied
The quantity supplied is the amount of a good or service people are willing to sell at a specific price.
A supply schedule
A supply schedule shows how much of a good or service producers will supply at different prices.
supply curve
The supply curve is the graphical representation of the supply schedule.
It also shows how much of a good or service producers are willing to supply at different prices.
These two supply schedules show quantity supplied before and after the adoption of a new technology that boosted productivity.
Adopting the technology enables suppliers to offer a greater quantity of cotton at any given price.
A movement along the supply curve
A movement along the supply curve is a change in the quantity supplied of a good that is the result of a change in price.
Shifts of the Supply Curve
A shift of the supply curve is a change in the quantity supplied at any given price.
It is represented by the movement of the original supply curve to a new position.
decrese in the supply
It is represented by the movement of the original supply curve to a new position.
At any given price, there’s a decrease in the quantity supplied.
increase in supply
An increase in supply means a rightward shift of the supply curve.
At any given price, there’s an increase in the quantity supplied.
When shifting supply, students often mistakenly assume that a leftward shift is an increase in supply since the curve is “higher”.
To avoid this confusion, remind students that an increase will always shift the curve right and a decrease will always shift the curve left. This applies to both supply and demand.
When drawing these shifts it’s best to draw arrows that point left and right rather than up and down.
Understanding Shifts of the Supply Curve, rotten
Any change in these five factors can shift the supply curve (6 shifters or determinants of Supply):
1) Resource costs and availability
2) Other goods’ prices
3) Technology / Productivity
4) Taxes and other government actions
5) Expectations for the Future
6) Number of Sellers/Producers
ROTTEN is a mnemonic device that can help you remember these factors.
1) Resource costs and availability
A change in the price of an input (a good or service used to produce another good or service) can shift the supply curve.
Sugar and cream are inputs for ice cream. If the price of sugar or cream rises, the ice cream supply curve shifts left.
Oil is one input for airline fuel. If the price of oil goes down, the supply curve for flights shifts right.
IF THE PRICE OF STEAL INCREASES WHAT HAPPENS TO SUPPLY, Supply of buses would decrease
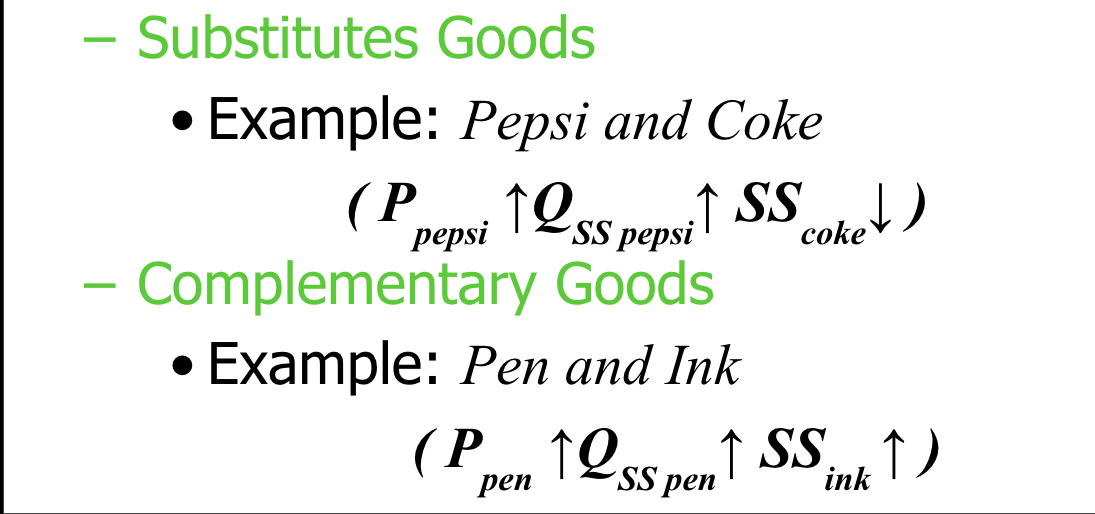
2) Other goods’ prices
A change in the price of a related good or service shift the supply curve differently depending on whether the goods are substitutes or complements in production.
3) Technology / Productivity
Changes in the available technology used to produce a good or service can shift the supply curve.
4) Taxes and other government actions
Government actions such as:
TAXES and SUBSIDIES -They have the same impact as cost of inputs.
If the producer’s inventory is taxed, the cost of production increases. (Shift to the left)
If the government provides subsidies, the cost of production decreases. (Shift to the right)
GOVERNMENT REGULATIONS - When government places mandates on producers, the cost of inputs increases, shifting the curve to the left.
For example, when government mandates new auto safety features such as air bags, and emission controls, cars cost more to produce.
5) Expectations for the Future
Changes in expectations of how the price of a good or service will change in the future can shift the supply curve.
Expecting gas prices to peak in the summer, producers may lower the supply of gas in the spring.
6) Number of Sellers/Producers
Changes in the number of producers of a good or service can shift the supply curve.
If many orange producers go out of business, the supply curve for oranges will shift to the left.
Individual Versus Market Supply Curves
The market supply curve is the horizontal sum of the individual supply curves of all producers in that market.