Chemistry 3.6- Organic Analysis
1/15
There's no tags or description
Looks like no tags are added yet.
Name | Mastery | Learn | Test | Matching | Spaced | Call with Kai |
|---|
No study sessions yet.
16 Terms
What test can be used to identify aldehydes and primary and secondary alcohols?
Add acidified potassium dichromate
Positive test- orange solution → green precipitate
What test can be used to identify alcohols?
Add sodium metal
Positive test- bubbles (this is hydrogen gas)
What two tests can be used to identify aldehydes?
Warm with Fehling’s solution
Positive test- blue solution → red precipitate
OR
Warm with Tollen’s reagent
Positive test- colourless liquid → silver mirror
What test can be used to identify alkenes?
Shake with bromine water
Positive test- orange solution to colourless (decolourises bromine)
What test can be used to identify carboxylic acids?
Add sodium carbonate or sodium hydrogen carbonate solution
Positive test- bubbles (this is CO2- you can bubble it through limewater to confirm (clear solution → cloudy))
What test can be used to identify haloalkanes?
Add aqueous sodium hydroxide
Acidify with nitric acid
Add silver nitrate solution
Positive tests:
Chloroalkane- colourless solution → white precipitate
Bromoalkane- colourless solution → cream precipitate
Iodoalkane- colourless solution → yellow precipitate

What would the mass of this compound be?
58- the molecular ion peak (tallest peak to the right)
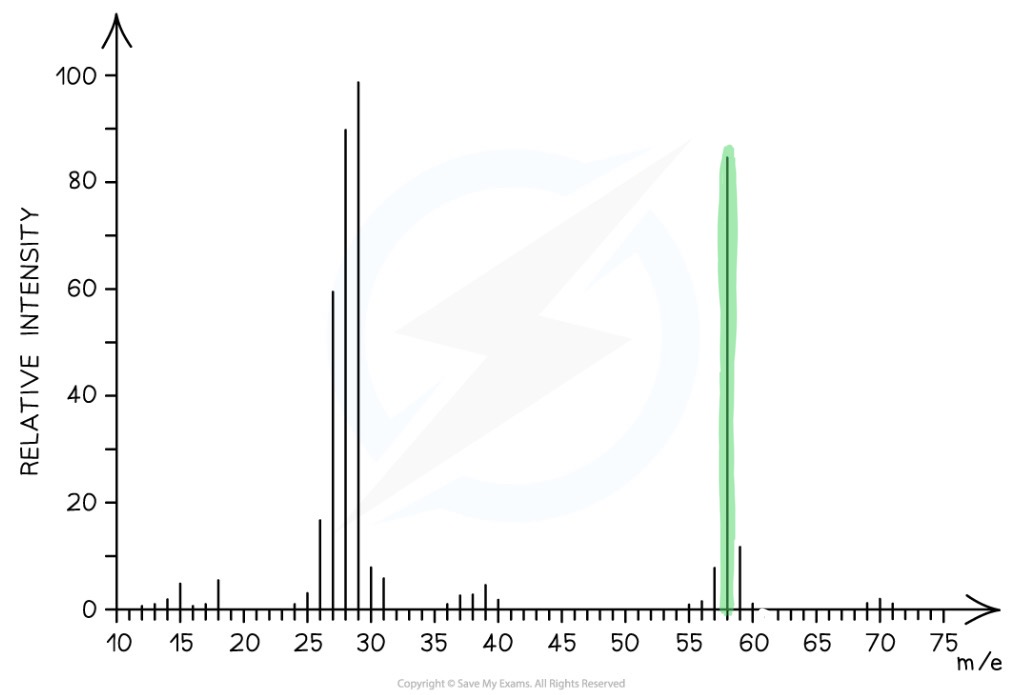
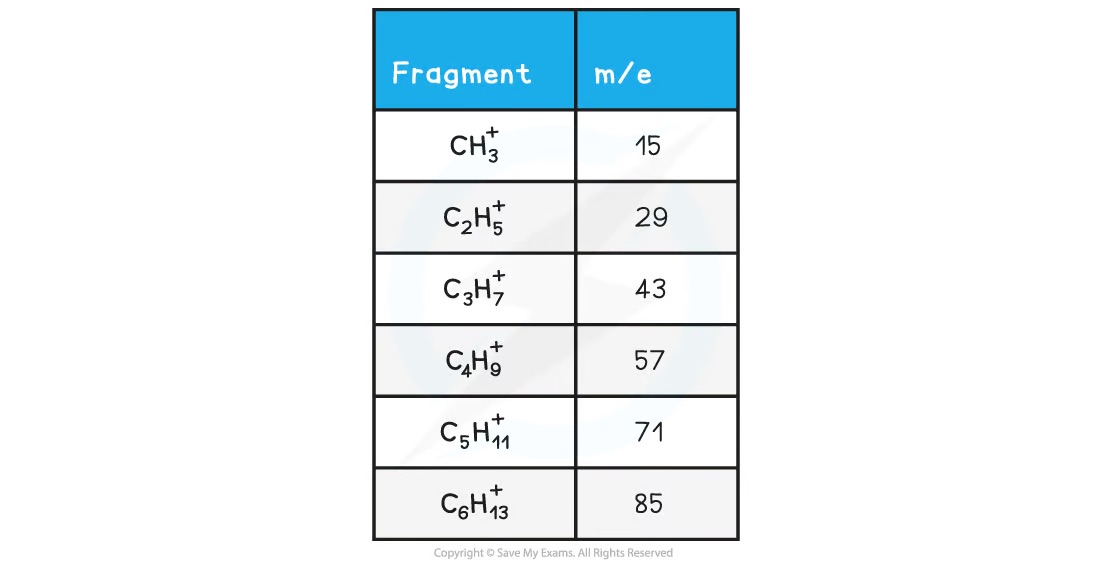
What m/z values are significant in mass spectrometry and why?
15, 29, 43, 57, 71 and 85
They are the masses of the alkyl chains which are commonly seen as fragment values in mass spectra
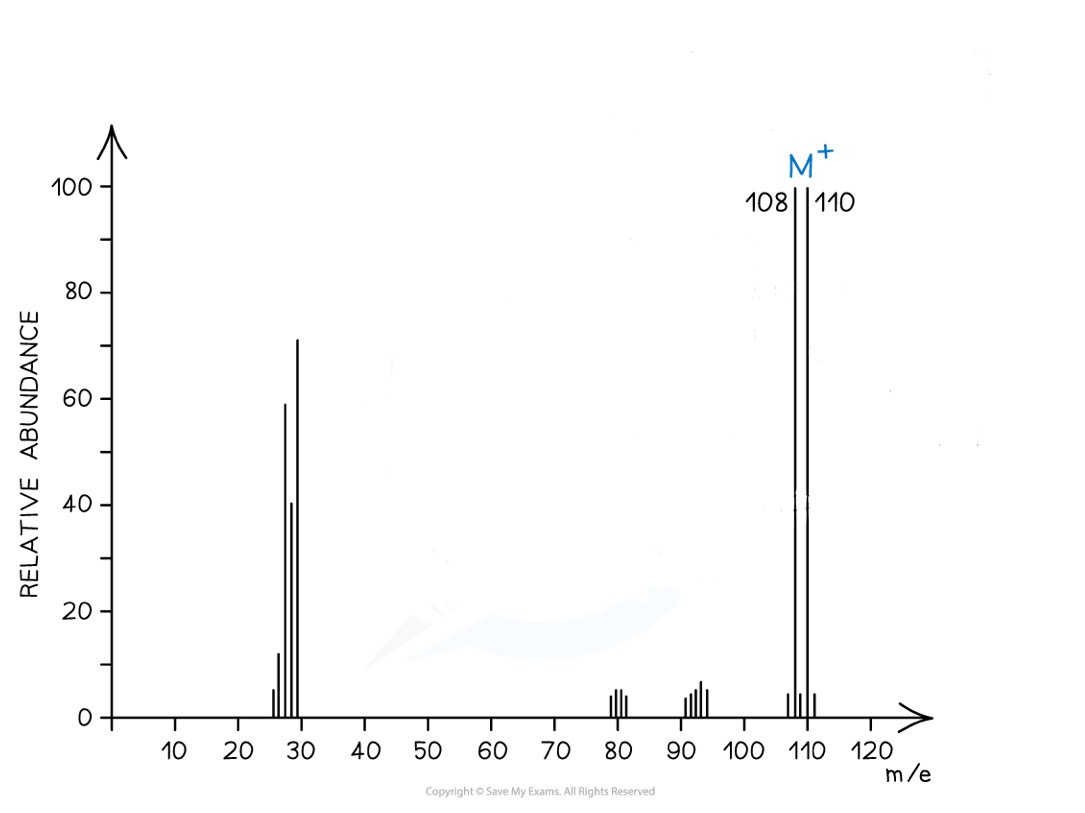
Deduce the molecule in this mass spectrum
Two peaks at equal heights, 2 units of mass apart
So it contains a bromine atom, as bromine exists as the isotopes ⁷⁹Br and ⁸¹Br in equal proportions
110-81 = 29 which is the remaining mass
So this is the mass spectrum for C₂H₅Br
How does infrared spectroscopy work?
All bonds vibrate at a unique frequency, within the infrared range
Strong bonds and bonds between light atoms vibrate at high frequencies
When you shine a beam of infrared at a sample, the bonds will absorb their natural infrared frequencies
This means that the infrared that emerges will be missing the frequencies of the bonds in the sample
A graph of frequency vs the intensity detected is plotted by an IR spectrometer and can be compared to identify molecules
Frequency is expressed in the unit wavenumbers (cm⁻¹)
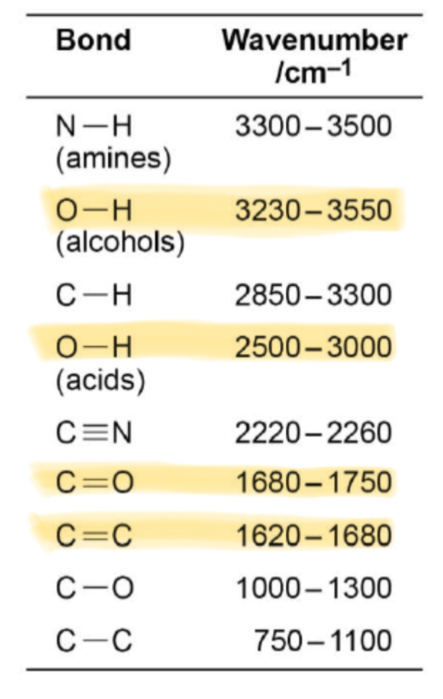
What absorption corresponds with the O-H bond in alcohols?
Broad absorption between 3230 and 3550

What absorption corresponds with the O-H bond in carboxylic acids?
Broad absorption between 2500 and 3000

What absorption corresponds with the C=O bond in aldehydes, ketones and carboxylic acids?
Sharp absorption between 1680 and 1750

What absorption corresponds with the C=C bond in alkenes?
1620-1680
What is the region in an IR spectrum below 1500 cm⁻¹?
The fingerprint region
Incredibly specific and unique to each molecule
This region is compared to other known spectra in a database to identify the compound
How can IR spectroscopy be useful?
Identifying individual molecules and functional groups by fingerprinting
Identifying impurities in compounds by looking at unexpected peaks