genomics - RNA biology I
1/72
There's no tags or description
Looks like no tags are added yet.
Name | Mastery | Learn | Test | Matching | Spaced | Call with Kai |
|---|
No analytics yet
Send a link to your students to track their progress
73 Terms
transcription 3 steps
initiation
elongation
termination
transcription initiation
-TFIID binds to TATAA box
-binding of TFIIB
-binding of RNA pol + TFIIF
-binding of TFIIE + TFIIH
RNA Polymerase II
responsible for the synthesis of mRNA from protein-coding genes
general transcription factors
-basic transcription machinery
transcription from all pol II promoters
regulatory transcription factors
regulatory proteins whose function is to activate (or more rarely, to inhibit) transcription of DNA by binding to specific DNA sequences
ncRNAs
non-coding RNAs
-heterogenous group of transcripts that are not translated into proteins
rRNA
ribosomal RNA
ncrna
tRNA
transfer RNA
ncrna
snRNA
small nuclear RNAs
ncrna
critical components of the spliceosome that catalyze the splicing of pre mrna
snoRNAs
small nucleolar RNAs
ncrnas
widely present in the nucleoli of eukaryotic cells
important for RNA biogenesis and chemical modications of rRNA, tRNA, and mRNA
siRNAs
small interfering RNAs
~20 bp
ncrna
induces gene silencing by targeting complementary mRNA for degradation
miRNAs
~22 nt
ncrna
leads to mRNA degradation or inhibition of mRNA translation
miRNA origin
miRNA originate from endogenous transcripts(have their own genes)
siRNA origin
exogenous dsRNA
RISC
RNA-induced silencing complex
miRNA RISC
formed with Ago1-4
siRNA RISC
formed with Ago2
miRNA target mrna binding
imperfect complementary binding
translational repression and mrna degradation
siRNA target mRNA binding
specific target sequence binding
mrna cleavage
piRNAs
small PIWI-interacting RNAs
21/24/26-31 nucleotides
piRISC: piRNA-induced silencing complex
-protects genome integrity
binds to PIWI protein
3’ end modification: 2’-o methyl
transposon silencing
lncRNAs
long non-coding RNAs
noncoding transcripts of more than 200 nucleotides
linear lncrnas and circular rnas
RNA polymerase III
synthesizes tRNA and 5S rRNA, some small RNA
RNA polymerase I
synthesizes 5.8S, 18S, and 28S rRNA
gene expression importance
-provide a snapshot of cellular/tissue state at the molecular scale
-provide snapshot of cumulative interactions of many regulatory relationships
-proxy measure for transcription/translation functional events
gene expression assumptions
-assume that gene expression levels correspond to functional protein levels
-assume that a normal cell has a standard expression profile/signature
-assume that changes in expression profile indicate that some property or functional changes
how much of the genome is transcribed
eukaryotic genomes transcribe up to 90% of the genomic DNA
how much of mRNA gets encoded into protein
only 1-2% of transcripts encode for proteins, the vast majority are transcribed as non-coding RNAs
mRNA levels vs protein levels
significant discrepancy between mRNA and protein levels
-differentially expressed mRNAs correlate significantly better with their protein product than non-differentially expressed mRNAs
regulation of protein abundance
-chromatin regulation
-mrna stability
-translational efficiency
-decay rates
-copy number variation
-promoters, enhancers, silencers, insulators
-histone and dna modifcations
northern blot
targeted RNA quantification
to determine the size and quantity of specific RNA molecules among a mixture of RNA
best for determining the size of a specific rna transcript
-load RNA samples into gel, gel electrophoresis
-blot onto a filter
-expose filter to a labeled hybridization probe: complementary to target RNA sequence, single stranded, labeled with radioactive isotope or fluorescent dye
-wash away unhybridized prob
northern blot pros
-simplicity of the procedure and low cost
-very sensitive due to use of radioactive probes
-nearly infinite dynamic range
northern blot cons
-time-consuming
-only a small number of samples can be analyzed at one time
-requires a large amount of starting material
-quality control (non-specific hybridization)
in situ hybridization
-to localize and detect RNA or RNA sequences in morphologically preserved cells, tissue sections, and even whole tissue
visualize the location of a specific RNA within a tissue or cell, spatial information
in situ hybridization pros
-provide spatial information of cellular content
-single-cell sensitivity
-spatial and temporal analysis
-can be used on archival tissues
in situ hybridization cons
-expensive
-time consuming
-require experienced personnel
-probe and sample-specific, have to be optimized for each set of conditions empirically
RT-qPCR
Reverse transcription quantitative PCR
-accurate, sensitive and fast method of nucleic acid detection and quantification
-relies on fluorescence to detect and quantify nucleic acid amplification products
The most sensitive method for detecting and quantification of gene expression
Ideal for analyzing a few genes with high accuracy
1) convert total RNA to cDNA
2) add cDNA to RT qPCR master mix and aliquot mixture across PCR array
3) run in RT-qPCR instrument
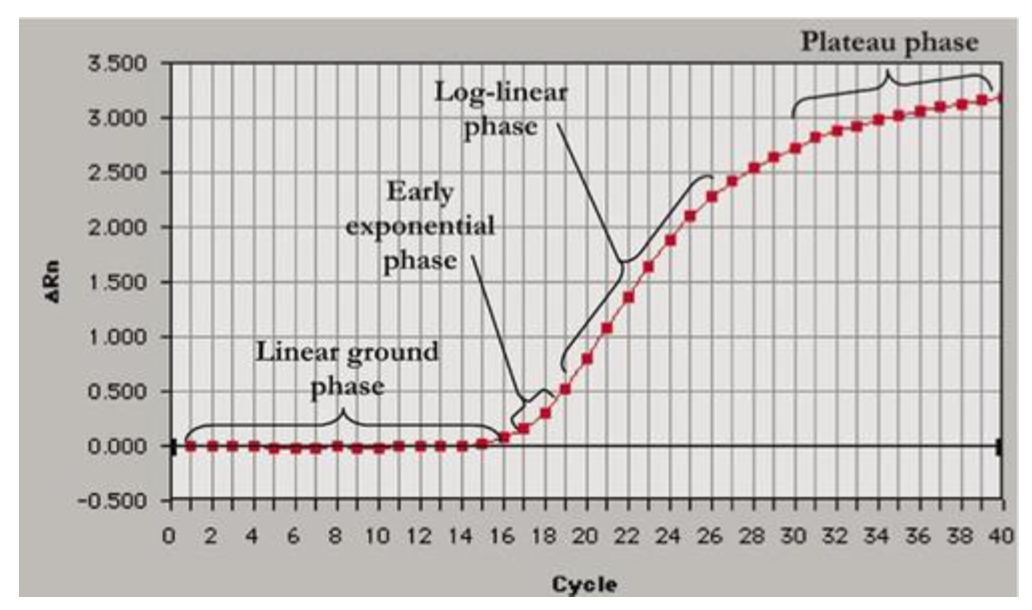
phases of PCR amplification curve
-linear ground phase
-early exponential phase
-log-linear phase
-plateau phase
good RT-qpcr designs will have these distinct phases
RT-qPCR pros
-highly sensitive, quantitative and reproducible
-’gold standard’
-excellent dynamic range
-fast results
RT-qPCR cons
-expensive
-not high-throughput
-non-specific amplification can lead to false positives
-always have positive and negative controls
reporter gene assay
tag gene with a fluorescent reporter or something that can be quantified
Used to study regulatory elements of a gene by monitoring the activity of a reporter gene under different conditions
applications:
-determine promoter or enhancer strength
-interactions between transcription factors and promoters
-protein-protein interactions
-signal transduction
-drug screening both in vitro and in vivo
reporter assay pros
-in vivo applications
-highly sensitive
-new technology enables longitudinal studies
reporter assay cons
-stability issues
-not high-throughput
-quantification in vivo is affected by many variables
micro array
hybridization between dna strands
quantifies RNA through template hybridization and dye intensity
Allows for simultaneous analysis of thousands of genes, useful for exploring global gene expression patterns of model organisms
-control and experimental group
-make cDNA reverse transcripts
-label cDNAs w fluorescent dyes
-hybridization to microarray
-laser excitation
-computer calculates ratio of emission intensity
microarray pros
-high throughput
-reliable and more cost effective than rna-seq for gene expression profiling in model organisms
-kit systems: easy to use
microarray cons
-need target transcripts information
-quality and quality control highly variable
-cross hybridization
-multiple tissue samples cannot be tested in one assay, a control and test tissue sample need to be prepared separately
RNA-seq
uses next gen sequencing to analyze the quantity and presence of RNA molecules in a biological sample
Provides a comprehensive view of the transcriptome, including novel transcripts and isoforms, offering the most detailed information about gene expression
-RNA extraction and target enrichment
-fragment, reverse transcribe, ligate adapters, amplify
-sequence
-transcriptome/genome mapping
-data analysis
RNA-seq pros
-high throughput
-transcript identification and quantification in a single assay
-very direct and quantitative
-no prior knowledge of genome required
-a greater dynamic range to quantify transcripts allows more differentially expressed gene detection
-single-nucleotide resolution allows the detection of genetic variants, transcript isoforms and splice variants
RNA seq cons
-amplification steps can offset balance between high/low abundance transcripts
-higher cost than microarray
-analysis is non-trivial
H0, the null hypothesis
asserts that there is no effect or differences between treatment and control groups
Ha, the alternative hypothesis
there is an effect or differences
hypothesis testing
-state hypothesis
-set signficance level (a) BEFORE the experiment
-collect and prepare data: representative of the population, appropriate sampling method, determining sample size
-choose appropriate statistical test: continuous or categorical? normal distribution or not? sample size, number of groups being compared
-calculate p-value
-make a decision
p-value
statistical test quantifies how much the sample data deviates from the null hypothesis
p-value = probability of observing results as extreme as the sample data, assuming the null hypothesis is true
p-value <= a
reject null hypothesis
p-value >= a
fail to reject null hypothesis
Type-I error (a)
Concluded that null hypothesis could be rejected, but null hypothesis is actually true
Type II error (B)
Concluded that null hypothesis couldn’t be rejected, even though the null hypothesis is false
a
alpha
the maximum probability of making a type I error
usually 0.05
B
beta
when the alternative hypothesis is true, the probability of rejecting it
the probability of making a type II error
Power
= 1 - B
the ability of a test to detect a true effect when it’s there
Confidence interval
=1-a
commonly 0.95
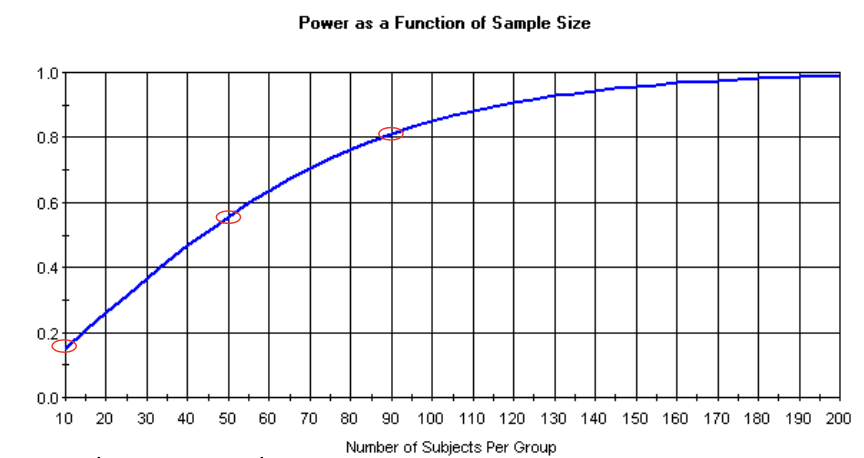
power analysis
to determine the necessary number of subjects needed to detect an effect of a given size
to determine power, given an effect size and number of subjects available
no point in conducting a study that is seriously underpowered
power analysis softwares
G*power 3
Power analysis & sample size
R: pwr package
power and sample size
increased sample size leads to increase of power
plateaus when theres a lot of subjects
cohen’s d
difference between 2 means divided by the pooled standard deviation
d= 0.01 → very small effect size
d = 0.8 → large effect size
bonferroni correction
p-value for each test must be equal to its alpha divided by the number of tests performed
a/g
g = number of null hypotheses being tested
false discovery rate
nDE * a
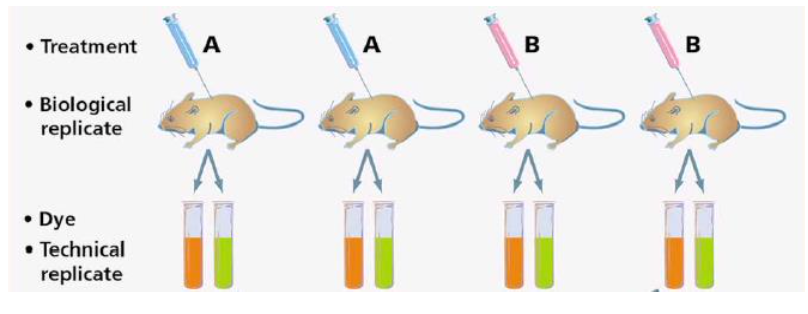
types of replicates
biological replicates: have as many as possible
technical replicates
RNA extraction
-RNA extracted from tissue is very heterogenous, many cells and diff cell types
-total RNA contains diff types of RNA
-extremely susceptible to degradation
RNA quality control
-measure RNA concentration: spectrophotometer, A260nm
-measure RNA purity: A260/A280 = between 1.8 and 2
-other contaminants: A230, salts or phenol
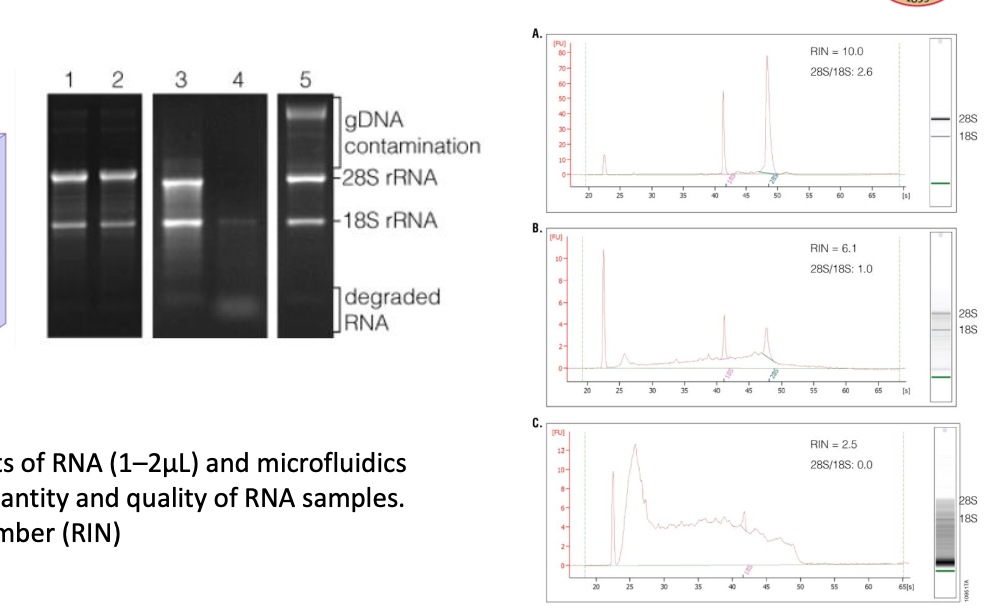
measuring RNA integrity
can be visualized on a gel and using bioanalyzers
RNA integrity number (RIN): 2.5 means really degraded
data normalization
need to account for different loading quantities, different input number of cells, different transfection efficiency
two-tailed statistical test
no particular direction of expected difference is assumed
one tailed statistical test
should only be performed when there is clear evidence that the intervention should only act in one direction