aphg unit 2.1-2.12
1/90
Earn XP
Name | Mastery | Learn | Test | Matching | Spaced | Call with Kai |
|---|
No analytics yet
Send a link to your students to track their progress
91 Terms
spatial distribution
how features of a landscape is arranged across the space of the earth (two types: clustered and dispersed)
density
frequency/concentration with which something occurs in a space (involves the number of a feature and its land area)
concentration
extent of a feature spread over a space
pattern
geometric or regular arrangement of objects in a space (three types: linear centralized and random)
population distribution
pattern of human settlement (the spread of people across the earth)
population density
shows the concentration of a population within a space
east asia south asia europe and southeast asia
2/3 of the worlds population is clustered in these 4 regions bc distribution is not even
physical factors
the geography of the earth has an influence on where people live and don’t live
ecumene
describes the inhabited places on the earth that are usually moderate climates that are suitable for agriculture and close to a water source (basically where people live)
human factors
possiblism states that we are able to overcome environmental obstacles as a result humans have more options when it comes to where they choose to live (ex of things that contribute to this terms include culture economics history and jobs)
arithmetic density
a method to calculated population density that is the total number of people over the total land, it shows human created boundaries and designations but it says little about population distribution
physiological density
a method to calculated population density that is the total number of people over the total arable land of a certain place, it determines a places carrying capacity
agricultural density
a method to calculated population density that is the total number of farmers over the total arable land of a certain place, it provides indication of the efficiency of the regions farmers and also can show development as MDCs have more machinery than farmers while LDCs are the opposite
arable land
land that can be used for farming
carrying capacity
how much the land can support the population without significant environmental deterioration, a lower percentage is seen as a good thing while a high percentage is seen as a bad thing and may require the place to start importing goods to support the population
overpopulation
more people than the environment can support (exceeds the carrying capacity)
population pyramids/age sex diagrams
a model that shows the population divided into male and female and also divided by age
dependency ratio
demographic measure of the ratio of the number of dependents to the total working age population
15-64
the working age
christmas tree/triangle shape
this shape on the population pyramid indicates rapid growth/stage 2 country
box shape
this shape on the population pyramid indicates slow growth or zero growth/stage 3 or 4 country
cup shape
this shape on the population pyramid indicates negative growth/stage 5 country
total fertility rate (TFR)
number of children born to women of child bearing age
2.1
the replacement rate
infant mortality rate (IMR)
not all kids make it into adulthood - this is the total number of death in a year among infants under one year old for every 1000 live births in a society
children mortality rate (CMR)
not all kids make it to adulthood - it’s the total number of deaths per year among children between one-five years old
natural increase rate (NIR/RNI)
also known as growth rate, it’s the difference between the number of births and deaths in a specific period of time (gains/losses through migration are not counted)
crude brith rate (CBR)
gross number of live births for every 1000 people
crude death rate (CDR)
gross number of deaths for every 1000 people
demographic balancing equation
(births+in migration)-(deaths+out migration)=total population
demographic momentum
tendency for growing populations to continue growing after a fertility decline (snowball effect)
doubling time
projected amount of time it will take for a given population to double (calculated by rule of 70)
rule of 70
70/NIR
life expectancy/longevity
average number of years a person is expected to live
stage one-mass chaos
stage of the epidemiology transition model that has pandemics, epidemics, or animal attacks (ex bubonic plague)
stage two-less death,receding pandemics
stage of the epidemiology transition model that has better sanitation and medication
stage three-degenerative disease
stage of the epidemiology transition model that has diseases that gets worse over time, they show up in MDCs because of unhealthy life styles like eating too much junk food (ex cancer)
stage four-fighting degenerative disease
stage of the epidemiology transition model that has medicational advances that delay degenerative diseases and increase life expectancies (ex injecting insulin in ur body when u have diabetes)
stage five-reemergence of degenerative disease
stage of the epidemiology transition model that has diseases that have become resistant to antibiotics so diseases come back
thomas malthus
father of demography, first one to address the world overpopulation problem
population-food graph
the gap between population number and the number of food available, this graph claimed that the population was growing much more rapidly than the earths food supply (exceeds carrying capacity)
j curve
the shape created by the line in the population-food graph
linear/arithmetic growth
agriculture increases in an uniform amount during equal time periods
exponential/geometric growth
population increases exponentially/are compounded on top of one another
malthusian catastrophe
the part in malthusian theory when the population eventually overtakes the means to produce food
reasons why malthusian theory was wrong
green evolution, technology, possiblism
ester boserup
the person who countered malthus, said that farmers can respond to consumption
buserup theory
the theory that countered malthusian theory, said that an increase in population will simply stimulate scientists to come up with ideas to increase food production (this was proven true with the green revolution)
s curve
the curve shown when the population doesn’t exceed the carrying capacity
neo malthusians
beleives that malthus was right about some things, they focus on the damage done to the environment bc of overpopulation specifically damage done by wealthy countries
malthusian theory
theory that says that the worlds supply of resources has a fixed and is not expanding so overpopulation will cause all the resources to be gone
criticisms of malthusian theory
the theory assumes that the supply of resources cannot adapt to the growing population/disregards the theory of possiblism
population policy
government policy that controls the growth/decline of birth rates by making laws that impact fertility rates
antinatal policies
government try’s to control population growth (restrictive policies) (ex legalize abortion/sterilization/contraception incentives to have less kids or raising the marriage age)
pronatal policies
government try’s to expand/encourage population growth (expansive policies)(ex banning abortion/sterilization/contraception incentives to have more kids or lowering the marriage age)
gendercide
deliberate killing of people (usually females) on account of gender by infantcide or selective abortion
eugenics
study of how to arrange reproduction within a human population to increase occurrence of heritable traits that are regarded as desirable
chinas one child policy
this policy was made in 1982 and it was introduced to stop the overpopulation/starvation in a specific country through birth control/IUDs/abortions, it only allowed one child per family
india
the first country to develop antinatalist policies
eugenic policies
in order to create “super humans” policies were made to encourage some people to breed and others to be sterilized sometimes forcibly (ex nazi germany japan india)
migration
a change in residence that has some degree of permanence
mobility
ability to move from one place to another
net migration
difference between the number of immigrants and the number of emigrants
cyclic movement
a type of movement that has a closed route (ex home to school, school to home everyday)
periodic movement
a type of movement where someone moves for a longer period of time but not permanent (ex going to college for four years)
transhumance
moving livestock to pastures based on the seasons
international migration
movement across country borders that imply a degree of permanence
internal migration
movement within a single country that imply a degree of permanence
voluntary migration
human migration flows in which the movers respond to perceived opportunities (distance decay weighs into this because people tend to move closer to where they already are)
forced migration
human migration flows in which the movers have no choice but to relocate (ex atlantic slave trade or war)
economic factors
unemployment taxes goods/services
social factors
discrimination healthcare education public services religion
political factors
corruption within government lack of stability discrimination freedom policies made
environmental factors
amount of arable land water pollution disasters
refugee
person who is forced to leave their home to escape war/persecution/disasters
asylum seekers
someone seeking protection (not every [this term] is seen as a refugee but all refugees are seen as [this term])
internally displaced person (IDP)
someone who leaves their home bc of war/disasters/persecution but they stay within the country
transnational migration
someone moves to another country but stays connected to their home country
chain migration
people live in a certain country and they may call other family/friends to come to that country as well
step migration
migration happens in stages (ex farm to town to city)
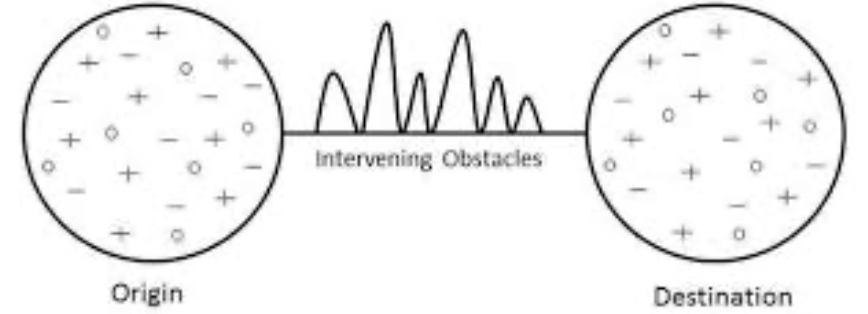
intervening obstacles
negative situation/events that stops migrants from reaching their final destination
intervening opportunities
positive situation/events that stops migrants from reaching their final destination
intraregional migration
permanent move within the same region
interregional migration
permanent move from one region of a country to another
xenophobia
a strong dislike of people who practice another culture
quotas
limits the number of immigrants from each region into a country
selective immigration
countries use this to bar people with certain backgrounds from entering
brain drain
a large scale emigration of talented people
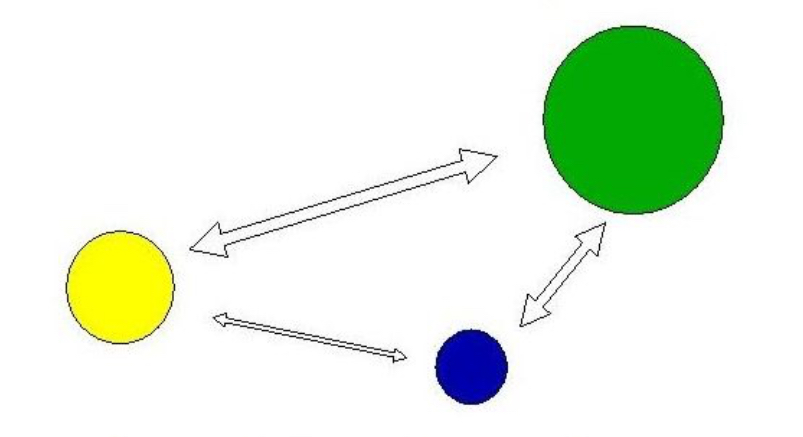
gravity model
model that is based upon the idea that if the importance of one/both location is higher there will be higher movement between them (connected to distance decay)
lees model of migration
model that shows the idea that intervening obstacles can block migration to places while push/pull factors promote migration
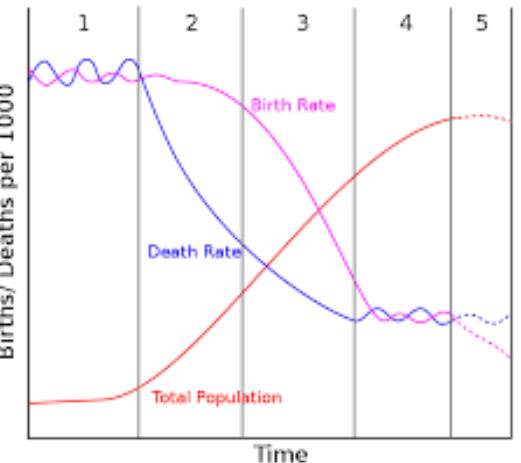
demographic transition model
model used to show population transition within countries