Other Tests of Pulmonary Mechanics
1/51
There's no tags or description
Looks like no tags are added yet.
Name | Mastery | Learn | Test | Matching | Spaced | Call with Kai |
|---|
No analytics yet
Send a link to your students to track their progress
52 Terms
Airway Resistance (Raw)
Pressure change per unit flow as gas flows into and out of lungs
measure in cmH2O /L / sec
Raw=\frac{Pressure}{Flow}
Raw influenced by
size of airway
number of airways
elastic recoil
the lung volume at which it is measured
sRaw: specific airways resistance
sRaw = Raw x VTG ( resistance at VTG)
sRaw is stable across changing lung volumes
Raw during insp
during quiet breathing most of the resistance is in the trachea and large airways
during inspiration intrathoracic airways increase in diameter and resistance decreases
The opposite happens on exhalation
Resistance is distributed as follow
nose, mouth, and upper airways = 50%
Trachea and bronchi = 30%
small airways = 20% (<2 mm in dia)
Airway Conductance (Gaw)
Conductance is the reciprocal of airway resistance ( 1/Raw)
flow generated per unit of pressure drop across the airways
Measure in L/sec/CmH2O
sGaw=\frac{Gaw}{VTG}
NOTES: may see increase in sGaw as an indication for positive response response to bronchodilator even if there’s no obvious improvement FEV1. Therefore, very good objective test for bronchodilator test for bronchodilator response testing
Produce
place patient in body box if doing an VTG, close door
Ask patient to perform normal tidal breathing
Once rhythmic, ask patient to pant with small VT rate 1.5 - 2.5Hz… Prove graphic plot V/PBox
once plot is complete, close shutter and ask patient to continue panitng against the losed shutter at rate of ~1.0 Hz.
If performing sRaw or SGaw, then will need to make sure FRC is calculated from each of the tests and sGaw is calculated with values from the same test
Report the mean of 3, or more, acceptable tests (test should be within 10%).
Interpretation of results
good tests?
are individual Raw and sGaw values within 10%?
if Raw > 2.4 cmH2O/L/sec & / or Gaw < 0.15L/ sec /cmH2O/L suspect OBSTRUCTION
distinguish large verus small airway obstruction by correlasting with other spirometry finding.
Resistance Measurement via FOT
Forced Oscillation Technique
Useful method to measure airway resistance in patients unable to perform spirometry or a panting maneuver
the patient only require to perform quiet breathing throughout the test
what is FOT
technique applies oscillating gas flow, at wide range of frequencies (5 -35hz) to the respiratory system
Oscillations are create by built-in loudspeaker or vibrating mesh
Resulting pressure from oscillating flow is measured at the mouth
complex magthematchicals operations are performed to calculate the resistance of the re
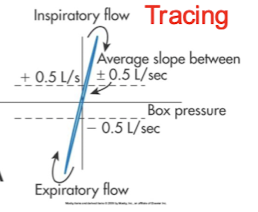
what type of tracing is this
Normal tracing
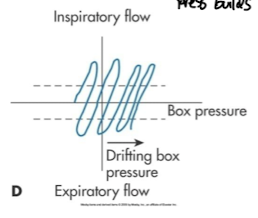
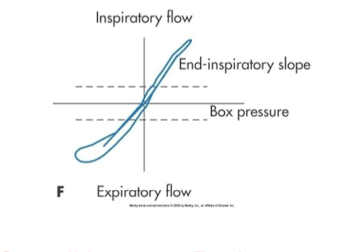
what type of tracing is this
Thermal drift
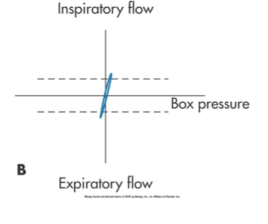
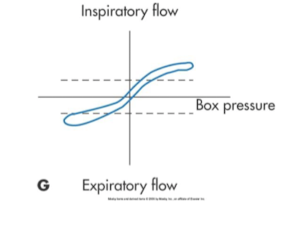
what type is this
Panting too fast with small volumes
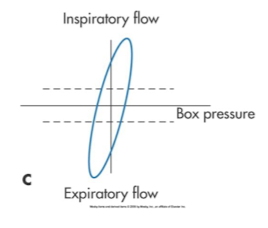
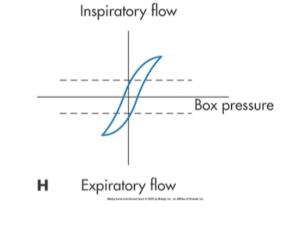
what type is this
slow panting or large volumes
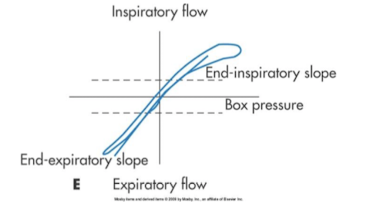
is this high inspiratory resistance or low
high
high or low expiratory resistanace
High exp resistance
which type fo dx tracing
HIgh inspiratory & expiratory resistance
what is this tracing
Overall increase resistance asthma
FOT procedure
describe the procedure to the patient
have the patient breathe normally for 30-60s
neck should be slightly extended
hands should be placed on patient’s checks
report the mean of at least 3 acceptable test
adult tests be within 10% mean
peds tests should be within 15% of mean
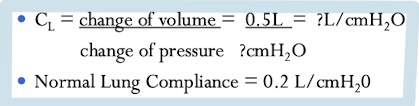
compliance (CL)
volume change per unit of pressure change for the lung, the thorax or the lung thorax together
measurement of elastic resistance (elastane or elastic recoil)
elastic recoil pressure of the lungs = transpulomnary pressure (Ptp)
other major factor determining maximal airflow (elastic recoil)
measures in L/cmH2O
Lung compliance (CL)
amount of transpulmonary pressure change required to produce a change lung volume
static lung compliance measurements can be mdae in the plethysmorgraph
this is not commonly performed test
Ptp = PA - PPL
Technique
patient inhales to TLC and then exhales exhales to stabilized lung compliance
inhale again to TLC and then slowly exhales to FRC
shutter closes during exhalation at various points for 1 to 2s (zero flow)
during shutter closure pressure and volume change are measured
data is plotted on volume/pressure curve
values from calculation are taken at FRC and at +0.5L above FRC
CL formula
decrease compliance
kyphoscoliosis
rheumatoid spondylitis
severe obesity
increase compliance
obstructing lung disease.. ex emphysema, bronchiolitis obliterans
Review: distribution of tidal ventilation
breathing from FRC
At FRC, most gas are the Apices
with tidal breathing, most gases preferentially ventilate the bases
When breathing TLC
alveoli in the apices and bases are about the same size they are are fully open
when breathing at RV
airways at the bases are compressed and closure occurs
When breath is inhaled from RV the air will preferentially go to the apices first as teh based are closed
single breath nitrogen wash washout is AKA
Fowler’s test
Single breath nitrogen washout
measure the distribution of ventilation
helps explain abnormal GE in patient with normal PFT’s
may detect small airway disease
use similar equipment as those used for the Open circuit Nitrogen washout FRC test
technique of single breath
have patient exhale to RV
then place patient onto the system and instruct patient to inspire a VC breath of 100% oxygen to TLC
immediately ask patient to exhale slowly and evenly at 0,3 - 0.5 L/sec back to RV (*MAKE SURE PATIENT DOESN’T DO A BREATH HOLD BEFORE EXHALING)
technical ntoes
N2 conc. is measured by an N2 analyzer
exhale volume measured by a spirometer
volume expired is plotted against N2 conc. on a graph
Acceptability Criteria
inspired and expired VC within 5% or 200ml
VC from SBN2 within 200 ml or 5% of VC from spirometry
expiratory flow between 0.3 - 0.5L/sec
washout tracing shows minimal cardiac oscillations
interpretation and significance
evenness of distribution is assess by 2 parameters
% change of N2 between 750ml – 1250 ml (∆
%N2 750-1250)
1.5% or less in healthy young adults up to 3.0% for older adults
ncreased = uneven distribution of gas on inspiration or emptying rates on exhalation. May be > 10% in emphysematous patients.
Slope of Phase III of the washout curve (best fit line from point where 30% VC remains above RV to the onset of phase IV)
0.5% - 1.0%, with wide variability depending on lung
volumes
Accuracy of this phase is affected if the expiratory flow is too slow which causes oscillation in the tracing
patient with small VC may also not exhale enough gas to make phase III meaningful
slope steeper with poor distribution of ventilation
What else is measured with SBN2
Closing volume (CV) = the part of then vital capacity that can be exhaled from the lungs after lower airway closure (beginning of phase IV to RV)
Can also measure closing capacity(CC) the sum of CV and RV
Significance of SBN2 measurements
∆%N2 750-1250 < 1.5% in healthy, ~3% in elderly, in severe emphysema may be > 10%
Slope of Phase III = 0.5 – 1.0% N2/L, with wide variability.
Onset of Phase IV = beginning of airway closure (Normal = 80 -90% of VC), therefore, normal CC ~30% TLC
CV/VC% > 20% = suspect small airway abnormalities, but must correlate this with clinical findings
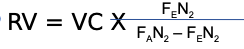
Calculating RV from from SBN2 test
FEN2 = mean expired N2 conc. determined by integration of
the area under the curve
FAN2 = N2 conc. in the lungs at the beginning of inspiration,
~0.75-0.79
FRC or Thoracic Gas Volume
An indirectly measured value
Varies with body size, position, and time of day
Increase represents air-trapping
Decrease typically seen in restrictive diseases
RV
a calculated value
FRC - ERV
increase in obstructive disease states, air trapping
RV and FRC usually increase together
TLC
calculated value TLC = RV + VC OR TLC = FRC + IC
decrease in restrictive diseases
may increase in obstructive diseases called hyperinflation
RV?TLC ratio (RV/TLC%)
normal 20 -30%
increase RV/TLC ratio and increased TLC indicates hyperinflation
increase RV/TLC ratio and normal TLC indicated air trapping
Diffusion
occurs between the alveoli and the pulmonary capillary blood
oxygen and carbon dioxide pas through two barriers; A/C membrane and the blood plasa-red blood cell barrier
diffusion across these membranes depends on the pressure gradients
diffusion
Rate of diffusion is affect by
surface area
distance the gas molecules must travel
solubility coefficient of the gases
partial pressure gradient
density of the gas
why do diffusion capacity test?
measures the ability of the lungs to transfer gas fro the alveoli to pulmonary capillary bed
also referred to as “gas transfer factor”
diffusion capacity
measure the gas transfer factor, you need a gas that can:
diffuse across the AC membrane
able to bind with Hb
CO meet both these criteria
Diffusion Capacity
rate diffusion of CO form the alveoli to the Hb
CO diffusing capacity
4 steps occur during diffusion of CO
diffusion across the AC membrane
transfer to the RBC
passage through the RBC membrane
CO and Hb combining
SIngle breath Diffusion
Test gas used is CO (.3%) and an inert gas such as
Helium(10%) , Ne or CH4, oxygen(21%) and
nitrogen(balance)
CO is the diffusing gas
The inert gas is a tracer gas, used for calculating VA (STPD)
Tracer gas used depends on type of gas analyzer used
Single Breath DLCO technique patient preparation
No smoking on day of test, note time of last cigarette
No alcohol on day of test
3. No exercise immediately before, seated for 5 minutes prior to test
4. No O2 for 10 minutes prior to test, if tolerated
5. Careful instruction and demonstration
Procedure/technique
1. Establish normal breathing pattern, then ask pt, to exhale to RV within 6 seconds
2. Once at RV, ask pt. to rapidly inhale to TLC (should be within 4 seconds), inspired volume (VI) ≥ 85% of VC
3. Once at TLC, ask pt. to hold breath for 8 – 12 seconds (make sure pt. doesn’t do a Valsalva or Muller maneuver); breath hold technique most used is known as the Jones-Meade
4. Discard the VD washout volume of 0.75 – 1.0 L (0.5 if VC < 2.0 L); washout should be < 4 seconds
5. Collect 0.5 – 1.0 L of alveolar sample (less if VC < 1.0 L), collected in 3 seconds
4 min. should elapse between tests
Breath hold technique most used is known as
Jones-Meade
Acceptability Criteria
1. Normal breaths prior to exhaling to RV, within 6 seconds
2. Rapid inspiration to TLC from RV, < 4 seconds
3. Volume inspired >85% of VC
4. Relaxed breath hold for 8 – 12 seconds
5. Rapid exhalation but not forced, 4 or less seconds
6. Dead space washout 0.75 – 1.0 L, 0.5 if VC< 2.0L
7. Alveolar volume 0.5 – 1.0L (< 0.5 L if VC <1.0 L), collected in < 3 seconds
8. 4 minutes between tests
Factors Affecting DLCO
Hb & Hct ( increased Hb or Hct → increase
DLCO ~7%/g)
COHb% (increased COHb -decreased DLCO ~1%/1% COHb)
Pulmonary Capillary Blood Volume (increase -
increase DLCO)
Changes in body position (supine - increased
DLCO)
Alveolar volume (decrease - decreased DLCO)
Age and sex (DLCO decreases with increased
age, higher in males)
Altitude above sea level(direct relationship,
increasing DLCO
When pulmonary capillary blood volume increases
Exercise, left heart failure, supine position
Polycythemia
Pulmonary hemorrhage
Decreasing DLCO examples
Emphysema
Pulmonary fibrosis, sarcoidosis, asbestosis
Pulmonary embolism, pulmonary hypertension
Anemia, cigarette smoking