AP Psychology - Unit 0: An Introduction to Psychological Science Practices
1/56
There's no tags or description
Looks like no tags are added yet.
Name | Mastery | Learn | Test | Matching | Spaced | Call with Kai |
|---|
No analytics yet
Send a link to your students to track their progress
57 Terms
Behavioral Approach
The focus on learned behaviors through rewards and punishments; it’s concerned with how these behaviors are learned and reinforced.
Ex: A student begins doing their homework more consistently because the teacher gives them a sticker if they do.
Psychodynamic Approach
A perspective emphasizing the role of the unconscious mind, early childhood experiences, and interpersonal relationships to explain human behavior.
Ex: Jose has been suspended from school for fighting. His psychologist learns that his father left him when he was a young child. He thinks that Jose’s fighting is the result of unconscious anger over his Dad’s abandonment, which he still hasn’t come to terms with.
Humanistic Approach
A perspective that emphasizes the role of motivation on thoughts and behavior; free will, self esteem, and potential for growth guide behavior.
Ex: A teacher encourages students to set personal goals rather than focusing on punishment.
Biological Approach
A theory that explains that behaviors and mental processes are influenced by differences and changes in nervous system functioning; neurotransmitters, hormones, the brain, and genes all play a role.
Ex: Depression can be caused by genetic history in families.
Cognitive Approach
The focus on mental processes such as memory, thinking, problem solving, language, and decision-making.
Ex: Anna has unrealistic beliefs about her role as a student. She thinks anything but straight A’s means she is a failure in the eyes of her family. This leads to anxiety.
Sociocultural Approach
A perspective that explains that behaviors and mental processes are influenced by ethnicity, religion, gender, language, nationality, and economic status, and the learned norms associated with these groups.
Ex: Sally talks very loudly in school, and some students are bothered by it. But in Sally’s family culture, that’s how they communicate and express themselves.
Evolutionary Approach
A perspective that explains behaviors and mental processes are present in humans today because they were naturally selected for creating a reproductive or survival advantage for species.
Ex: Fear of heights to prevent death.
Scientific Method
A way of describing behavior using naturalistic observations, case studies, and surveys.
Observation
Defining a problem
Proposing a hypothesis
Designing a study and gathering evidence to test the hypothesis
Analyzing the data and reaching a conclusion
Sharing findings with a scientific community
Quantitative Research
To test hypotheses under rigorous conditions, fueled by empirical, numerical data, or statistics that are measurable.
Ex: Survey research, such as online polls.
Qualitative Research
Research that relies on in-depth, narrative analysis that can’t be translated into numerical data.
Ex: Asking someone to describe what it was like being in love, though it’s a feeling that can’t be described.
Control Group
The group that isn’t subjected to any manipulation of the independent variable.
Ex: Receives the decaffeinated coffee in an experiment testing the energy of students with and without caffeine.
Experimental Group
The group that receives the manipulation of the independent variable.
Ex: Receives the caffeinated coffee in an experiment testing the energy of students with and without caffeine.
Placebo Group
A control group in a research study that receives an inactive treatment.
Ex: Receiving a sugar pill rather than a pill with actual effects.
Operational Definitions
Describes exactly what the variables are and how they are measured within the context of your study.
Ex: If you were doing a study on the impact of sleep deprivation on driving performance, you would need to define what you mean by sleep deprivation and driving performance.
Independent Variable
The variable that’s actively manipulated by researchers.
Ex: The amount of sleep that participants receive in an experiment testing the result hours of sleep has on exam scores.
Dependent Variable
The variable that is measured to see how it has been affected or changed by the manipulations of the independent variable.
Ex: The scores themselves in an experiment testing the result hours of sleep have on exam scores.
Confounding Variables
An external factor in an experiment that affects both the independent and dependent variables. It can introduce error or bias, making it difficult to determine if the observed effects are solely due to the independent variable.
Ex: A study that aims to determine the effect of studying hours on exam scores may not take into account the participants’ previous knowledge on the subject, which would serve as the confounding variable.
Hypothesis
Testable predictions produced by theories.
Ex: If we give caffeine to college students, then they will pay more attention in class.
Null Hypothesis
The assumption that no difference exists between groups.
Ex: Thinking that there isn’t a difference in the average math test scores between students who listen to loud music and those who don’t.
Experimenter Bias
When researchers may unintentionally influence results to confirm their own beliefs.
Ex: A horse named Clever Hans in the early 1900s, where it appeared to perform arithmetic by tapping its hoof but was actually responding to subtle visual and facial cues from its owner, who was unconsciously guiding the answers.
Single Blind Study
When the participants are uninformed about what treatment, if any, they are receiving.
Ex: A taste test where participants randomly receive either a new brand of soda or a known brand, but they’re unaware of which soda they’re drinking, while the researchers are aware.
Double Blind Study
When neither the participants nor those who administer the drug and collect the data will know which group is receiving the treatment.
Representative Sample
A sample that is carefully chosen so that characteristics of the participants proportionally match the larger population.
Ex: A group of 100 students, randomly selected from a university, that accurately mirrors the university’s overall demographics in terms of major, year in school, gender, and race or ethnicity.
Random Sample
A sample selected in which every member of the target population has an equal chance of being selected.
Ex: Selecting participants by putting the names of everyone in the target population into a hat and drawing names to form a sample.
Replication
When others replicate the original observations with different participants, materials, and circumstances.
Ex: When a team shows a new teaching method improves reading comprehension, and is later repeated by another research team under the same conditions to see if they achieve the same results.
Naturalistic Observation
A descriptive technique of observing and recording behavior in naturally occurring situations without trying to manipulate the situation.
It’s noninvasive and allows subjects to demonstrate honest behavior, but can be time consuming and has the potential for the subject to become aware of the observer and act differently.
Ex: Jane Goodall
Case Studies
An observation technique in which one person is studied in the hopes of revealing universal principles.
It provides in-depth information and illustrates general principles that can be applied to others, but can be misleading or can over-generalize the results.
Ex: Phineas Gage
Survey Methodology
A technique used to obtain self-reported attitudes and behaviors of a particular group, usually through questioning.
Collects a large amount of data in a short time and inexpensive, but could be given false information or contain poor survey questions.
Ex: Taking surveys in Wildcat for things such as Homecoming.
Correlational Research
Finding the existence of a consistent, systematic relationship between 2 events, measures, or variables.
It allows for predictions and identifies relationships, but can’t determine the cause or why the variables are related.
Ex: As ice cream consumption increases, the crime rate increases.
Descriptive Stats
“Plain vanilla” statistics used simply to explain data in a descriptive, meaningful, informational way.
Ex: Reporting the mean score of AP Psychology students on a test.
Inferential Stats
Statistics used to infer causes, draw conclusions, and make decisions for an entire population. They’re based upon data gathered with representative sampling, and then put through statistical tests, which results in statistical inferences.
Ex: Using a small, randomly selected sample of students to make a general conclusion about all students’ study habits.
Statistical Significance
The degree to which you’re sure that the dependent variable was a result of exposure to the independent variable.
Ex: How sure are you that the symptoms of depression are going to lessen when you take your new antidepressant drug?
Correlation vs. Causation
Just because variables trend together in a predictable way, it doesn’t indicate a cause and effect relationship.
Ex: There is a correlation between ice cream sales and instances of violent crime, but that doesn’t mean ice cream turns people into criminals.
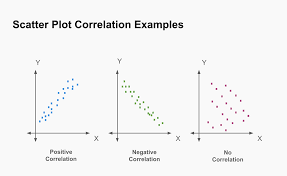
Positive Correlation
If there is a positive correlation, the variables trend in the same direction. Increases in one variable are matched by increases in the other variable.
Ex: +0.8 - the more you study, the higher your grade.
Negative Correlation
The variables trend in opposite directions. Increases in one variable are matched by decreases in the other variable.
Ex: -0.4 - the more absences you have, the lower your grade.
Zero Correlation
When there is no relationship between the variables.
Ex: 0 - the relationship between a person’s height and their favorite color.
Variation
How similar or diverse scores are.
Ex: A basketball player scored between 13 and 17 points in each of the season’s first 10 games. Knowing this, we would be more confident that she would score near 15 points in her next game than if her scores had varied from 5 to 25 points.
Correlation Coefficients
Statistic ranging from -1.00 to +1.00; the sign indicates the direction of the relationship. The closer the statistic is to -1.00 or +1.00, the stronger the relationship.
Ex: A statistic of +0.2 indicates a weaker relationship than one of a statistic of +0.9.
Range
The simplest measure of variation. The difference between the largest and smallest measurements.
Ex: If the highest score on a test is 95% and the lowest if 30%, the range is 65.
Scatterplots
Often used to chart data gathered from correlational research.
Normal Curve
The bell-shaped distribution that’s formed by large numbers of data.
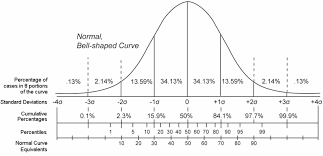
Percentiles
The percentage of scores that are less than a given score.
Ex: If you’re in the 79th percentile in a math competition, your score is 79% higher than your peers.
Standard Deviation
In a single number, it tells us how much the data is dispersed away from the mean.
Ex: Using the bell curve, there’s a standard deviation of 15.
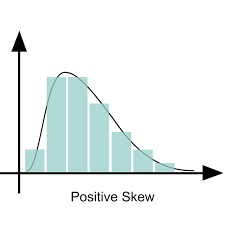
Positive Skews
A distribution of scores that has a long tail extending to the right, indicating a few high-scoring outliers.
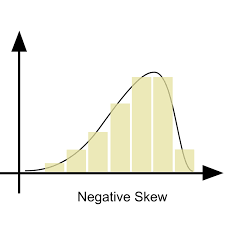
Negative Skews
A data distribution where most scores are high, with only a few low scores pulling the mean to the left, resulting in a distribution with a long “tail” on the left side of the graph.
Mean
The mathematical average of a distribution.
Ex: Calculating the average score on a test by finding the sum of all scores and dividing by the total number of students.
Median
The middle score in a statistical distribution. Exactly half of the scores are above, and half are below.
Ex: If a group’s test scores are 70, 80, 85, 88, and 90, the median would be 85.
Mode
The most frequently occurring score in a statistical distribution.
Ex: If student scores on a test are 70, 85, 85, 85, 90, and 92, the mode would be 85.
Hawthorne Effect
When people know that they’re being observed, they change their behavior to what they think the observer expects or to make themselves look good.
Ex: Changing driving habits when being monitored by police.
Meta Analysis
A statistical procedure that analyzes the results of multiple studies to reach an overall conclusion.
Ex: If many small studies explored whether exercise reduces depression, a meta-analysis would pool their data to get a single, more reliable measure of exercise’s anti-depressant effect.
Effect Size
The strength of the relationship between two variables. The larger the effect size, the more one variable can be explained by another.
Ex: Using effect size value to show whether therapy has had a small, medium, or large effect on depression.
Ethical Guidelines: Human Research
Informed Consent
Confidentiality
Deception
Debriefing
Protection from Harm
Ethical Guidelines: Animal Research
Knowledge must be gained.
The smallest possible number of animals should be used.
Naturalistic studies with little disturbance is preferred.
Animals must be well-cared for.
All procedures causing discomfort or pain should be assessed relative to the particular species.
Experimenters must be familiar with the technical aspects of anesthesia, pharmacological compounds, and so on.
Hindsight Bias
The tendency to believe, after learning the outcome, that one would have forseen it.
Ex: Saying “I should’ve known that” after getting a question wrong.
Overconfidence
The tendency to overestimate your knowledge and/or ability.
Ex: Being overly confident on a test and believing that you don’t need to study, which later results in getting a bad grade.
Gambler’s Fallacy
The tendency to overestimate the occurrence of patterns in random data.
Ex: Thinking that if a coin lands on heads ten times in a row, it’s due to land on tails the next flip.
Illusory Correlation
The tendency to believe that variables have a relationship where none exists.
Ex: Superstitions