P4 PIE CHARTS
1/14
There's no tags or description
Looks like no tags are added yet.
Name | Mastery | Learn | Test | Matching | Spaced | Call with Kai |
|---|
No analytics yet
Send a link to your students to track their progress
15 Terms

Based on the sales data in the pie chart, which item sold the most?
Hotdog

Based on the sales data in the pie chart, which item sold the least?
Sandwich

Based on the sales data in the pie chart, how many customers bought pizza?
13

Based on the sales data in the pie chart, how many customers bought burger?
25

Based on the sales data in the pie chart, how many customers bought fried chicken?
20
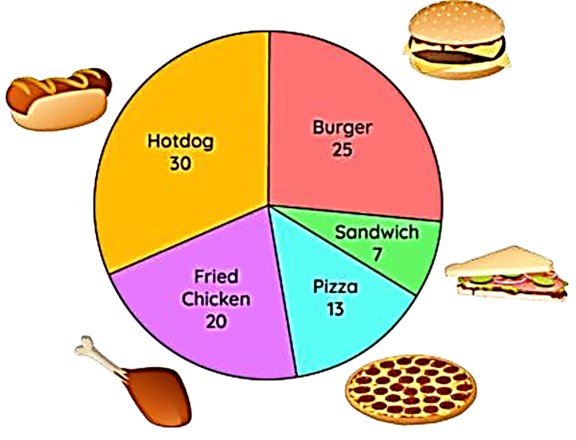
Based on the sales data in the pie chart, what was the total number of customers who bought items at the restaurant?
95
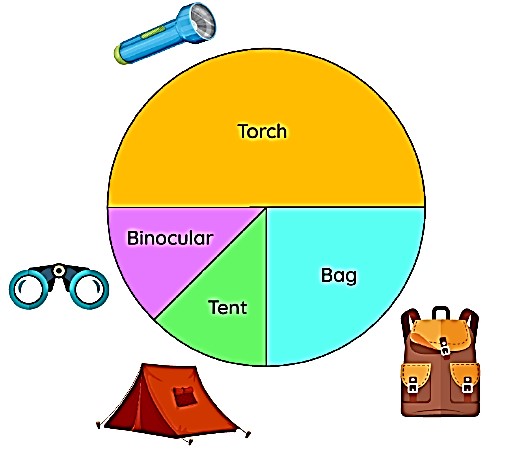
Based on the sales data in the pie chart, which item sold the most?
Torch

Based on the sales data in the pie chart, which item represents one quarter of the sales?
Bag

Based on the sales data in the pie chart, did the store sell tents less than binoculars? (Yes or No)
No
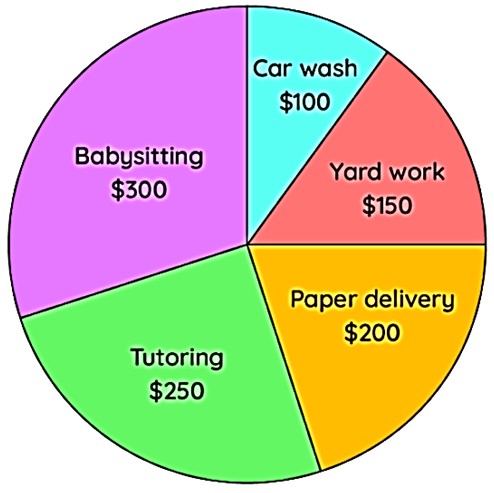
Based on the weekly job salary data in the pie chart, which job pays the most?
Babysitting

Based on the weekly job salary data in the pie chart, which job pays the least?
Car wash

Based on the weekly job salary data in the pie chart, which job pays twice as much as yard work?
Babysitting
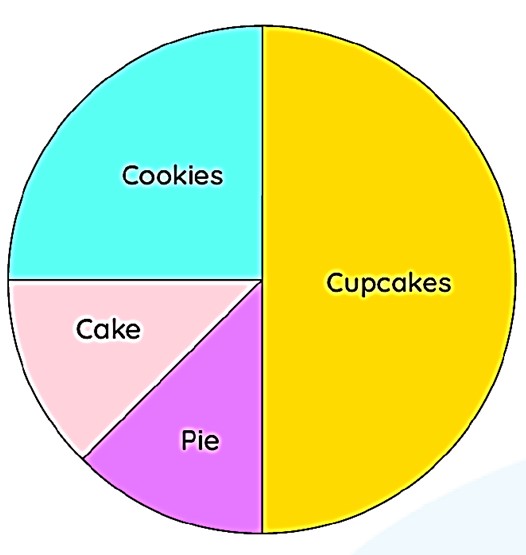
Based on the bakery sales data in the pie chart, which item was sold the most?
Cupcakes

Based on the bakery sales data in the pie chart, what fraction of the sales were cupcakes?
(½ or ¼)
½

Based on the bakery sales data in the pie chart, what fraction of the sales were cookies?
(½ or ¼)
¼