KNN Classifiers
1/34
There's no tags or description
Looks like no tags are added yet.
Name | Mastery | Learn | Test | Matching | Spaced | Call with Kai |
|---|
No study sessions yet.
35 Terms
what is data imbalance?
imbalanced calssification is the problem of classification when there is an unequal distribution of classes in the training set
Classification problems are sensitive to class imbalance
majority class = most observations (may favor)
minority class = least amount of observations
Norma;:300 Diabetes: 250
What are the classification metrics listed?
Accuracy
Precision
Recall
F1 Score
What is the accuracy classification metric?
Accuracy: Measures the total number of correct predictions
ACCURACY DOES NOT PENALIZE INCORRECT PREDICTIONS
Accuracy = Correct Predictions (TP+TN) / (TP+FP+TN+FN_
What is the classification metric precision?
Precisions is a measure of the total predicted positive compared to all psotitives
TP / TP + FP
TP / TP + FN (postives / all positives-right/wrong)
What is the classification metric recall?
Recall is a measurement of true positives compared to model predictions
TP / TP + FN (postives / all actual positives)
What is the classification metric F1 Score?
F1 Score- combines Precision and Recall- mean between
2 Precision * Recall / Precisions + Recall
What are the three sampling techniques?
Oversampling: Duplicating values in the minority class to match the majority class
increasing size of minority class to match majority
Undersampling: reducing the majority class to match minority class
reducing majority class to match minority
Synthetic minority oversampling techniques: SMOTE: creates data points in the data similar to points in the minority class
Oversampling but creating data points from the minority class to add back into the minority class
Whats the difference between classification models and MLR models?
What are the classification models?
Classification models predict a class of membership instead of a continous numerical value
Binary Classification: 1 class (yes/no)
Multi Class: Multiple classes with exclusive memberships
Multi Label: Multiple calsses that do not have mutually exclusive membership
What are the two things that are a necessity to creating a classification model?
data features
corresponding labels
Predicting a classes based off given features
Overarching idea of K Nearest Neighbors
determining the most likely class based off closest neighbors
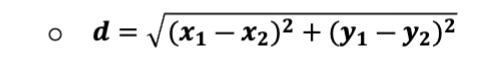
What do you use to determine distance from neighbors?
What is the value of K?
K : the number of nearest neighbors to determine the class of membership
What factors have an impact on the class that is determined?
The class with the closest and the largest number of neighbors will determine the model’s classification
The majority class is the one with the most observations
minority class is the one with the fewest observators
features need to be on a continous numerical scale for KNN and Euclidean distance
IN what scenario does KNN perform poorly and what needs to happen?
Data Nornmalization
dealing with multiple features that use different scale
all data should be normalized on a scale 0 to1
rescale does not change the distribution of the data
what needs to be done to test the model?
data partioning splits the data into training and validation sets
training data is used to create the model
validation data is used to evaluate the models accuracy
SKLearn train_test_split function partioning data
80/20
what are the variables used for data partioning?
Predictors- variables used as predictive values for KNN must be numeric
Cateogorical- must be one hot encoded
Target- dependent variable that is predicted with KNN exclusive class of membership
whats important to remeber about training data
after data partioning only the training data should be used to train the model
when creating the model, the value of K must be specified
What are the metrics described?
Accuracy: number of correct predictions
Precisions: number of positives that actually belong to positives (True / True + False Positive)
Recall: number of positives out of all the actual positives (True / True + False Negatives)
F1 Score: mean between precision and recall
What is plain linear regression?
use of current and past data to predict future data
Regression: using a varaible (dependent) and one or more other variables (independent)
Linear Regression: Given a set of observations, determine the equation of line that can be best used to describe dataset
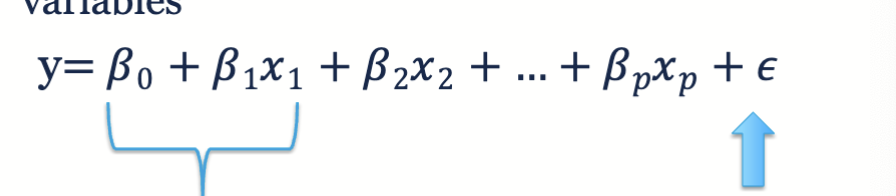
What is the equation for a linear model and the values?
X: independent values (predictor) variables used as predictive values depicted as a value of x (numerical/cateogorical one hot encoded)
Y: dependent values (target)
y = mx + b (slope-m) (intercept-b)
What is exploratory vs predictive modeling?
exploratory: create a model to explain how x and y are related
predictive: can we create a model to predict future values of y and x
Split observations into training set and validation set
training-create
validation-evaluate accuracy
80/20 rule
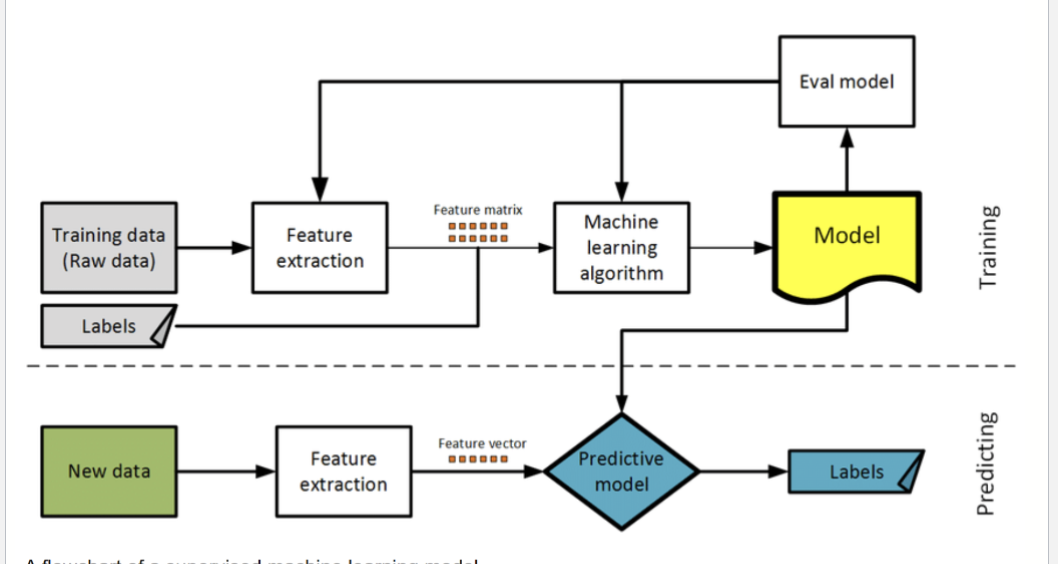
What is the supervised machine learning model?
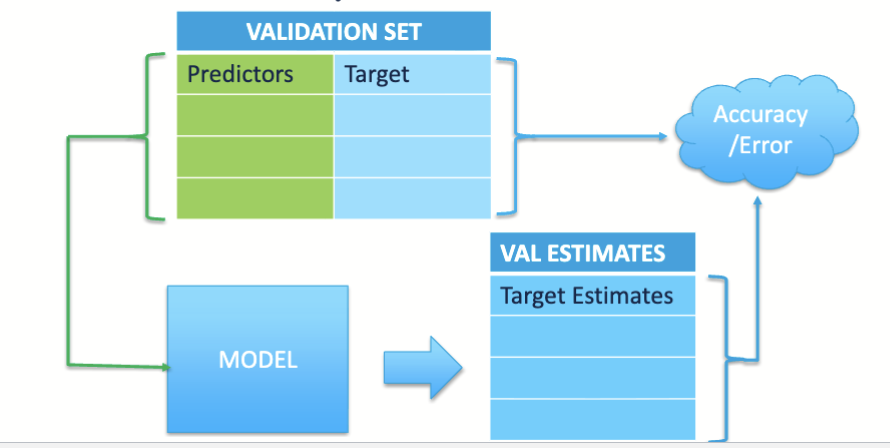
What are key factors in the validation set?
validation set is a subset of data randomly sampled from the original dataset
We use the predictors from the validation set as inputs into a trained model
model produces estimates of the target
orginal validation set has known target values(expected values)
we can compare the target estimates with the known target values to calculate the accuracy or error of the model
What goes into comparing the models accuracy?
the y values from the validation set observations, become the expected values
compare the expected values aganist the values computer from the model
What are the common measurements of error?
Error: absolute of expected - estimated
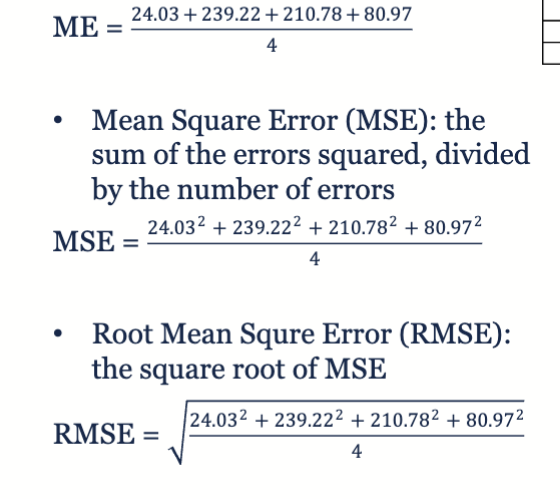
Mean Error: Average of the errors
Mean Square Error: the sum of the errors squared, divided by the number of errors
Root Mean Square Error: square root of the mean squared
What happens when there is more than one independent variable?
multiple linear regression for independent variables
What does fitting a model mean for multiple linear regression?
solving for the best values of the coefficients
solving for n + 1
can compare the predicted y to the actual y to understand accuracy of the model
How do you select the best predictors for the model?
Brute Force Method
Use all the predictors, measure the error
Use a subset of predictors, measure the error
Change the list of predictors, until smallest error
Choose predictors with strongest correlation
What are the steps for using multiple linear regression
Import Libraries
Pandas
Scikit-learn
Import Data
Partition data into training and validation sets
Fit training data to a linear model
Use the model with validation set
Evaluate the model
What are the specific libraries that are needed to be imported
Scikit Learn: data analytics, data science, machine learning
MLR
pandas
train_test_split → sklearn.model_selection
LinearRegression → sklearn.linear_model
Mean_Square_error - sklearn.metrics
What are two things important to remeber when importing data?
data in the columns should be numeric
Predictors are assumed to be independent of each other
What is the third step detailed of spliting the data into training and validation sets?
Create a variable list of predictors. Predictors = []
List of predictors, creating a new dataframe of our X values
Target =. [list names]
Use train_test_split creating training and validation sets
test_size = .2
random_state = 1
How do you fit a model and how do you predict?
df.fit(training x, training y)
df.predictor(list of x values)
How do you evaluate the model?
Use X values from validation set
Compare to the Y values in Validation set
Mean Error
Mean Square Error
Root Mean Square Error
What is R2?
How well the model is fit to the data
how much variation in target Y can be explained by predictors X
1.0 = all variations can be explained (better to 1, the model is better fit for the data)
dfname.score(validation_x, validation_y)
78% of y can be explained by the predictors used to train the model
What is pandas slicing?
Selecting a subset of data
Can use ‘loc’ with a boolean mask
age_df = df.loc[df[‘Age]>20