inferential statistics
1/52
There's no tags or description
Looks like no tags are added yet.
Name | Mastery | Learn | Test | Matching | Spaced |
|---|
No study sessions yet.
53 Terms
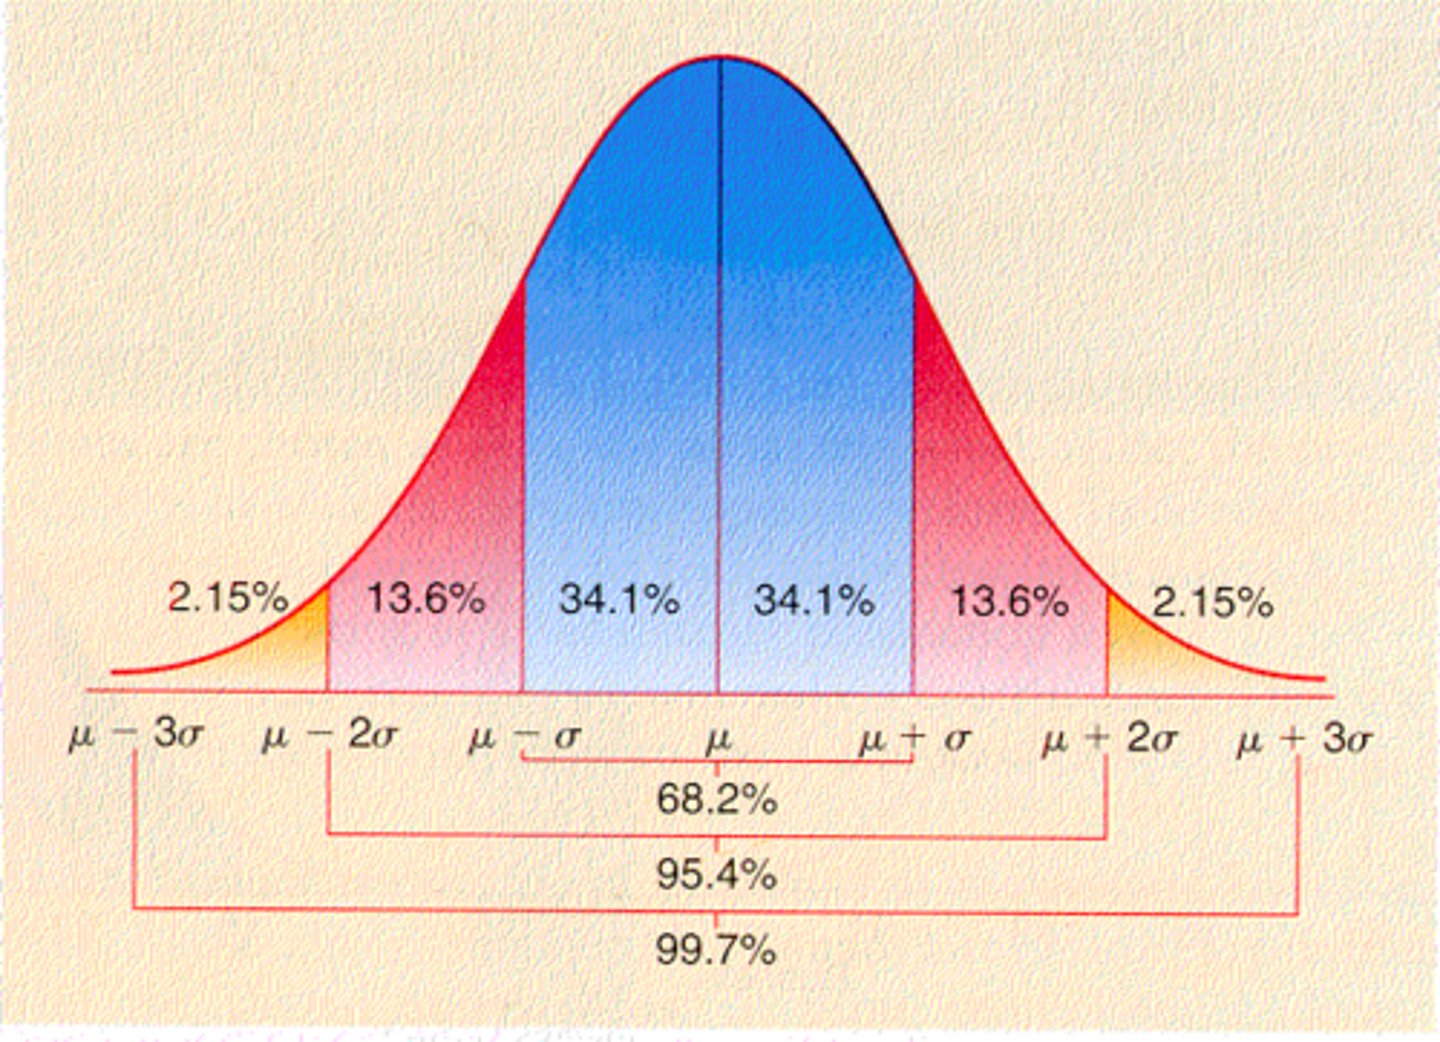
normal distribution
From the sample distribution, we can estimate a theoretical distribution to reflect the population distribution, bell curve
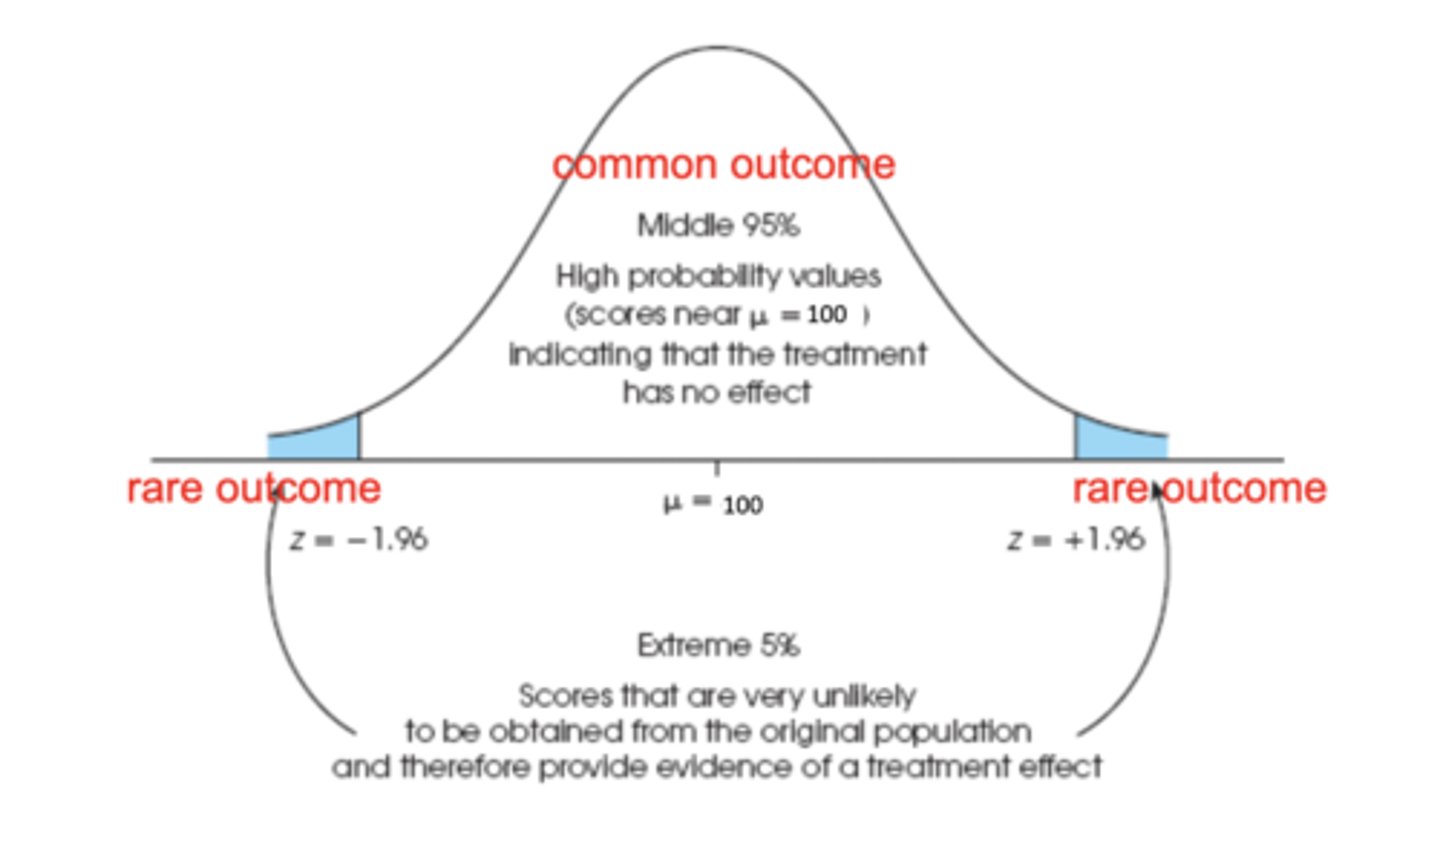
standard normal distribution
A normal distribution with a mean of 0 and a standard deviation of 1; a normal distribution that has been standardised (transforming each score into a "Z-score")
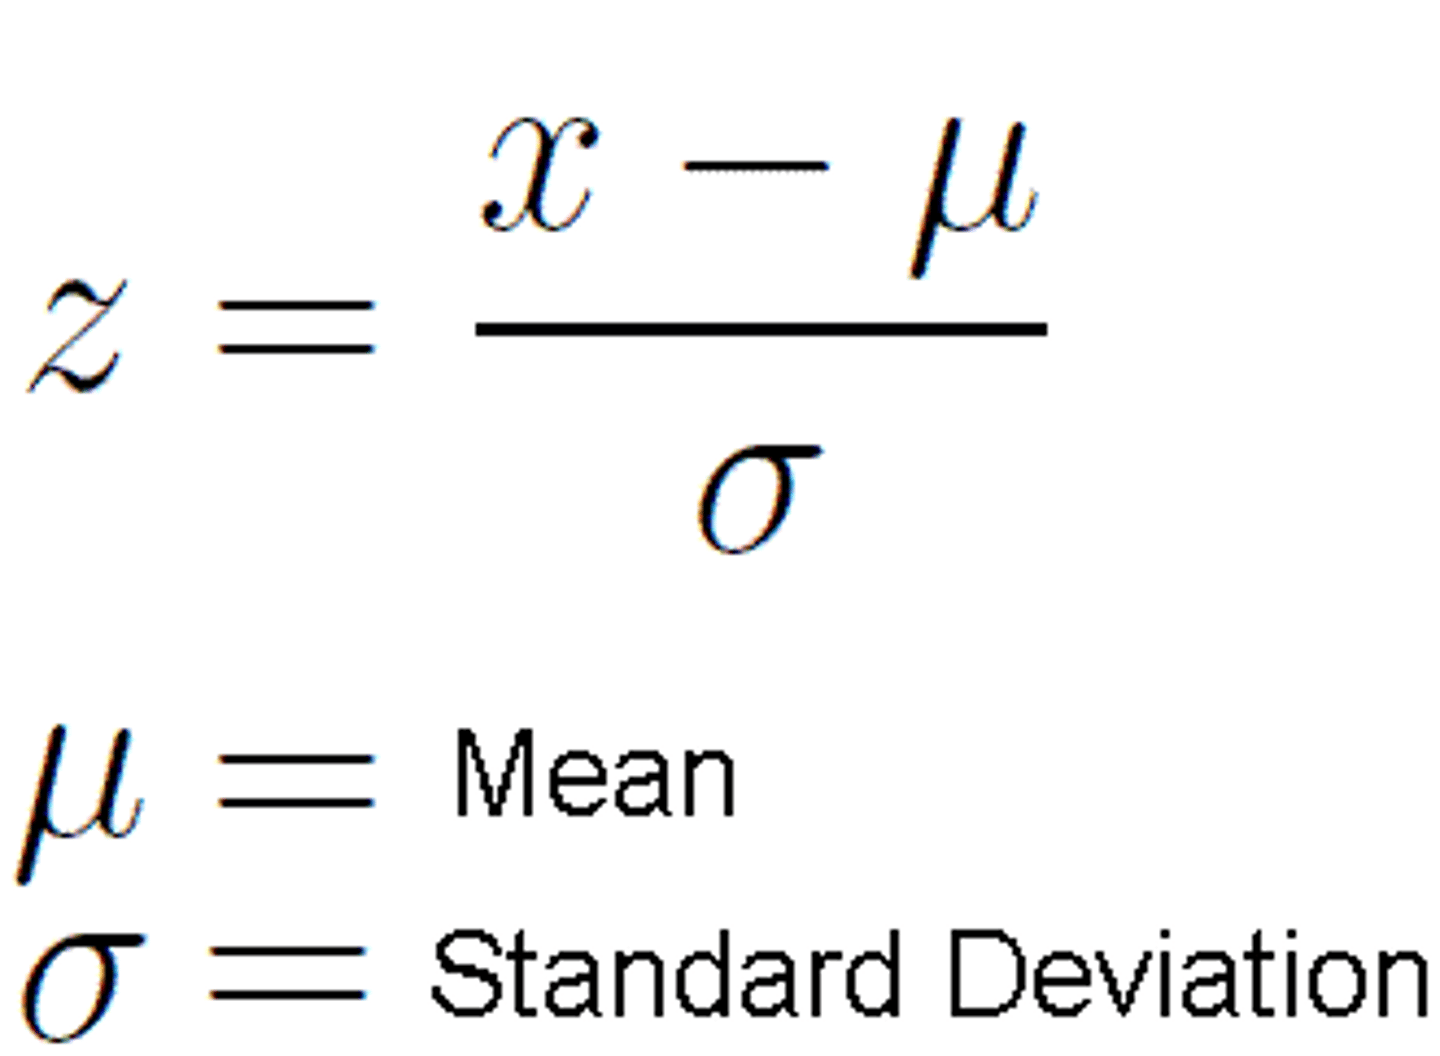
z-score
a measure of how many standard deviations you are away from the norm (average or mean)
z scores and standard normal distribution are useful for
-Calculating the probability of a score occurring within our normal distribution (i.e., comparing a score to the population distribution)
-Comparing two scores from different population distributions with different means and standard deviations
creating inferences about groups
1. need a theoretical distribution of all the "Means" from all the groups
2. We use the Mean and Standard Deviation of this theoretical distribution
sampling distribution of the mean
theoretical frequency distribution of the means of all possible samples of a given size drawn from a particular population; it is normally distributed; a distribution that plots the "Means" of many many many groups.
use the Mean and Standard Deviation of this theoretical distribution.
-Mean of the sampling distribution of the mean is the same as the population Mean.
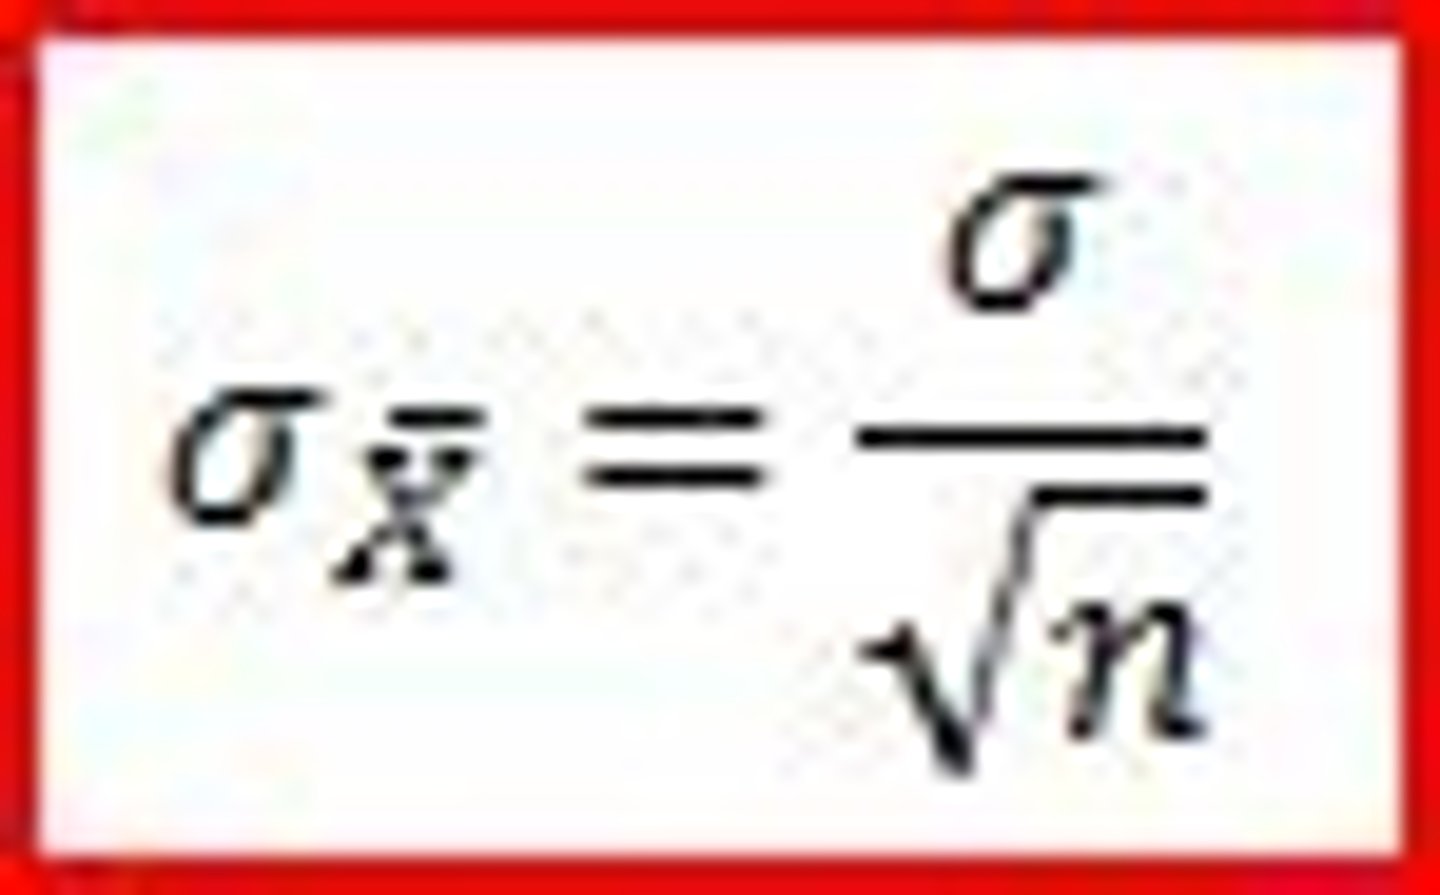
-The Standard Deviation of the sampling distribution of the mean is called the Standard Error (SE)
standard error
the standard deviation of a sampling distribution
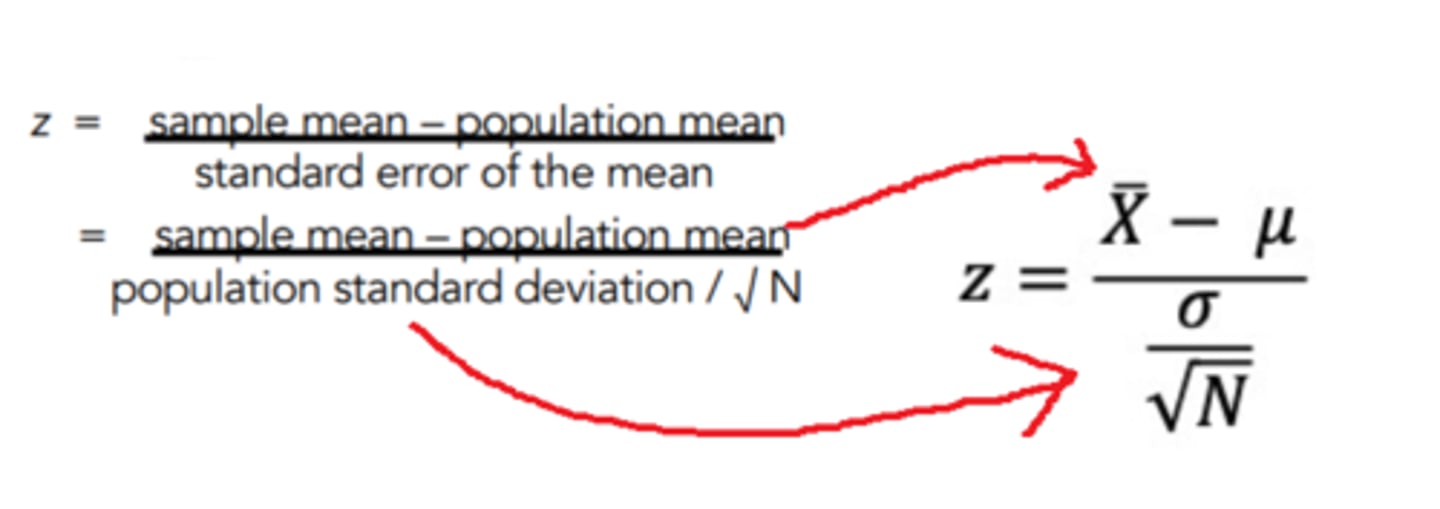
calculating z scores for groups vs individuals
standardizing the difference between your group's Mean and the population Mean to the spread of the sampling distribution of the Mean
z-score for group
Are the results meaningful?
-Is the difference of group Means due to the IV (new program) (Is the result meaningful and / or informative about a phenomenon?)
OR
-Is the difference of group Means due to sampling error or chance? (Is the result not meaningful and just a fluke?)
inferential uncertainty
The sort of uncertainty arising from not knowing whether the patterns we observe in the data (e.g., differences between the means) are informative because they reflect some process of interest, or whether they are due to a series of chance events; Inferential statistics can tell us how likely it would be to get the results from our study just by chance (When this probability is low, then our inferential uncertainty is low, and we can be more confident that our results are meaningful)
What is the probability that our results could have been produced by chance?
-can't answer this question directly using these kinds of statistics (Frequentist statistics).
-Instead, we answer this question indirectly, using a process called "Null Hypothesis Significance Testing
Null Hypothesis Significance Test
a process of statistical inference in which, given the sample data, a decision is made to either reject or not reject the null hypothesis
steps for Null Hypothesis Significance Test
1. Define the null hypothesis (written as H₀) (We assume the null hypothesis is true to start off with)
2. Define the alternate hypothesis (written Ha or H₁ there is a difference between experimental and control groups)
3. Design your study, collect your data
4. Calculate a test statistic
5. Compare this to the critical value
6. Decide if you Reject or retain the null hypothesis
logic for Null Hypothesis Significance Test
-imagine that we live in a universe where the null hypothesis is actually true and that we've run our experiment over and over again with different random samples from the same population.
-Imagine we record the results from all those experiments in a distribution
-We then compare the result we get from our study (our test statistic) to this imaginary distribution (or to one point in the distribution, called a critical value
-This allows us to find the proportion / percentage of studies in this null universe that produced results that are the same as or larger than the result we found in our study.
-This tells us what the probability is of finding our results when the null hypothesis is true
-If this probability is small (i.e., less than 5%), we decide it's unlikely that our result would occur by chance if the null hypothesis was actually true
-So instead, we conclude that the null hypothesis is unlikely to be true, and the result that we got is meaningful
-We DO say that our result or effect is meaningful
-We DO NOT say that our result was not due to chance, because we weren't directly testing the probability of our result, but rather, the probability of being in a universe where there's no effect and we saw one
statistical inference in journal articles
-a published report about some research
-Journal articles about a study (e.g., experiment, survey) include a "Results" section
-Use these questions to help work out what's going on: What's the research question? What was the IV and DV? What are the Means and Standard Deviations?
inferential uncertainty
Statistical uncertainty relating to the possibility that an observed result is due to random error or chance. This uncertainty is estimated by a probability value, where a low probability indicates low uncertainty.
Null Hypothesis (H0)
the hypothesis that there is no significant difference between specified populations, any observed difference being due to sampling or experimental error.
null hypothesis examples
-cats show no preference for food based on shape
-plant growth is not affected by light color
-age has no effect on musical ability
Alternate Hypothesis (Ha or H1)
• AKA experimental hypothesis
• Statement that the population parameter has a value that differs from the null hypothesis
• In hypothesis testing, the alternate hypothesis is accepted when the null hypothesis is rejected
alternate hypothesis example
The difference between the experimental and control groups is not a fluke: Our new program did have a real effect on self-harm behaviours
test statistic
a statistic whose value helps determine whether a null hypothesis should be rejected
t-test
A statistical test that compares two Means (averages) and tells you if the difference is statistically significant (i.e., if this difference is unlikely to happen by chance).
when do we use t-test
-We use t-tests when the population's Standard Deviation (𝜎) is unknown (so, most of the time)
-This is different to a Z-score, where you need to know the population's Standard Deviation to calculate it
is t test inferential
yes- because you are using your results (your two Means) to "infer" if the two groups are from two different populations, as in, does 𝜇1 = 𝜇2
t-test logic
-We assume we live in the null-universe where there's actually no difference
-We transform our result to a t-score (a t-statistic)
-Then we see if our t-score is super unlikely to be found in the population distribution of the null-universe
-But how to determine the population distribution???
t distributions
-changes depending on our sample size
-The smaller the sample size, the wider and flatter the graph (light pink)
-When the sample size is large, it begins looking similar to the standard normal distribution (blue)
-For a t-test, we compare our result to the appropriate t distribution.
obtained t test value
-calculate a t value from the information / data we get from our sample (similar to calculating Z-scores).
-call this the "observed" or "obtained" t value (Different to the "critical" t value)
t statistic
- a ratio comparing the information we have and what could happen just by chance
-t = 0 suggests there's no difference between groups.
-A larger t value means it's less likely the difference between groups could have occurred by chance
types of t tests
-One-sample t-test
-Paired / Dependent samples t-test (Within-participants)
-Independent samples t-test (Between-participants)
one sample t test
Used to determine if a single sample mean is different from a known population mean
Paired / Dependent samples t-test
used to compare two population means where you have two samples in which observations in one sample can be paired with observations in the other sample. (Before-and-after observations on the same subjects; e.g. students' diagnostic test results before and after a particular module or course)
Independent samples t-test
used to compare two means for a between-groups design, a situation in which each participant is assigned to only one condition
critical t values
A value that 'cuts-off' some proportion of the distribution that you are comparing your test statistic to; If the difference that we observed (our t value) is really far away from the mean of this distribution (0), it's highly unlikely that our two groups are from the same population
rejection region
The proportion of our distribution that gets 'cut-off' by the critical value; represents the results that would be unlikely to occur if the null hypothesis is really true
Alpha
proportion of our distribution that gets 'cut-off' by the critical value, usually set as 0.05 or 5% of the distribution
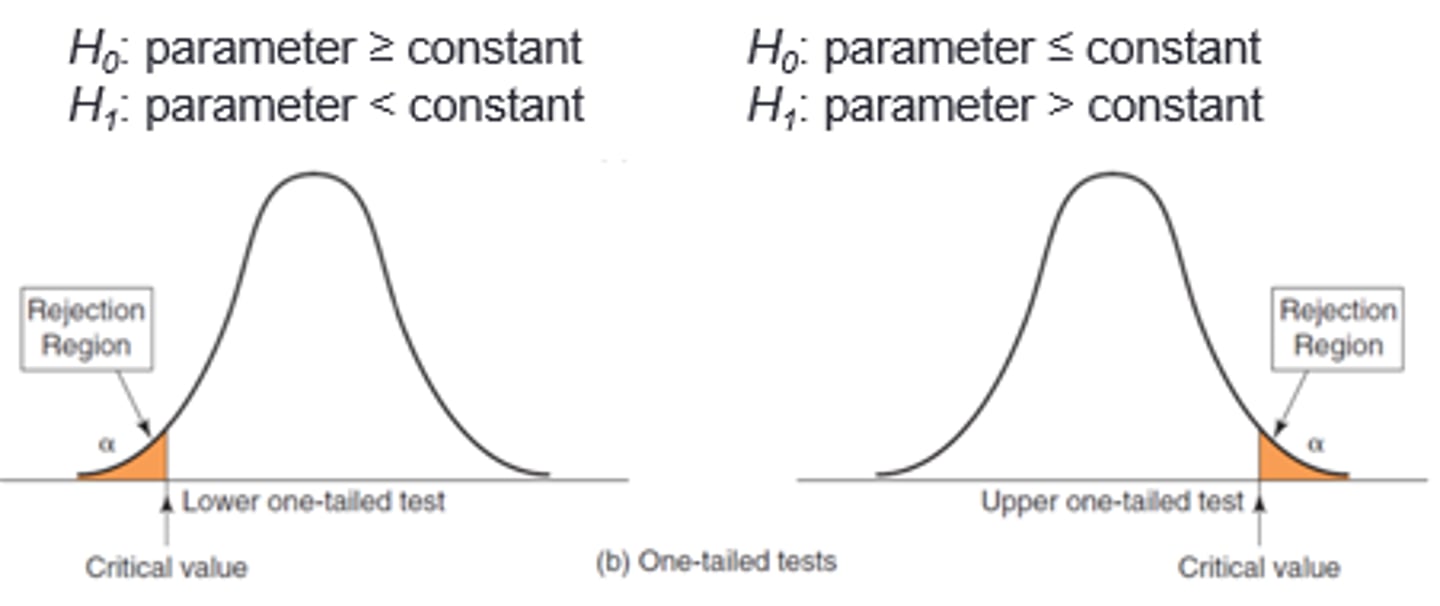
One Tail Test
Predicts that the results will fall in only one direction - either positive or negative; Use a one-tailed test if the experimental group mean can only be higher or can only be lower than the control
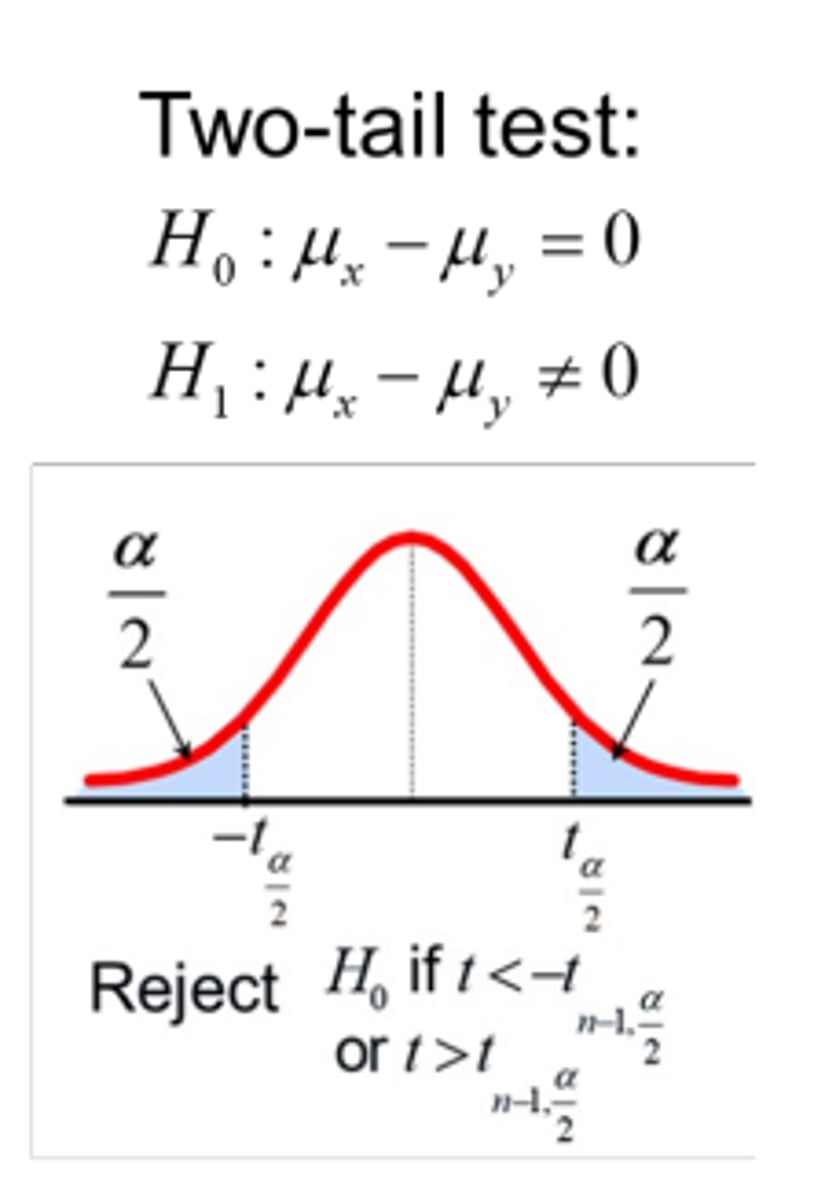
two tail testing
used when we want to test a research hypothesis that a parameter is not equal to some value; Use a two-tailed test when testing if the experimental group has a higher or lower mean than the control group
when do you retain null hypothesis
If our observed t value lies inside the critical t value (i.e., in the white area); this t value is likely to be observed by chance if the null hypothesis is true
when do you reject null hypothesis
If our observed t value lies outside the critical t value (i.e., in the blue area); this t value is very unlikely to be observed by chance if the null hypothesis is true
p-value
the probability (or chance) that we would get this result, or more extreme, if the null hypothesis were true
null hypothesis and p-values
If the proportion of the distribution cut-off by our test statistic (red area; p) is smaller than the rejection region cut-off by our critical value (blue area; p < .05), then we reject the null hypothesis and can conclude that there is a statistically significant difference between our two groups.
p value and statistical significance
p<0.05
type 1 errors
-occur when you incorrectly reject the null hypothesis (i.e., you say there is a difference between the means when there actually isn't)
-We reduce the chance of this error using ⍺
-bottom left
-IS AN EFFECT, THERE ISN'T
type 2 errors
-when you wrongly accept the null hypothesis (i.e., continue assuming there is no difference between the two means, when there actually is)
-top right
-ISN'T AN EFFECT, THERE IS
type 1 and 2 error example
We have a new drug we will put onto the market if we can show it is better than a placebo
-type I → deciding it has an effect (it doesn't)
-type II → no different than placebo, but it has an effect
statistical significance
a statistical statement of how likely it is that an obtained result occurred by chance; Our result was statistically significant when our critical value was set to ⍺ = .05 (i.e., rejection region was 5% of the distribution)
effect size
A measure of how big the difference is between your two conditions / groups (i.e., the magnitude of your effect) - 0.5 in travel time vs gpa
cohen's d
a measure of effect size that assesses the difference between two means in terms of standard deviation, not standard error; This means you can compare effect sizes across different studies, even when they used difference scales to measure the dependent variable!
cohen's d difference
d = 0.2 is small, d = 0.5 is medium, d = 0.8 is large
confidence interval
The probable range of values for a population parameter (e.g., difference between group Means)
example confidence interval
-for us, a 95% Confidence Interval (CI) refers to a range that the Mean difference between our experimental and control group would fall 95% of the time if we repeated the experiment again and again
-So, if we repeated our experiment 100 times, the difference in group Means would be inside this range in 95 of these trials