Chapter 1-2 MCQ Practice
1/22
Earn XP
Description and Tags
Name | Mastery | Learn | Test | Matching | Spaced | Call with Kai | Chat |
|---|
No analytics yet
Send a link to your students to track their progress
23 Terms
If 12% of the values of a data set lie between a and b and d is added to each value, then which of the following is true?
12% still lies between a + d and b + d.
There is no way to tell how much data is between a and b.
(12 + d)% still lies between a and b.
(12 + d)% still lies between a + d and b + d.
12% still lies between a and b
12% still lies between a + d and b + d.
If all values in a data set are converted into standard scores (z-scores) then which of the following statements is not true.
The mean and standard deviation of the transformed data are 0 and 1 respectively only for symmetric and mound-shaped distributions.
All of these statements are true statements.
The z-scores represent how many standard deviations each value is from the mean.
Conversion to standard scores is not possible for some data sets.
The empirical (68-95-99.7) rule applies consistently to both the original and transformed data sets.
The empirical (68-95-99.7) rule applies consistently to both the original and transformed data sets.

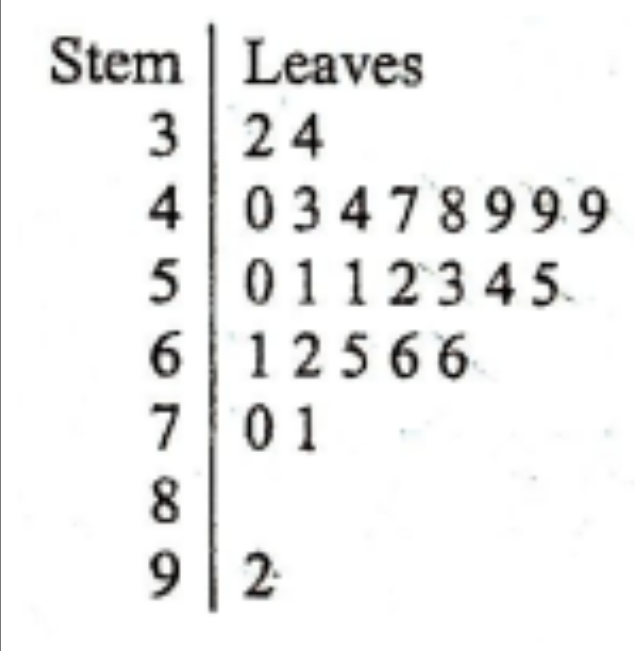
A survey was conducted to gather ratings of the quality of service at local restaurants at a nearby mall. Respondents were to rate overall service using values between 0 (terrible) and 100 (excellent). The data are represented by the following stem plot.
The value of 92 is
one of two outliers
none of these
the maximum but not an outlier
not a data value
the maximum and an outlier
the maximum and an outlier

A survey was conducted to gather ratings of the quality of service at local restaurants at a nearby mall. Respondents were to rate overall service using values between 0 (terrible) and 100 (excellent). The data are represented by the following stem plot.
What percent of the respondents rated quality as very good or higher (rating of 80 or more on a numerical scale of 0 to 100)?
25%
100%
0%
96%
4%
4%

A survey was conducted to gather ratings of the quality of service at local restaurants at a nearby mall. Respondents were to rate overall service using values between 0 (terrible) and 100 (excellent). The data are represented by the following stem plot.
The median response was
49
51
cannot be determined
50
62
51
A survey was conducted to gather ratings of the quality of service at local restaurants at a nearby mall. Respondents were to rate overall service using values between 0 (terrible) and 100 (excellent). The data are represented by the following stem plot.
The mean of the data is
an integer
cannot be determined
equal to the median
less than the median
greater than the median
greater than the median
In skewed-right distributions, what is most frequently the relationship of the mean, median and mode?
mean > mode > median
mode > median > mean
mean > median > mode
median > mean > mode
mode > mean > median
mean > median > mode
A random survey was conducted to determine the cost of residential gas heat. Analysis of the survey results indicated that the mean monthly cost of gas was $125, with a standard deviation of $10.
If the distribution is mound-shaped and symmetric, what percent of homes will have a monthly bill of more than $115?
50%
97.5%
34%
84%
68%
84%
A random survey was conducted to determine the cost of residential gas heat. Analysis of the survey results indicated that the mean monthly cost of gas was $125, with a standard deviation of $10.
The z-score of a house with a gas bill of $150 per month is
2.5
25
1.5
-2.5
0.40
2.5
The average life expectancy of males in a particular town is 75 years, with a standard deviation of 5 years. Assuming that the distribution is mound-shaped and symmetric, the approximate 15th percentile in the age distribution is
70
75
65
60
80
70
The test grades at a large school have an approximately normal distribution with a mean of 50. What is the standard deviation of the data so that 80% of the students are within 12 points (above or below) the mean?
10.375
9.375
Cannot be determined from the given information
14.5
5.875
9.375

The graph below shows cumulative proportions plotted against grade point averages for a large public high school.
What is the interquartile range
2.4
1.8
4.0
2.8
1.0
1.0
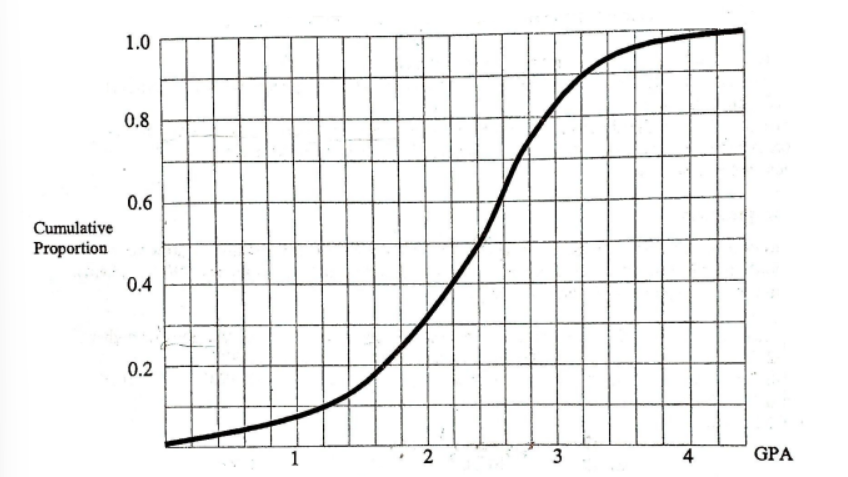
The graph below shows cumulative proportions plotted against grade point averages for a large public high school.
What is the median grade point average?
2.4
0.8
2.0
2.5
2.6
2.4
A reporter from a consumer magazine notes that the mean price of 30 selected grocery items at a particular supermarket is $0.75 with a standard deviation of $0.20. Suppose the following week the store raises all prices by 5 cents, and then the next week they lower all prices by 5%. What are the new mean and standard deviation for the 30 selected items?
$0.76, $0.19
$0.76, $0.24
$0.76, $0.20
$0.80, $0.24
$0.80, $0.20
$0.76, $0.19
Suppose the average score on a national test is 500 with a standard deviation of 100. If each score is increased by 25, what are the new mean and standard deviation?
525, 105
525, 125
500, 125
525, 100
500, 100
525, 100
In a group of 10 scores, the largest score is increased by 40 points. What will happen to the mean?
It will increase by 4 points.
It will increase by 40 points.
It will increase by 10 points.
There is not sufficient information to answer this question.
It will remain the same.
It will increase by 4 points.
Suppose the average score on a national test is 500 with a standard deviation of 100. If each scores is increased by 25%, what are the new mean and standard deviation?
625, 125
525, 100
500, 100
525, 105
625, 100
625, 125
Scores on a Chemistry test follow a normal distribution with a mean of 65 and a standard deviation of 12. Approximately what percentage of the students have scores below 50?
11%
15%
39%
18%
89%
11%
The scores on a statistics test are normally distributed with a mean of 62 and a variance of 225. If the instructor wishes to assign B's or higher to the top 30% of scores, what score is required to get a B or higher?
73.2%
68.7%
71.5%
74.5%
69.9%
69.9%
The height of an adult male is know to be normally distributed with a mean of 69 inches and a standard deviation of 2.5 inches. Find the height of a doorway such that 96% of the adult males can pass through without having to bend.
80 inches
65 inches
74 inches
58 inches
74 inches
Suppose that X is normally distributed with a mean of 50 and a standard deviation of 6. The value of c, such that P(50-c < X < 50+c) = 0.95 is closest to:
9.87
1.65
11.76
1.96
2
11.76
Suppose that pulse rates of people in a certain population are normally distributed. If 70% of people have pulse rates greater than 65 beats per minute, and 10% of people have pulse rates of more than 80 beats per minute, then the mean and standard deviation of pulse rates in this populat are closest to:
69.4, 8.3
73.3, 8.3
74.4, 14
54.6, 19.8
75.4, 8.3
69.4, 8.3
It is known that the resistance of carbon resistors is normally distributed with mean = 1200 ohms and standard deviation = 120 ohms. What proportion of the resistors have resistances that differ from the mean resistance by more than 120 ohms?
0.3174
0.3413
0.1587
0.9544
0.6826
0.3174