ECON FLASHCARDS DIGITISED HL
1/138
Earn XP
Description and Tags
(Simi's Set) Playlist 1-4 so far. If I didn't send this to you then don't ask me the password.
Name | Mastery | Learn | Test | Matching | Spaced | Call with Kai |
|---|
No analytics yet
Send a link to your students to track their progress
139 Terms
• Outline the mnemonic device WISE ChoICES.
W = Well being, I = Interdependence, S = Scarcity, E = Efficiency, Ch = Choices, I = Intervention, C = Change, E = Equity, S = Sustainability
• List the “three basic economic questions”
What production should take place (ie. what/how much to produce)?
This question is about deciding which goods and services should be provided in the economy at any moment in time. For example, is it better for the economy to have more roads and airports or to have more schools and hospitals? As resources are limited in supply, decision makers realize there is an opportunity cost in answering this question.
How should production take place (ie. how to produce)?
This question is about the methods and processes used to produce the goods and services desired by individuals and societies. For example, decision makers will have to decide which combination of factors of production (land, labour, capital and enterprise) should be used in the production process. The economy will also need to decide whether it is feasible to use capital-intensive technologies or whether there is there a preference for specialization of labour, and which raw materials should be used or should be imported for use in the production process.
For whom should production take place (ie. for whom to produce)?
This question is about which economic agents receive goods and services. For example, should any goods and services be provided free to everyone in society, irrespective of their willingness and ability to pay for these? Should the government provide healthcare services to everyone within the country such as non-taxpayers, asylum seekers, immigrants and overseas tourists? Or should goods and services be produced only for those who can afford to pay?
• Define microeconomics and state one example of a microeconomic problem.
Microeconomics is the study of individual markets and sections of the economy rather than the economy as a whole. Microeconomics examines:
The different choices individuals, households and firms make
What factors influence their choices
How their decisions affect the price, demand and supply of goods and services in a market
How Governments influence consumption and production
• Define macroeconomics and state one example of a macroeconomic problem.
Macroeconomics is the study of economic behaviour and decision-making in the entire economy, rather than just an individual market. Macroeconomics examines:
The role of the government in achieving economic growth and human development through the implementation of specific government policies (fiscal, monetary and supply-side)
The role of the government in achieving price stability, low unemployment and a stable Current Account balance on the Balance of Payments account
The interaction of the economy with the rest of the world through international trade
List the four factors of production.
Land (natural resources), labour (human effort), capital (man‑made inputs including physical, human and financial capital), and entrepreneurship (organising and risk‑taking ability). Example: a farmer uses land, labour, equipment and their own management to grow crops
Define physical capital.
Physical capital refers to tangible man‑made goods such as machinery, tools and buildings used to produce other goods and services. Example: a factory’s machines and equipment
Define human capital.
Human capital is the skills, knowledge and abilities of individuals acquired through education and training that enhance productivity. Example: a skilled engineer’s expertise increases a firm’s output
Define financial capital.
Financial capital is funds used to acquire physical capital or invest in businesses, such as money, stocks and bonds used to finance production Example: a business raises funds through loans to buy new machinery
Define opportunity cost and state that the opportunity cost of A = B/A.
Opportunity cost is the value of the next best alternative forgone when a choice is made. In comparative advantage, the opportunity cost of producing good A equals the amount of good B sacrificed per unit of A, calculated as B/A Example: if growing one more ton of wheat means giving up two tons of corn, the opportunity cost of wheat is 2 tons of corn.
Define free goods and state one example.
A free good is any good that is not scarce and therefore has 0 opportunity cost.
Since it is not limited by scarcity, nothing must be sacrificed to obtain it.
Define economic good and state one example.
An economic good is any good that is scarce and thus has an opportunity cost >0.
Different types of economics goods can be rivalrous and/or excludable as well as scarce.
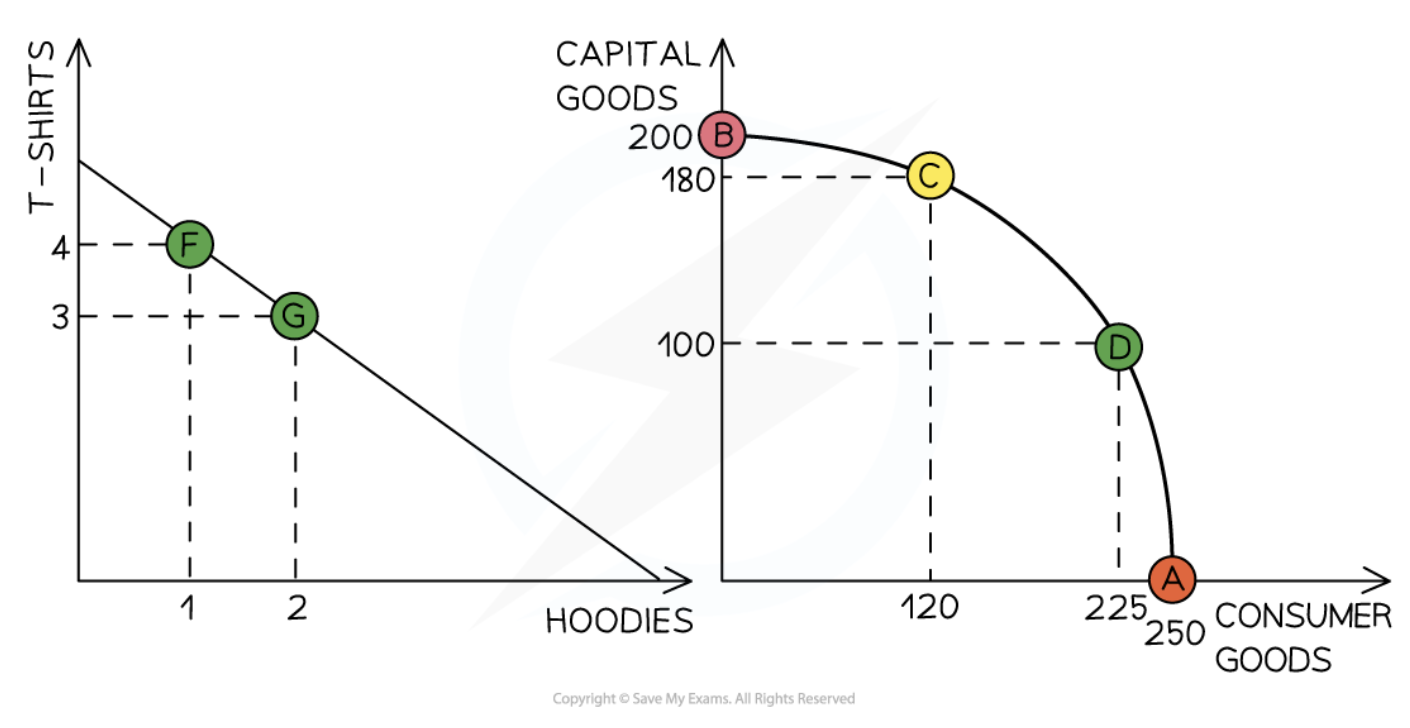
What must be true for production to be on the curve of the PPC?
All resources must be fully employed
NO unemployment of resources (including human capital)
All resources must be used efficiently. ie. all resources are used without any waste
Actual output on a PPC
Actual output is the amount that an economy is currently producing, which is always under the curve of the PPC as economies are not perfectly efficient.
Potential output on a PPC
Potential output is shown by points on the PPC’s boundary, where resources are fully employed and the economy is producing efficiently
Capital goods
Capital goods are physical, man-made assets businesses use to produce other goods or services.
Consumer goods
Consumer goods are final products purchased for personal use and have no further productive application.
Explain why opportunity cost might increase as factors of production are shifted away from one product towards another product.
As production moves along a curved PPC, opportunity cost rises because resources are not equally suited to producing all goods: more efficient resources are reallocated first, but increasingly less‑suited resources must be used, leading to larger sacrifices. Diminishing returns mean each additional unit of the new product requires giving up more of the other product.
As we produce more of a good, we are sacrificing more of another. On a PPC with goods requiring different FOP, we move away from one to produce the other.
Define economic growth. (PPC)
Economic growth occurs when there is an increase in the productive potential of an economy
This is demonstrated by an outward shift of the entire curve. More consumer goods and more capital goods can now be produced using all of the available resources
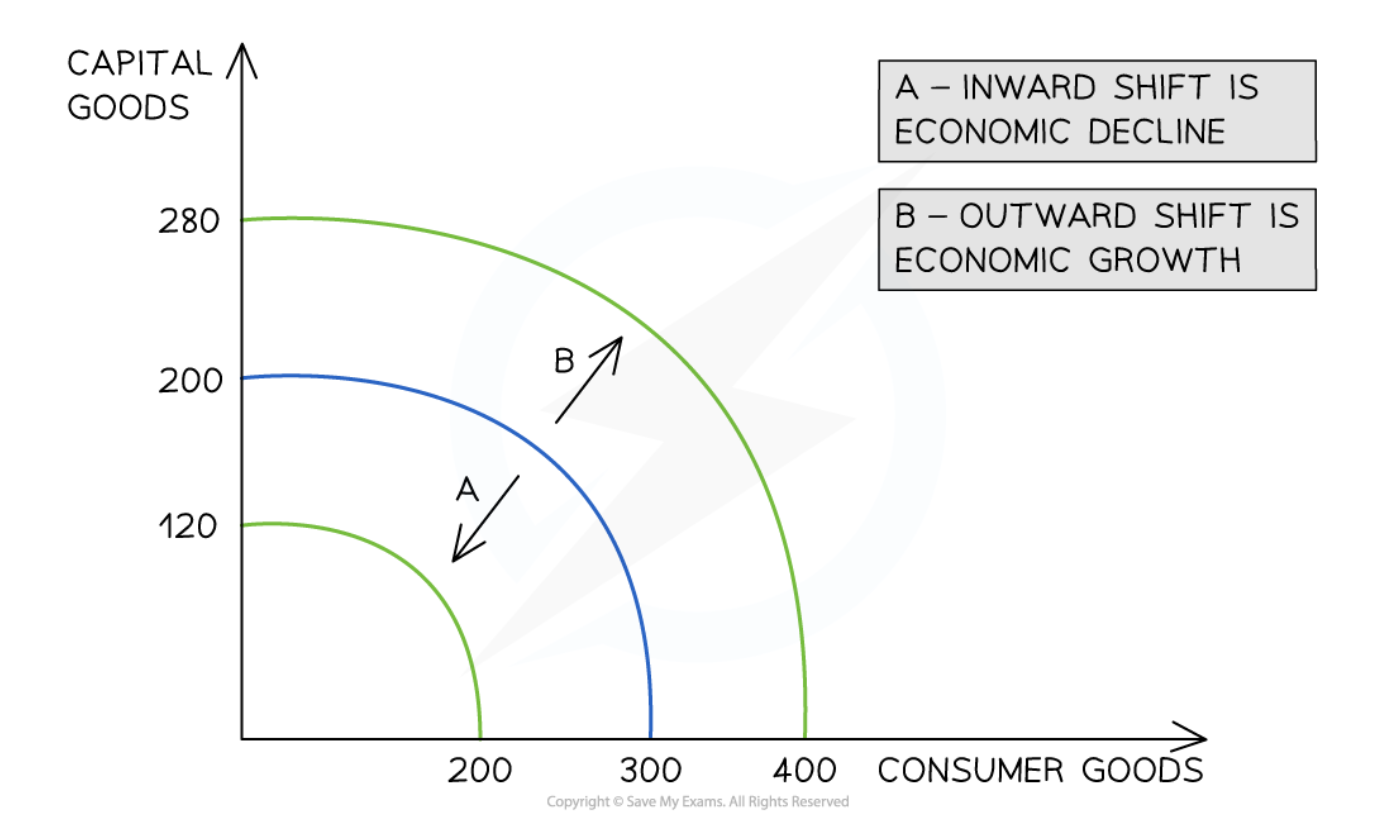
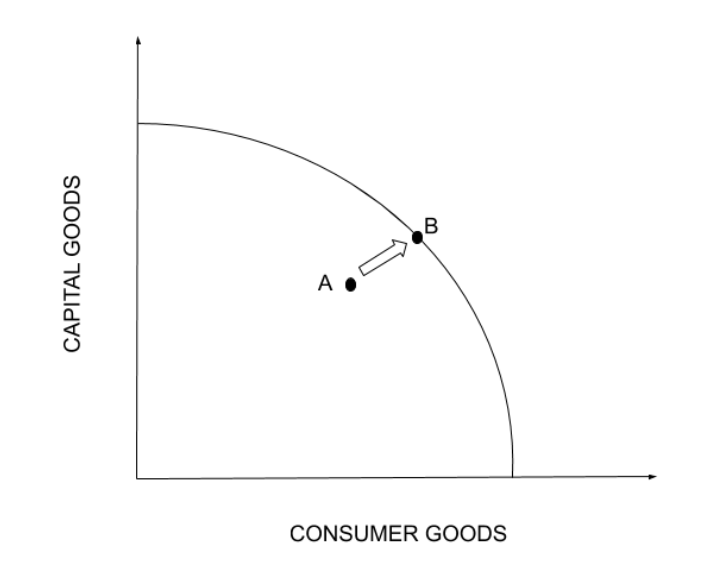
Using a PPC diagram, show actual growth (reduction in unused factors of production and inefficiency in production).
Actual growth is illustrated by a movement from a point inside the PPC toward the boundary, reflecting better use of existing resources and reduced unemployment
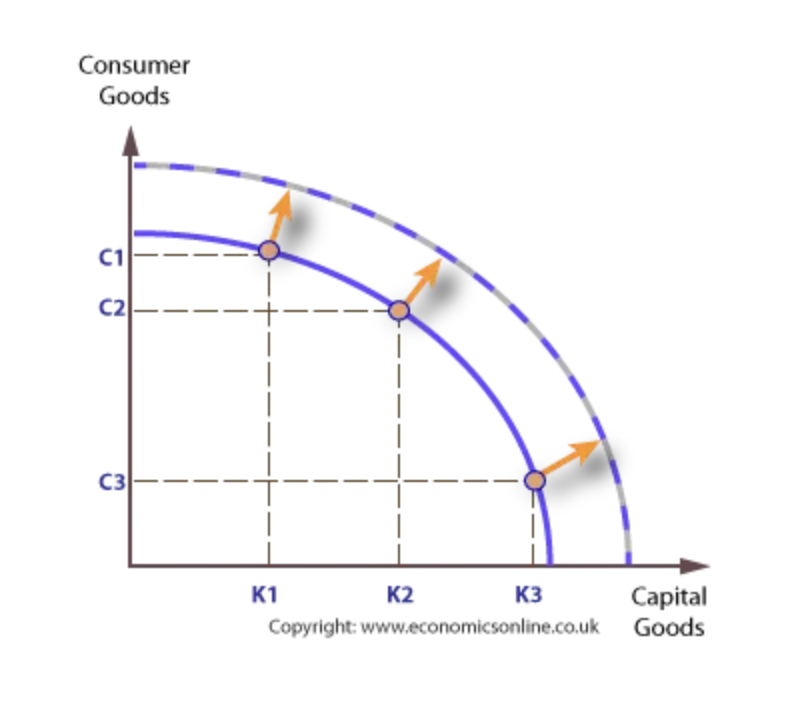
Using a PPC diagram, show a growth in production possibilities (an increase in the quantity or quality of any factor of production).
A growth in production possibilities is shown by an outward shift of the PPC, indicating that improvements in technology or increases in resources have expanded the economy’s productive capacity
What is the difference between productive and allocative efficiency on a PPC?
Productive efficiency is any point along the curve of the PPC, where all resources are perfectly employed and utilised.
Allocative efficiency is a state of the economy in which production is aligned with the preferences of consumers and producers; in particular, the set of outputs is chosen so as to maximize the social welfare of society.
An example is demerit goods. Allocative efficiency in this instance would be below the PPC curve as we would want to produce less of a harmful good
Describe Say’s Law and pair this with “If you build it, they will come.”
Say's Law states that supply creates its own demand; Keynes' Law states that demand creates its own supply
Define free market economy and state one historical example.
A free market economy is one with minimal government intervention, where private individuals own most resources and prices are determined by supply and demand (Price mechanism)
Historical examples include 19th‑century United States or modern Hong Kong.
A free market economy takes the “market approach” to answering the key economic questions such as what/how much to produce & for whom to produce - THOUGH THEY DON’T ALWAYS PRODUCE ‘BEST’ ANSWERS EFFECTIVELY so some government intervention is necessary
Market orientated approaches aim to reduce government intervention and free up private-sector economic activity so that national output (real GDP) increases
As national output increases, the potential to break the poverty trap increases and this can lead to better economic development in a nation
In the free market economy households and firms (theprivate sector) are the main owners of resources, as well as the economic decision-makers who make buying and selling decisions and who are linked together in product and resource markets.
Define planned economy and state one historical example.
A planned economy is one where a central authority, such as the government, controls production. This is the command approach
Interventionist strategies are put in place by governments to correct the failings of the free market and promote the welfare/development of its citizens
Interventionist strategies aim to increase human capital, productivity and output
In a planned economy, the government makes all decisions about how resources are allocated and how goods and services are distributed, using non-price rationing. The government creates detailed plans for all economic activity and directs production through commands. Only a few countries today remain highly centrally planned, such as North Korea and, to a lesser extent, Cuba.
Define mixed market economy
A mixed market economy combines market and command approaches
Ceteris paribus
“All things equal”. It’s like saying ‘If X then Y, but only if nothing else changes'
This is what we say when we are observing the relationship between two things such as supply and demand, but that what we are explaining is only the case when income and tastes are unchanged
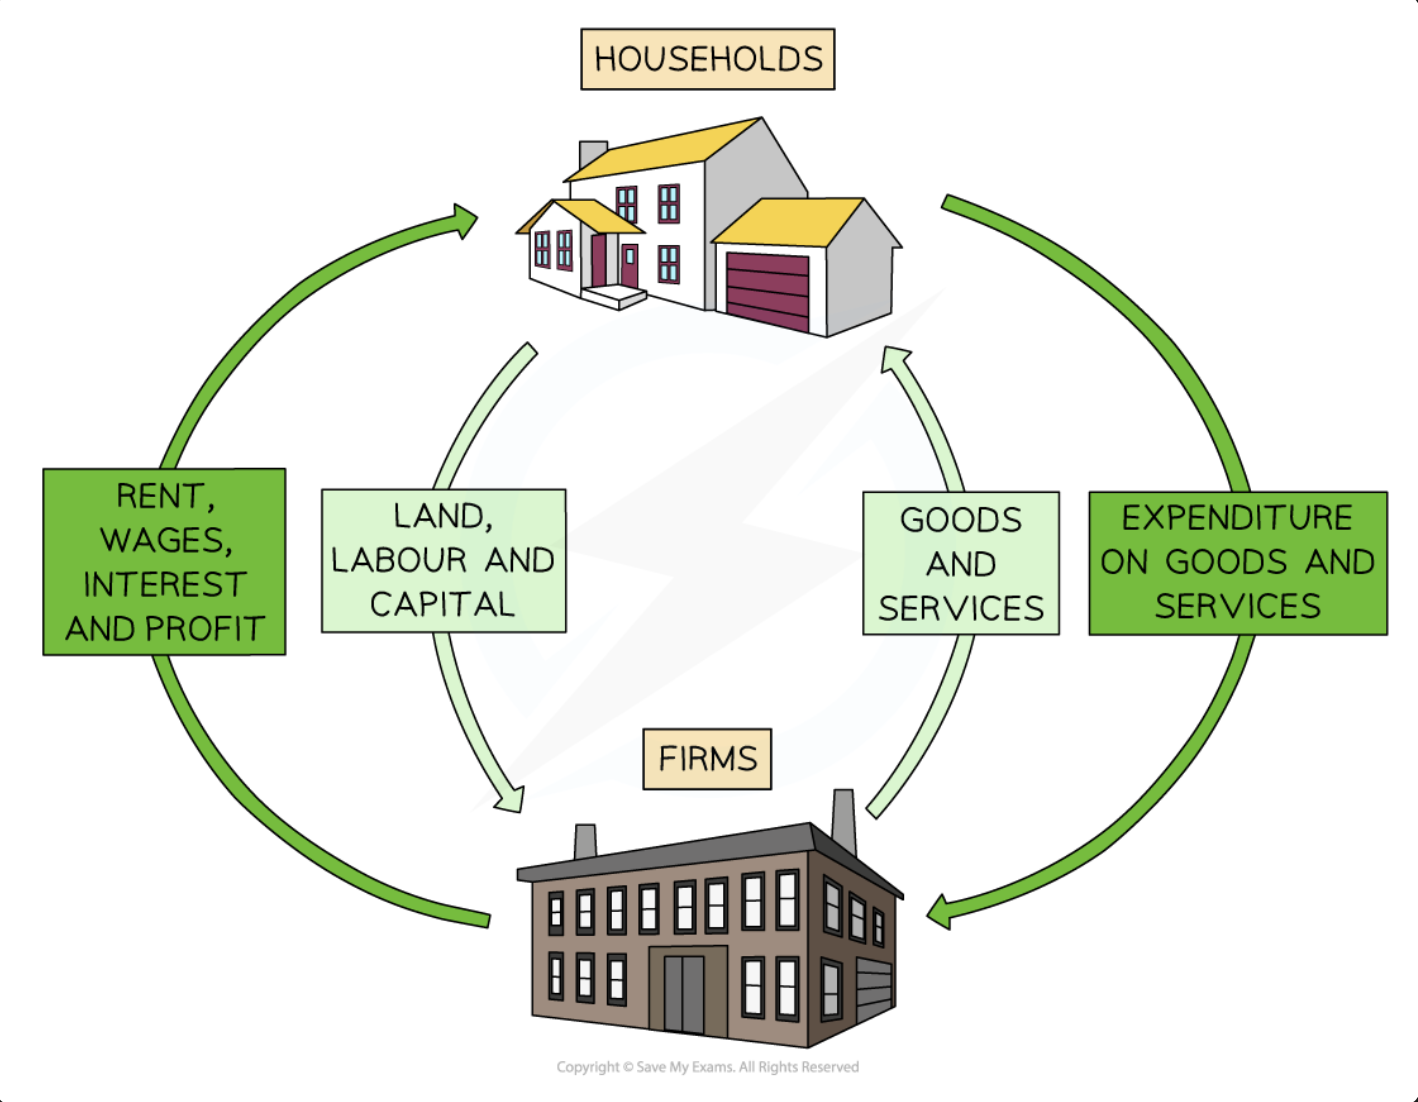
Outline the circular flow of income model
Diagram Analysis
Households own the wealth in the economy
These are the factors of production
Households supply their factors of production to firms and receive income as a reward
They receive rent for land, wages for labour, interest for capital, and profit for enterprise
With this income, they purchase goods/services from firms
Firms purchase factors of production from households
They use these resources to produce goods/services
They sell the goods/services to households and receive sales revenue
Define poverty, absolute poverty, and relative poverty
Poverty describes the involuntary situation in which individuals or households lack sufficient income to meet basic necessities such as food, shelter and healthcare; it is involuntary and reflects deprivation of essential goods and services. Absolute poverty and relative poverty are the two main ways of describing the concept
Absolute poverty is a situation where individuals cannot afford to acquire the basic necessities for a healthy and safe existence
These necessities include shelter, water, nutrition, clothing and healthcare
In 2022, the World Bank defined absolute poverty as anyone who was living on less than $1.90 a day (the so called international poverty line)
Absolute poverty is more prevalent in developing countries than in developed ones
Relative poverty is a situation where household income is a certain percentage less than the median household income in the economy
Poverty in a household is considered relative to income levels in other households
Households that are living with less than 50% of the median household income are considered to be in relative poverty
Relative poverty is the main form of poverty that occurs in developed countries
Does poverty relate only to low or insufficient income? What are some difficulties in measuring poverty?
Poverty is a multi-dimensional concept by definition, it relates to deprivations.
Difficulties in Measuring Poverty
Poverty is multi-dimensional concept and difficult to quantify
Poverty is usually measured through self reported surveys and this gives rise to multiple discrepancies in - and between - countries
Households who identify as poor may exhibit very different characteristics from each other
Urban households may have very different ideas of their poverty level compared to rural households
Urban areas tend to have higher immigrant households whose status can change relatively quickly as they seize opportunities
Rural households may remain in long-term poverty
Poverty data for different ages, gender and disabilities is not easily available
Define multidimensional poverty index and state the dimensions by which it measures poverty
The MPI tracks deprivation across three dimensions and 10 indicators
Health (child mortality, nutrition)
Education (years of schooling, enrolment)
Living standards (water, sanitation, electricity, cooking fuel, housing, assets)
Poverty trap
The poverty trap is a self‑reinforcing cycle where low income leads to low saving and investment in education, health or capital, resulting in low productivity and continued low income; this cycle can persist across generations
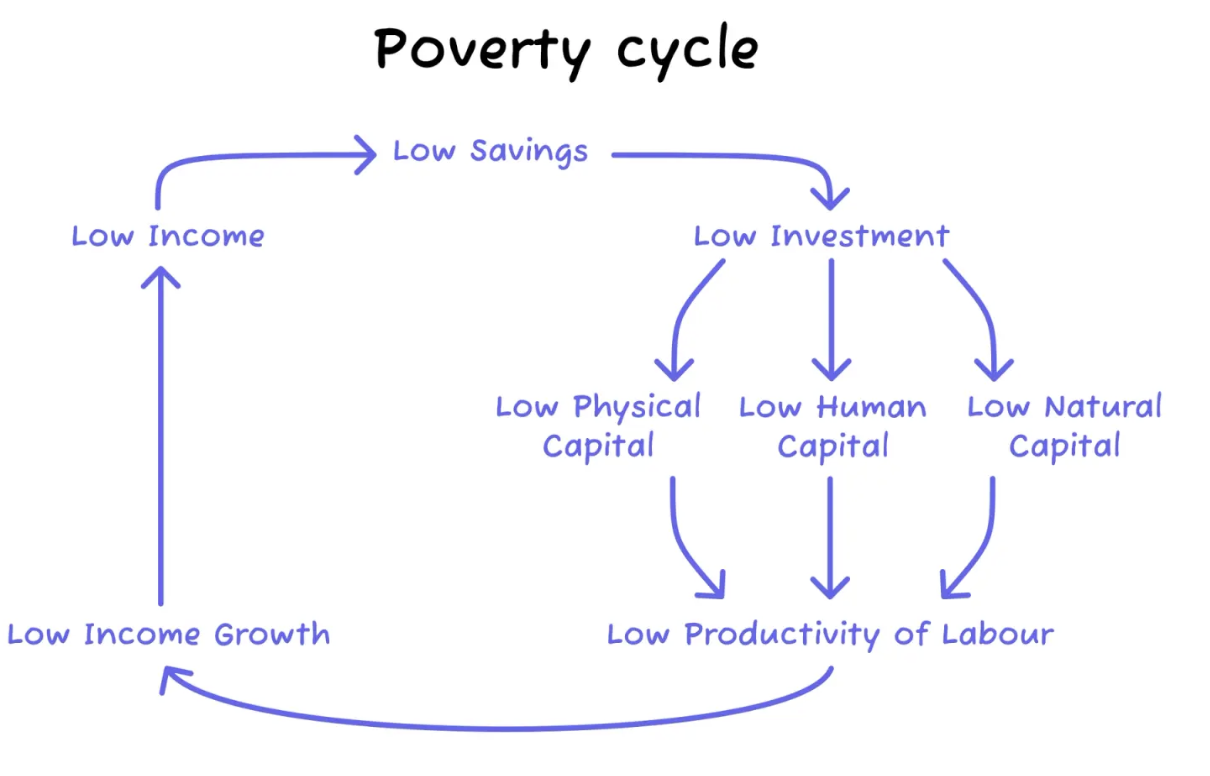
Outline how poverty is transmitted across generations.
Poverty can persist across generations when children grow up with limited access to education, healthcare and nutrition, and inherit debt or lack of assets, making it hard to escape the poverty trap
3 investments that can help break the poverty cycle
Human capital
Health services, education, nutrition
Natural Capital
Conservation and regulation of environment to preserve environmental quality
Physical capital (infrastructure)
sanitation, water supplies, roads, power supplies and irrigation
Define utility
Utility is the satisfaction or pleasure that consumers receive after consuming a good or service
Marginal utility
Marginal utility is the additional benefit/satisfaction that consumers receive from consuming one more unit (an additional product) of a good or service
Describe the law of diminishing marginal utility
The law of diminishing marginal utility describes how the marginal utility received from consuming a good or service decreases as you consume more.
The Law of Diminishing Marginal Utility states that as additional products are consumed, the utility gained from the next unit is lower than the utility gained from the previous unit
Explain why demand curves are downward sloping
Because of the law of demand ie. the negative relationship between the price & quantity demanded
As price increases, the marginal utility of consuming a good or service decreases due to the negative relationship between price and demand.
The law of demand states that there is an inverse relationship between price and quantity demanded (QD), ceteris paribus
When the price rises the QD falls
When the price falls the QD rises
Substitution effect
Goods and services do not exist in a vacuum and there are substitutes.
As the price of a good rises, consumers will have lower demand for it and will instead substitute it with now less expensive substitues.
Income effect
When there is a fall in price, the real income of consumers increases as they now have more spending power relative to how much they can purchase. (I have $10, bananas were $4 but now their $2, I can buy more than double the amount of bananas.)
Define demand
Demand refers to how much consumers are willing and able to purchase of a good/service.
Demand is the amount of a good/service that a consumer is willing and able to purchase at a given price in a given time period
If a consumer is willing to purchase a good, but cannot afford to, it is not effective demand
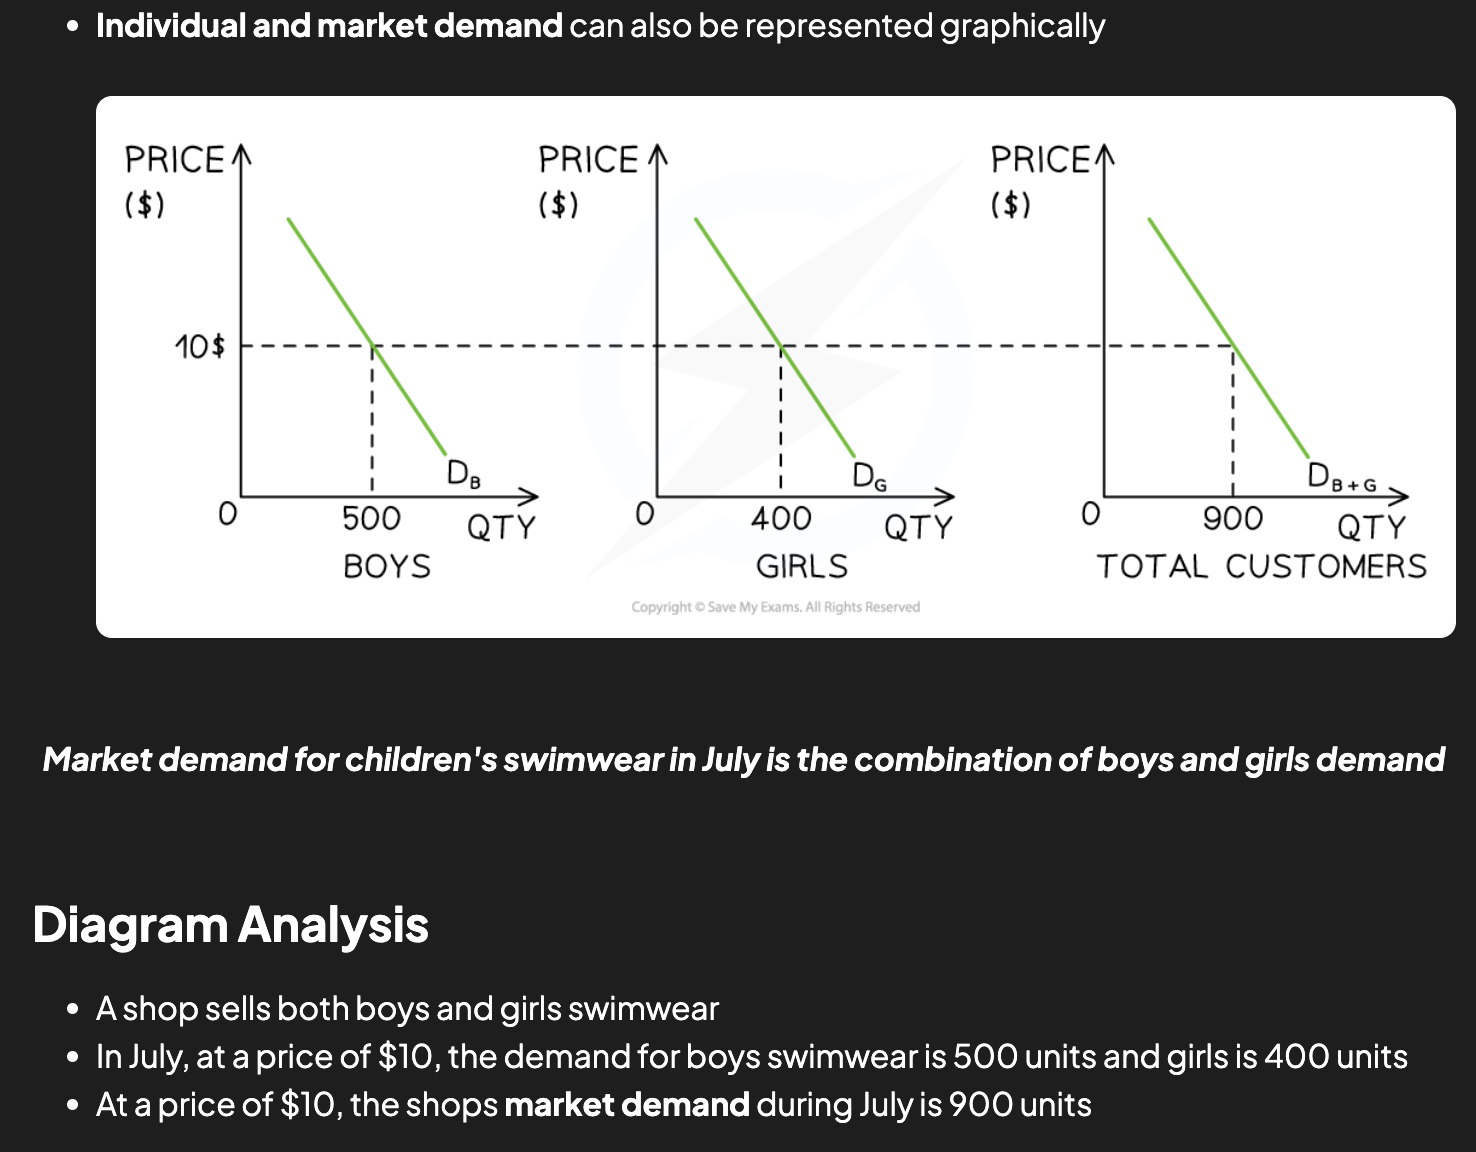
Demand curve diagram
Law of demand
The law of demand states that, ceteris paribus, as the price of a good increases the quantity demanded decreases, and as price decreases the quantity demanded increases
Define a market
The term market has since evolved to include any kind of arrangement where buyers and sellers of goods, services or resources are linked together to carry out an exchange.
Describe competition
Competition is the process by which different players struggle against one another to achieve the same goal.
This could mean competing for resources, competing to be the most profitable firm, etc.
Price Mechanism
The Price Mechanism
The price mechanism is the interaction of demand and supply in a free market
This interaction determines prices which are the means by which scarce resources are allocated between competing wants/needs
Adam Smith referred to the functions of the price mechanism as the 'mystery of the invisible hand'
The price mechanism fulfils two functions in the relationship between buyers and sellers
1. Resource allocation
Signalling: prices provide information to producers and consumers about where resources are wanted (markets with increasing prices) and where they are not (markets with decreasing prices)
2. Rationing
Prices ration scarce resources
When resources become scarcer the price will rise further. Only those who can afford to pay for them will receive them
If there is a surplus then prices fall and more consumers can afford them
Incentive:
when prices for a good/service rise, it incentivises producers to reallocate resources from a less profitable market to this market in order to maximise their profits. Falling prices incentivise the reallocation of resources to new markets
How do markets solve the problem of scarcity (PM)
The price mechanism fulfills the functions of resource allocation and rationing in the free market, which otherwise cannot be achieved without a more “command” system ceteris paribus
Resource allocation:
signalling: prices provide the information about where resources are needed and where they are not (markets with increasing prices / opportunities for profit & markets with decreasing prices)
Incentive: producers want to maximise their profits, so they want to allocate their resources in the way that makes them the most profit. Falling prices incentivises reallocation of resources to new markets
Rationing:
Prices ration scarce resources
When resources become more scarce the price will rise even more. Only those who can pay will receive them
If there is a surplus then price falls and more consumers can thus afford & access the resources
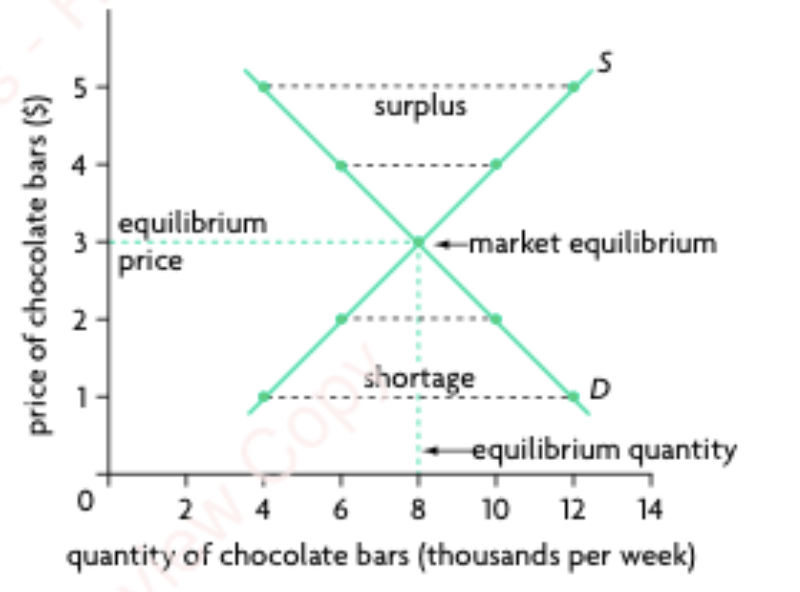
Define equilibrium
Equilibrium
Equilibrium in a market occurs when demand = supply
At this point, the price is called the equilibrium or market-clearing price
This is the price at which sellers are clearing (selling) their stock at an acceptable rate
Buyers and sellers meet to trade at an agreed price
Buyers agree the price by purchasing the good/service
If they do not agree on the price then they do not purchase the good/service and are exercising their consumer sovereignty
Based on this interaction with buyers, sellers will gradually adjust their prices until there is an equilibrium price and quantity that works for both parties
At the equilibrium price, sellers will be satisfied with the rate/quantity of sales
At the equilibrium price, buyers are satisfied with the utility that the product provides
Equilibrium occurs at the price and quantity where quantity demanded equals quantity supplied; at this point there is no inherent tendency for change, so the market is in a stable state unless disturbed
(Excess supply / surplus) & (excess demand/surplus)
The existence of excess demand (a shortage) or excess supply (a surplus) in a free market will cause the price to change so that the quantity demanded will be made equal to quantity supplied. In the event of excess demand, price will rise; in the event of excess supply, price will fall.
Define competitive market equilibrium
competitive market equilibrium, quantity demanded equals quantity supplied, and there is no tendency for the price to change. In a market disequilibrium, there is excess demand (shortage) or excess: supply (surplus), and the forces of demand and supply cause the price to change until the market reaches equilibrium. (ie. price mechanism achieves our CME)
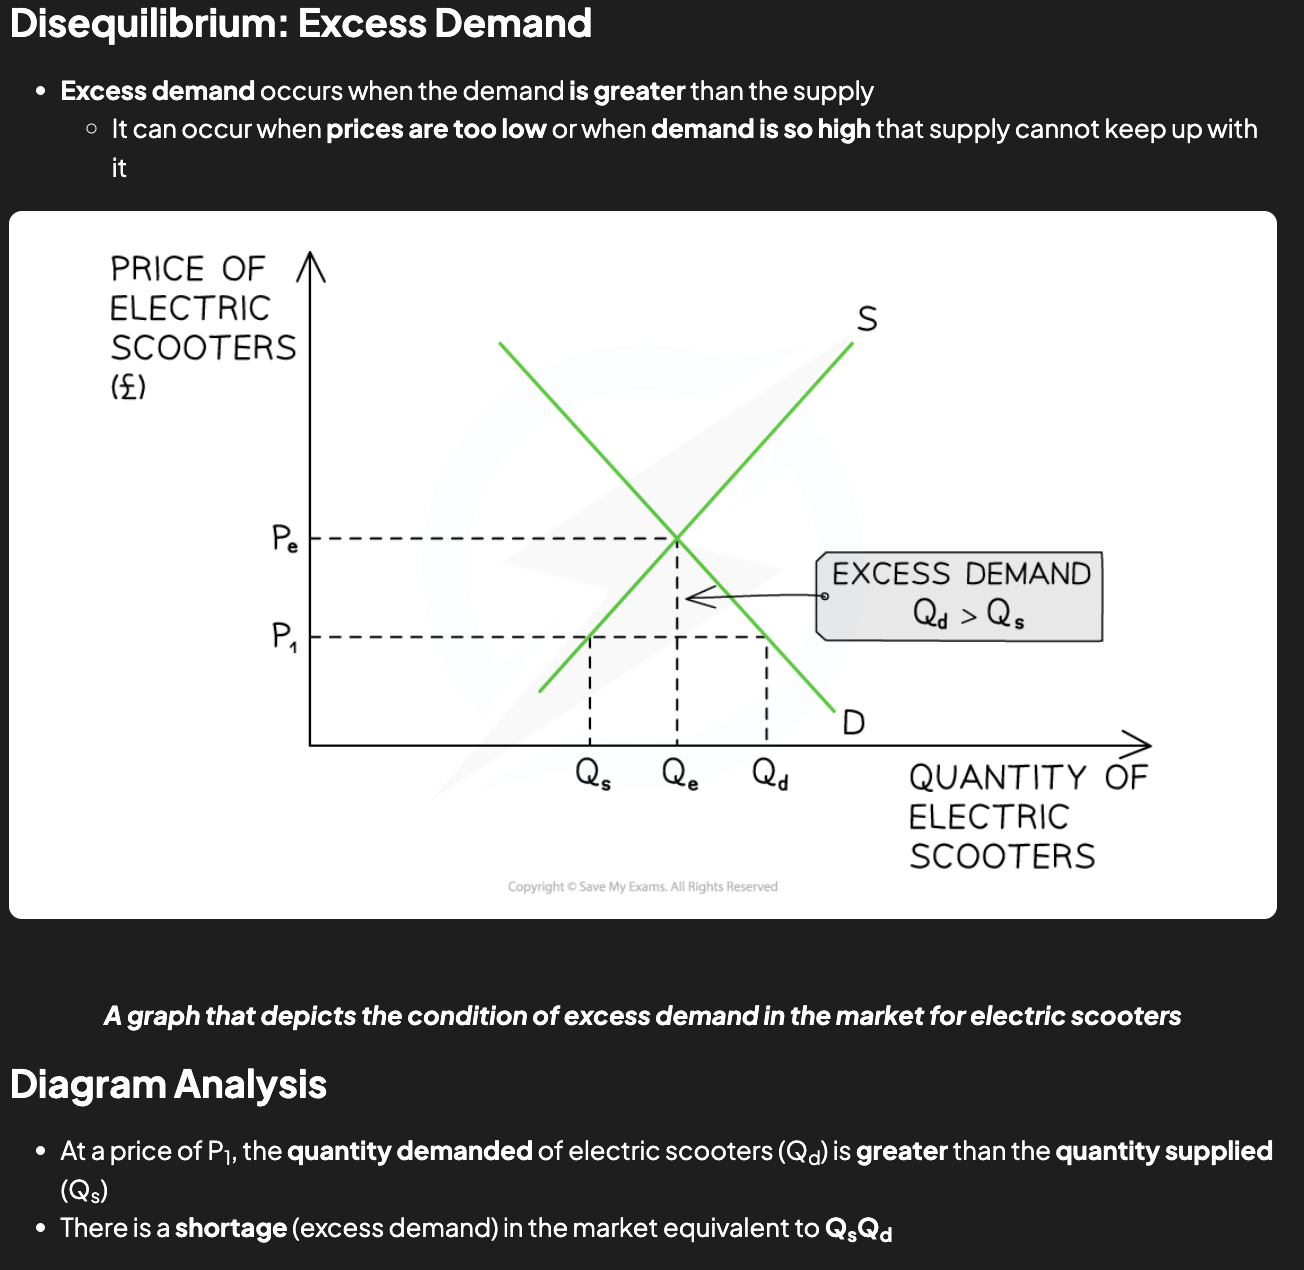
Excess demand diagram
Market Response
This market is in disequilibrium
Sellers are frustrated that products are selling so quickly at a price that is obviously too low
Some buyers are frustrated as they will not be able to purchase the product
Sellers realise they can increase prices and generate more revenue and profits
Sellers gradually raise prices
This causes a contraction in QD as some buyers no longer desire the good/service at a higher price
This causes an extension in QS as other sellers are more incentivised to supply at higher prices
In time, the market will have cleared the excess demand and arrive at a position of equilibrium, PeQe
Different markets take different lengths of time to resolve disequilibrium
E.g. Retail clothing can do so in a few days. Whereas the housing market may take several months, or even years
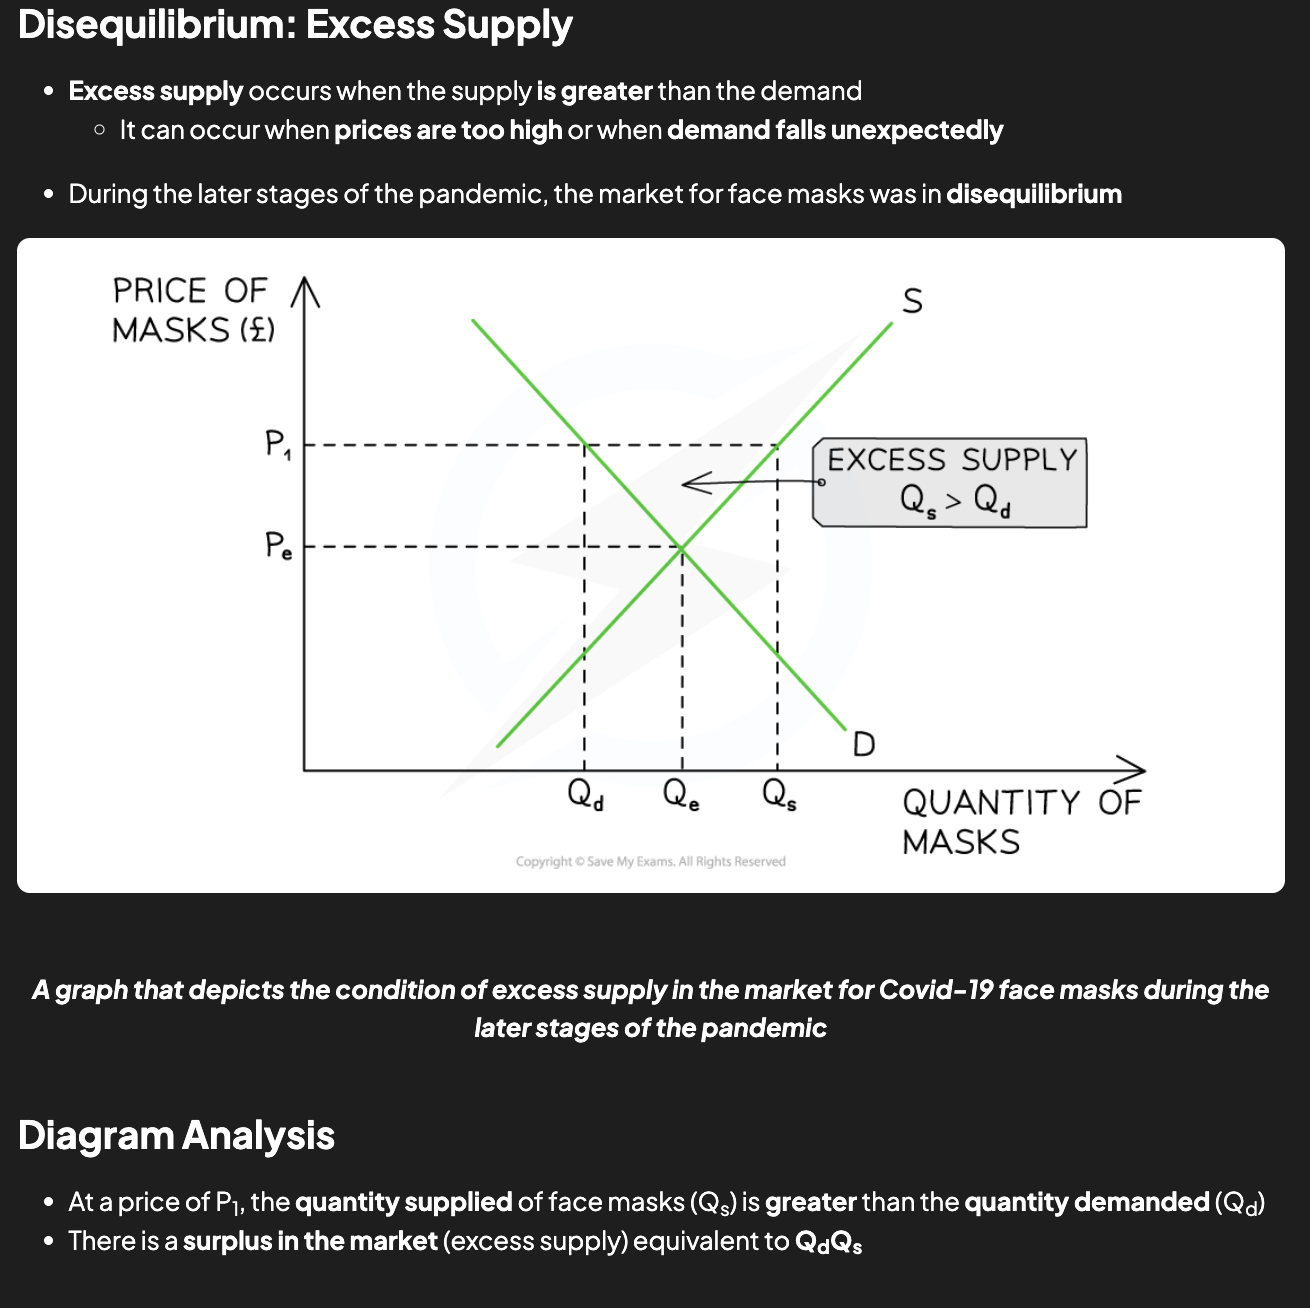
Excess supply diagram
Market Response
This market is in disequilibrium
Sellers are frustrated that the masks are not selling and that the price is obviously too high
Some buyers are frustrated as they want to purchase the masks but are not willing to pay the high price
Sellers will gradually lower prices in order to generate more revenue
This causes a contraction in QS as some sellers no longer desire to supply masks
This causes an extension in QD as buyers are more willing to purchase masks at lower prices
In time, the market will have cleared the excess supply and arrive at a position of equilibrium, PeQe
Define marginal costs & “Increasing marginal costs”
Marginal costs:
The price incurred by producing one more unit of output
Increasing marginal costs:
The concept that as a producer increases the quantity of a good/service supplied, the additional cost of producing each additional unit also increases
This relationship is reflected in the upward-sloping supply curve, indicating that producers are willing to supply a greater quantity at higher prices to justify the higher costs of production
Define marginal product
How much more output can be had with one more unit of input (ie. how many more loaves of bread can we make with one more ton of flour)
marginal product, which is the extra or additional output (potatoes) produced by one additional unit of a variable input. EXAMPLE ‘which we will assume to be labour; it tells us by how much output increases as labour increases by one worker.’
Describe the law of diminishing marginal returns
As more of a variable factor of production (e.g. labour) is added to fixed factors (e.g. capital), there will initially be an increase in productivity
However, a point will be reached where adding additional units of the factor (e.g. hiring an extra worker) begins to decrease productivity due to the relationship between labour and capital
Explain why supply curves are upward sloping
As prices increase, firms are greater incentivised to produce more of the product giving and increase in supply.
Describe what is meant by diminishing marginal product
According to the law of diminishing marginal returns, as more and more units of a variable input (such as labour) are added to one or more fixed inputs (such as land), the marginal product of the variable input at first increases, but there comes a point when it begins to decrease. This relationship presupposes that the fixed input(s) remain fixed, and that the technology of production is also fixed.
ie. At a certain point adding more FOP to a fixed input (where all FOP can’t be expanded) does not increase marginal product.
Describe the profit incentive
The incentive of producing for the reason of maxing profit.
Rational profit maximising producers would want to supply more as prices increase in order to maximise their profits
Define supply
Supply is the amount of a good/service that a producer is willing and able to supply at a given price in a given time period
A supply curve is a graphical representation of the price and quantity supplied by producers
If data were plotted, it would be an actual curve. Economists, however, use straight lines so as to make analysis easier
Supply curve
Law of supply
The law of supply states that, ceteris paribus, as the price of a good rises the quantity supplied increases, and as price falls the quantity supplied decreases
Non-price determinants of supply DEFINITION AND LIST
There are several factors that will change the supply of a good/service, irrespective of the price level. Collectively these factors are called the non-price determinants of supply and include
Changes to the costs of production
Changes to indirect taxes and subsidies
Changes to technology
Changes to the number of firms
Weather events
Future price expectations
Goods in joint and competitive supply
Non-price determinants of demand DEFINITION AND LIST
There are numerous factors that will change the demand for a good/service, irrespective of the price level. Collectively these factors are called the non-price determinants of demand and include
Changes in real income
Changes in tastes/preferences
Changes in the price of related goods (substitutes and complements)
Changes in the number of consumers
Future price expectations
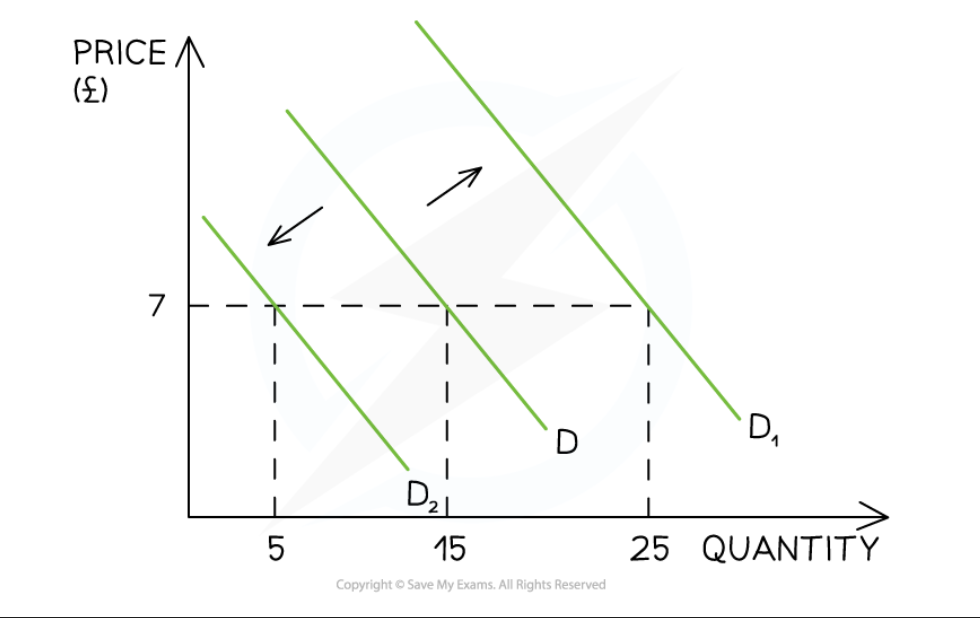
Increases and decreases in demand
INCREASE:
“up” and to the right
DECREASE:
“down” and to the left
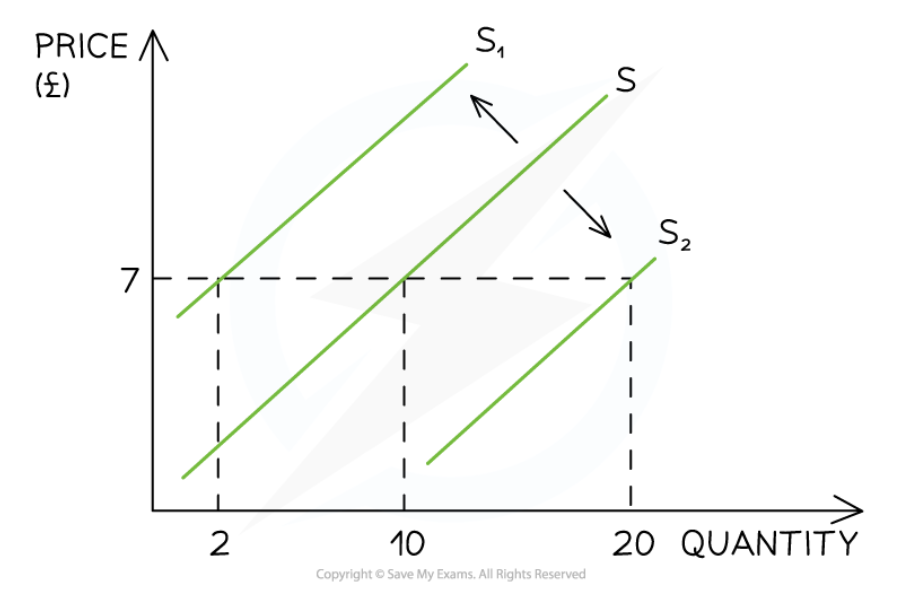
Increases and decreases in supply
INCREASE:
a shift “downwards” to the right
Decrease:
a shift “upwards” to the left
Producer and consumer surplus + WHERE IS IT ON A SUPPLY AND DEMAND DIAGRAM
Consumer surplus is the difference between the amount the consumer is willing to pay for a product and the price they have actually paid
E.g. If a consumer is willing to pay £18 to watch a movie and the price is £15, their consumer surplus is £3
Producer surplus is the difference between the amount that the producer is willing to sell a product for and the price they actually do
E.g. if a producer is willing to sell a laptop for £450 and the price is £595, their producer surplus is £145
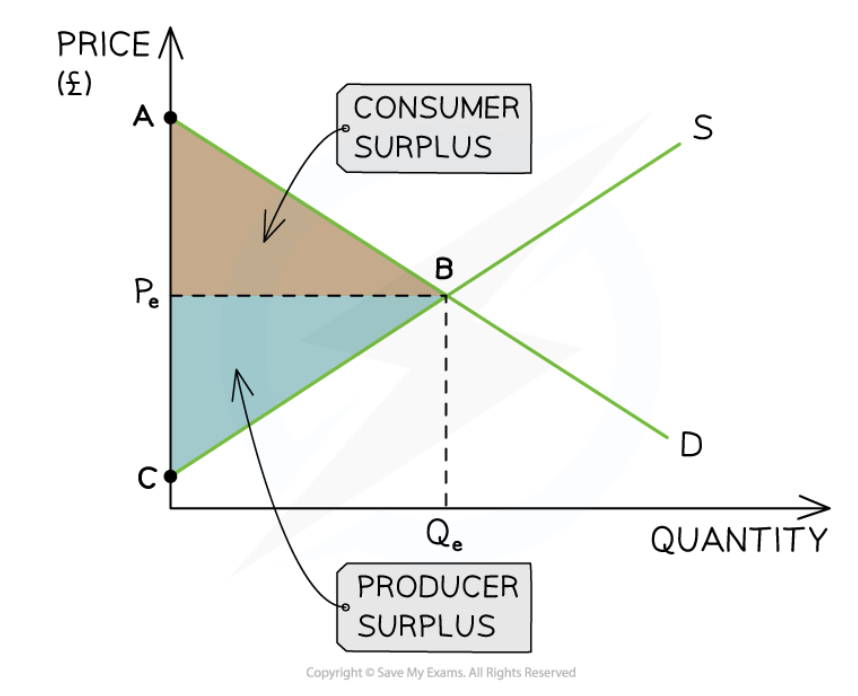
How to find producer and consumer surplus
You are finding the area from the equilibrium point to the left of the equilibrium price, so you can either just use triangle area or if it is a trapezoid, find the rectangle and add the triangle area.
Community surplus
sum of producer and consumer surplus.
Community surplus is defined as the total benefit or welfare to society of an economic transaction.
Define merit good
a product or service beneficial for society, and features external benefits as in the case of education or healthcare
UNDERCONSUMED
Define demerit good
a product or service harmful to society, and features negative external costs as in the case of cigarettes
OVERCONSUMED
Define public good
a product or service that is non-excludable and non-rivalrous, and features positive external benefits, such as street lighting
Define rational consumer choice theory
Rational choice theory states individuals use logical and sensible reasons to determine the right choice connected to an individual’s best self-interest
Many economic theories assume that economic agents (individuals, firms and governments) make decisions that result in maximising their satisfaction
E.g. The law of demand which states that as the price falls consumers will increase their demand for goods and services
State what behavioral biases do to the price mechanism
Behavioral biases diminish the strength of the price mechanism and lead to unpredictable market outcomes
List the three assumptions of consumer choice theory
Utility maximisation
Perfect information
Consumer rationality
Outline the types of bias that influence decision-making (bias should be considered a limitation of rational choice theory)
Heuristics (rule of thumb)
Anchoring & Framing
Availability bias (how easily we can recall specific examples)
Bounded rationality
2. Bounded Rationality Theory
This theory argues that people make decisions without gathering all the necessary information to make a rational decision within a given time period
Individuals may not understand the technical jargon linked to selecting insurance or pensions
The theory assumes rational decision making is limited because of
An individual's thinking capacity
Availability of information
Lack of time available to gather all of the infromation and make a judgement
Too much choice can also cause people to make irrational decisions
E.g. when making choices about purchasing particular products in the supermarket, there may be too much choice making it difficult to make a decision
Bounded self control
3. Bounded Self-Control
The theory of bounded self-control suggests that individuals have a limited capacity to regulate their behaviour and make decisions in the face of conflicting desires or impulses
It recognises that self-control is not an unlimited resource that can be exercised endlessly without consequences
Humans are social beings influenced by family, friends and social settings. This often results in decision making which conforms to social norms but does not result in the maximisation of consumer utility
Bounded self control leads to decision making based on emotions, which may not yield the best outcome.
E.g people may indulge in impulsive spending, purchasing goods they didn’t originally intend to buy
Businesses use marketing to capitalise on the lack of bounded self-control of individuals when appealing to their target audience to maximise sales
E.g. Supermarkets place a range of items at the checkout register to encourage impulse purchases
Bounded selfishness
4. Bounded Selfishness
Behavioural economics challenges the view that economic agents always act within their own self interest
Bounded selfishness recognises that individuals do things for others without a direct reward
Altruism is the practice of acting selflessly helping others expecting nothing in return
Examples of bounded selfishness include
Donating money to charity
Organ donations
Voluntary work
Herd instinct
Herd instinct, or herd behaviour, is a key concept in IBDP Economics, falling under the realm of behavioural economics. It describes how individuals in a group tend to make decisions by following the actions of others, rather than relying on their own independent analysis or information
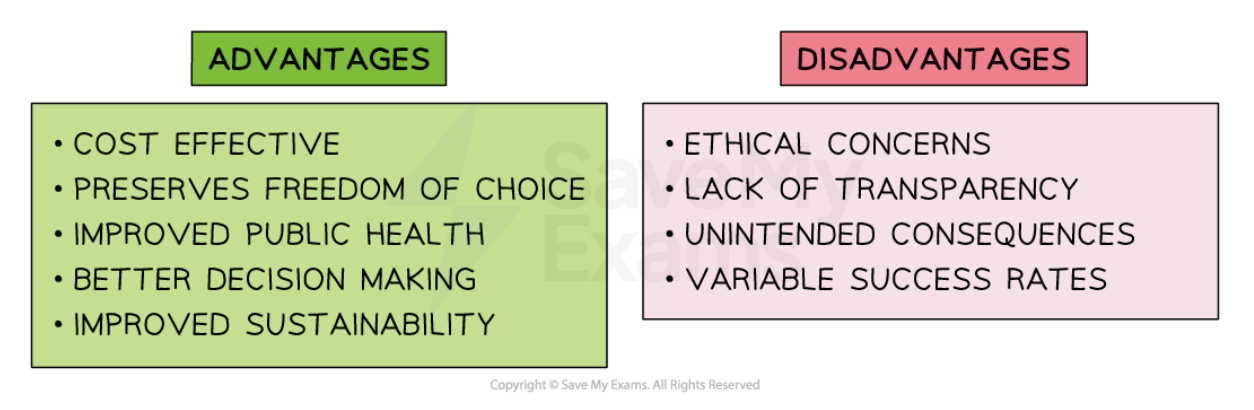
Nudge theory + Critic of nudge theory
Nudge Theory
Nudge theory is the practice of influencing choices that economic agents make, using small prompts to influence their behaviour
Richard Thaler coined the phrase ‘nudge theory’ and argued that firms should use nudges in a responsible way to guide and influence decision making
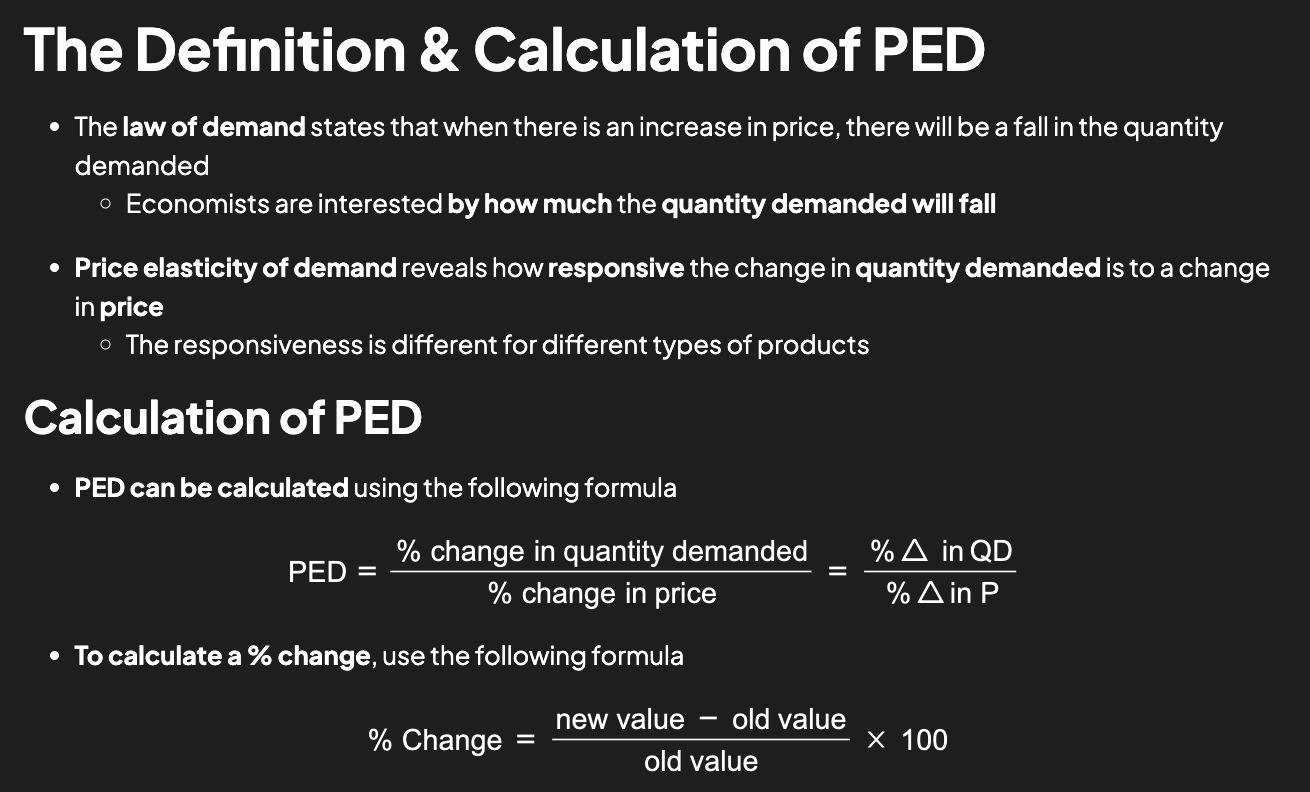
PED values and their implication on the elasticity of demand
0 = perfectly inelastic
demand is completely unresponsive to price changes
0-1 = relatively inelastic
quantity demanded is less than proportional to the the %∆ in Price
goods that are essential with little to no substitutes (gasoline)
addictive products
1 = unitary elastic, unit elastic
normal goods
1→ ∞ = relatively elastic
luxury goods
∞ = perfectly elastic
PED (&Formula)
Refers to how response demand is to a change in price to a good or service
(PED) Examples of inelastic, unit elastic, relatively elastic, and infinitely elastic goods or services.
Necessary goods such as gasoline are more inelastic as a change in price will not greatly alter the number of people that are willing and able to purchase (demand) as they are still needing to consume the good.
More elastic goods are goods that are greatly impacted by their price. Luxury goods have demand that is greatly elastic, as individuals are either more able or completely unable to consume luxury goods dependent on the price.
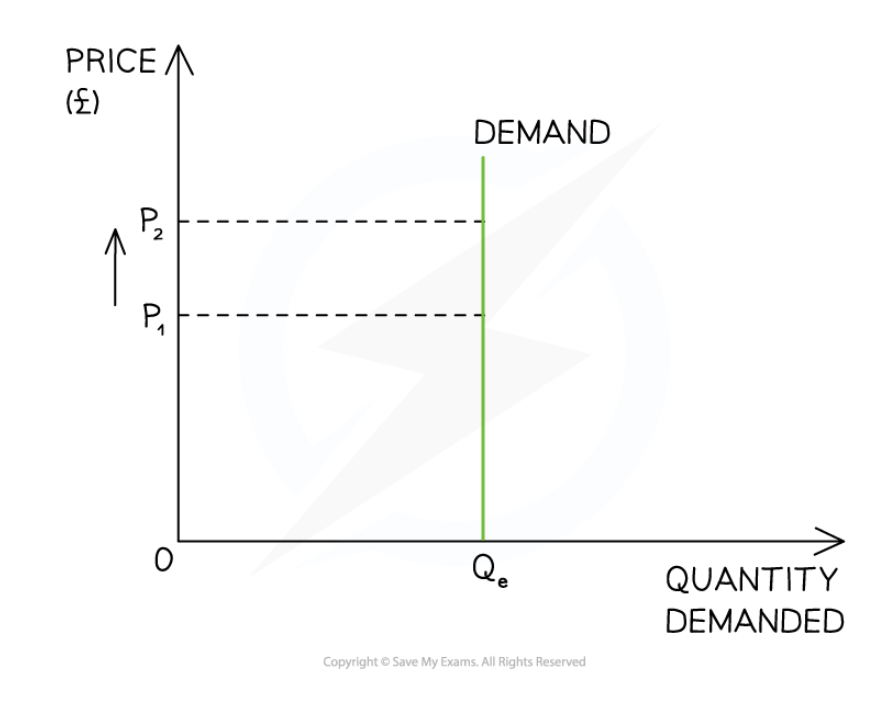
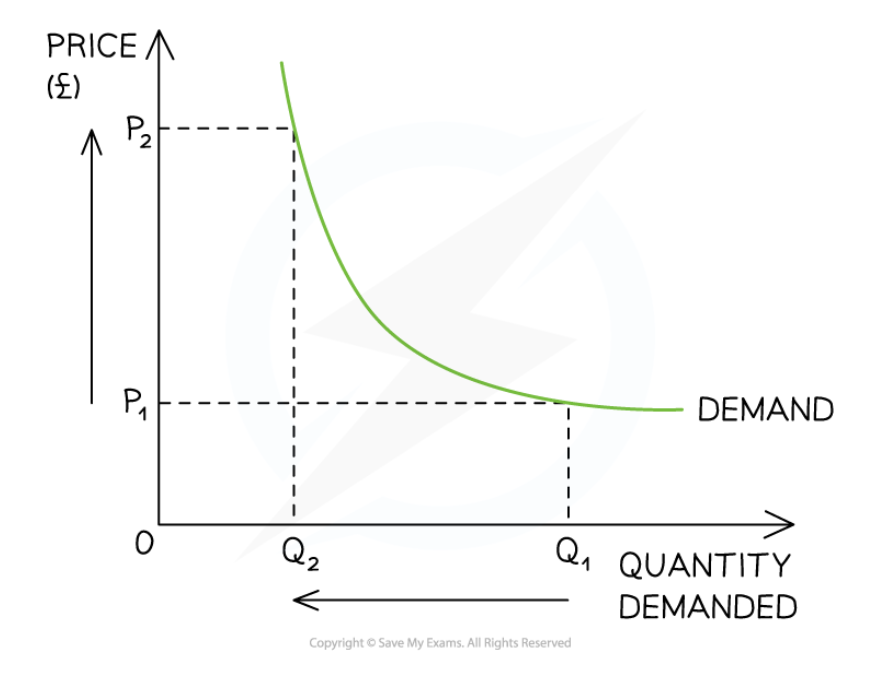
(PED) Price inelastic demand curve + Explanation
The QD is completely unresponsive to a change in P (very theoretical value e.g. heart transplant is extremely inelastic but possibly not perfectly)
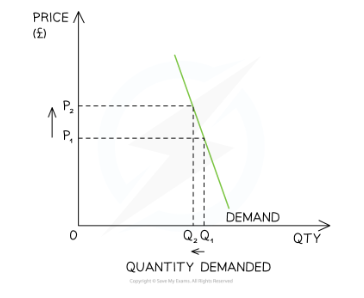
(PED) Relatively inelastic demand curve + explanation
The %∆ in QD is less than proportional to the %∆ in P (e.g. addictive products)
(PED) Unit elastic demand curve + explanation
The % ∆ in QD is exactly equal to the %∆ in P
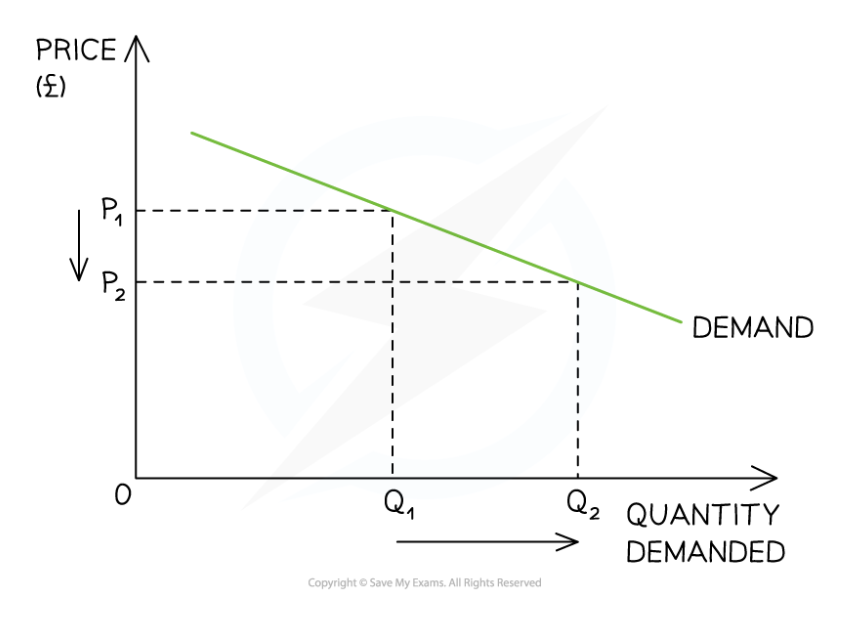
(PED) Relatively elastic demand curve + explanation
The %∆ in QD is more than proportional to the %∆ in P (e.g. luxury products)
Describe the condition for demand to be relatively price elastic
Describe the condition for demand to be relatively price inelastic
Describe the condition for demand to be unit elastic
Describe the condition for demand to be perfectly price elastic
Describe the condition for demand to be perfectly price inelastic
Demand relatively price elastic
PED > 1.
The %∆ in QD is more than proportional to the %∆ in P (e.g. luxury products)Demand is responsive to price changes. Usually applies to luxury goods or goods with many substitutes.
Demand relatiely price inelastic
The %∆ in QD is less than proportional to the %∆ in P (e.g. addictive products)
Demand is not very responsive to price changes. Common for necessities or goods with few substitutes.
Demand unit elastic
The % ∆ in QD is exactly equal to the %∆ in P
Total revenue is maximised at this point
Demand perfectly price elastic
The %∆ in QD will fall to zero with any %∆ in P (highly theoretical elasticity)
Demand is infinitely responsive. Represented by a horizontal demand curve.
Demand perfectly price inelastic
The QD is completely unresponsive to a change in P (very theoretical value e.g. heart transplant is extremely inelastic but possibly not perfectly)
Determinants of PED
Some products are more responsive to changes in prices than other products
The factors that determine the responsiveness are called the determinants of PED & include:
Availability of substitutes: good availability of substitutes results in a higher value of PED (relatively elastic)
Addictiveness of the product: addictiveness turns products into necessities resulting in a low value of PED (relatively inelastic)
Price of product as a proportion of income: the lower the proportion of income the price represents, the lower the PED value will be. Consumers are less responsive to price changes on cheap products (relatively inelastic)
Time period: In the short term, consumers are less responsive to price increases resulting in a low value of PED (relatively inelastic). Over a longer time period consumers may feel the price increase more and will then look for substitutes resulting in a higher value of PED (relatively elastic)
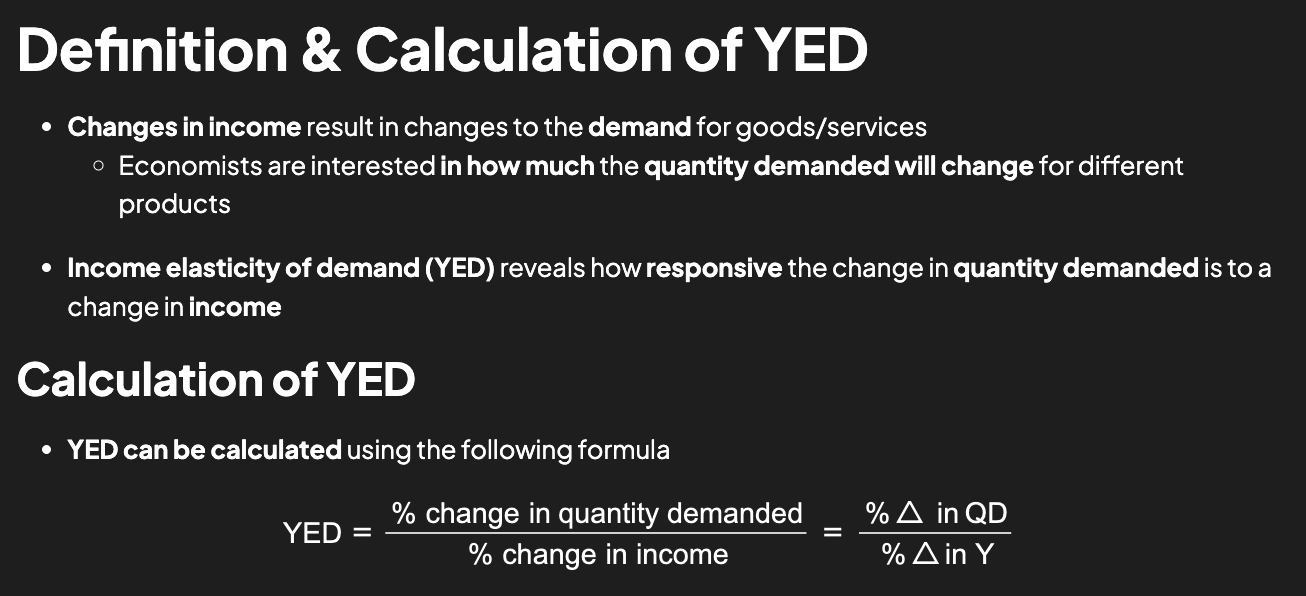
YED (&Formula)
Income elasticity of demand (YED) reveals how responsive the change in quantity demanded is to a change in income
Outline how we might interpret the income elasticity of demand (YED) with respect to the sum of 0.
A change in income has no effect on the quantity demanded of the good.
Types of goods with YED=0 would be necessities or those with no close substitutes.
Describe the revenue rule, which describes the result of a price increase or decrease on total revenue.
Tragakes: If a business wants to increase total revenue it must drop its price if demand is elastic, or increase its price if demand is inelastic. If demand is unit elastic the firm is unable to change its total revenue by changing price
The Revenue Rule shows how total revenue changes in response to price changes, depending on the price elasticity of demand (PED):
If PED > 1 (elastic), a price increase decreases total revenue.
If PED < 1 (inelastic), a price increase increases total revenue.
If PED = 1 (unit elastic), total revenue remains unchanged.
Show how price elasticity of demand varies between infinity and 0 along a linear demand curve that intercepts the Y and X axes.
Along a straight-line demand curve, PED decreases from infinity to zero as you move down the curve:
At the top (high price, low quantity), PED > 1 → elastic
At the midpoint, PED = 1 → unit elastic
At the bottom (low price, high quantity), PED < 1 → inelastic
This occurs even though the slope is constant.
On a supply and demand diagram show:
Perfectly inelastic supply
Perfectly elastic supply
Relatively elastic supply
Relatively inelastic supply
Unit elastic supply
Perfectly inelastic supply = straight line at a point. function x= __
Perfectly elastic supply = horizontal line at a point. function y= __
Relatively elastic supply = normal line with a slope<1
Relatively inelastic supply = normal line with a slope>1
Unit elastic supply = line with slope=1/1. function y=x
Value | Name | Explanation |
0 | Perfectly Inelastic | The QS is completely unresponsive to a |
0→1 | Relatively Inelastic | The %∆ in QS is less than proportional |
1→ ∞ | Relatively Elastic | The %∆ in QS is more than proportional |
∞ | Perfectly Elastic | The %∆ in QS will fall to zero with any %∆ in P. However, supply is unlimited at a particular price. This is a very theoretical scenario |
Outline the determinants of PES
Mobility of the factors of production
If producers can quickly switch their resources between products, then the PES will be more elastic. E.g. If prices of hiking boots increase and shoe manufacturers can switch resources from producing trainers to boots, then boots will be price elastic in supplyThe rate at which costs of production increase
It costs more to produce each additional unit of output (marginal cost). If the rate of the marginal cost increase is low, the quantity supplied will be more elastic. However, if marginal costs rise quickly, then the quantity supplied will be more inelasticAbility to store goods
If products can be easily stored then PES will be higher (elastic) as producers can quickly increase supply (e.g. tinned food products). An inability to store products results in lower PES (inelastic)Spare capacity
if prices increase for a product and there is a capacity to produce more in the factories that make those products, then supply will be elastic. If there is no spare capacity to increase production, then supply will be inelasticTime period
In the short run, producers may find it harder to respond to an increase in prices as it takes time to produce the product (e.g. avocados). However, in the long run they can change any of their factors of production so as to produce more
State that any supply curve that intercepts the origin will have a price elasticity of supply = 1 regardless of the gradient.
Term: Why does a supply curve from the origin have PES = 1?
Definition:
A supply curve that passes through the origin shows proportional changes in price and quantity supplied. For every % change in price, there is an equal % change in quantity supplied, so PES = 1 at all points, regardless of the slope.
• Outline why manufactured goods tend to have price elastic PES.
Term: Outline why manufactured goods tend to have price elastic PES
Definition:
Manufactured goods tend to have price elastic supply because:
Producers can respond quickly to price changes by increasing output.
Factors of production (FOP) can often be reallocated between different manufactured goods.
Production processes are more flexible, and inputs are more readily available.
Firms aim to maximise profit, so they adjust supply when prices rise to increase revenue.
→ This makes the quantity supplied more responsive to price changes (PES > 1).
• Outline why primary commodities tend to have price inelastic PES.
Primary commodities are raw materials (food, fuels, minerals) from natural resources
PES is lower due to the time needed for quantity supplied to respond to price changes.
(EX): If the price of wheat changes, farmers will likely not shift their production immediately resulting in a lower PES.
In the case of agriculture, farmers need at least one planting season to be able to respond to price signaling.
In the case of other primary products, such as oil, natural gas and minerals, time is needed to make the necessary investments and to begin production. Because of the costs involved, firms do not respond quickly to price increases, and wait for a serious shortage (excess demand) in the commodity to arise before they take actions to increase production.
• Outline the consequences of low PES for primary commodities in response to an increase or decrease in income.
Primary commodities have low price elasticity of supply (PES < 1) because supply cannot quickly adjust. When income changes, demand for these goods may shift, but supply remains unresponsive in the short run.
If income increases (especially for normal goods), demand rises → prices rise sharply → higher producer revenue but also price volatility.
If income falls, demand falls → prices drop steeply → producers suffer large income losses.
→ This leads to unstable incomes for producers, especially in developing countries, and contributes to market volatility.
These price fluctuations mean large revenue fluctuations, or unstable prices and revenues for the producers of primary commodities → low incentive to continue producing primary commodities → governments often needing to subsidise production (wheat farmers getting their product bought by the government at a higher price than market value)
Define imperfect or asymmetric information
Information gaps exist in nearly all free markets and distort market outcomes resulting in market failure
One of the underlying assumptions of a free market is that there is perfect information in the market
This means that buyers and sellers have exactly the same level of information about the good/service. This is called symmetric information
In many markets buyers and sellers have different levels of information. This is called asymmetric information. For example, there is asymmetric information in the used car market - sellers know more about the vehicle than the buyers
Asymmetric information distorts socially optimal prices and quantities in markets resulting in over-provision or under-provision of goods/services
For example, goods/services with dangerous side effects would be sold in lower quantities if buyers were aware of these effects (consider the VW emissions scandal). Fewer factors of production should be allocated towards producing these
Similarly, goods/services with extra benefits would be sold in higher quantities if buyers were aware of them. More factors of production should be allocated towards producing these
Define adverse selection and provide one example.
1. Adverse Selection
Occurs when the party with more information (typically the buyer) has an advantage in knowing their own risk profile as compared to the party offering the service or product
E.g. In insurance markets, adverse selection can occur if individuals with a higher likelihood of making a claim or having a pre-existing condition are more motivated to purchase insurance
This can lead to an imbalance in the risk pool, with a higher proportion of higher-risk individuals and insurers may need to raise premiums to compensate for the increased risk
This makes insurance less affordable for lower-risk individuals and potentially leads to a further concentration of higher-risk individuals in the pool
To reduce adverse selection, insurance companies may use various strategies such as risk-based pricing or medical underwriting to ensure that premiums accurately reflect the risk profile of the insured person
Adverse selection distorts the process by which the price and quantity of services are determined – leading to market failure