Effect size and Power - L9
1/39
There's no tags or description
Looks like no tags are added yet.
Name | Mastery | Learn | Test | Matching | Spaced |
|---|
No study sessions yet.
40 Terms
Significance testing - levels of significance - look at image
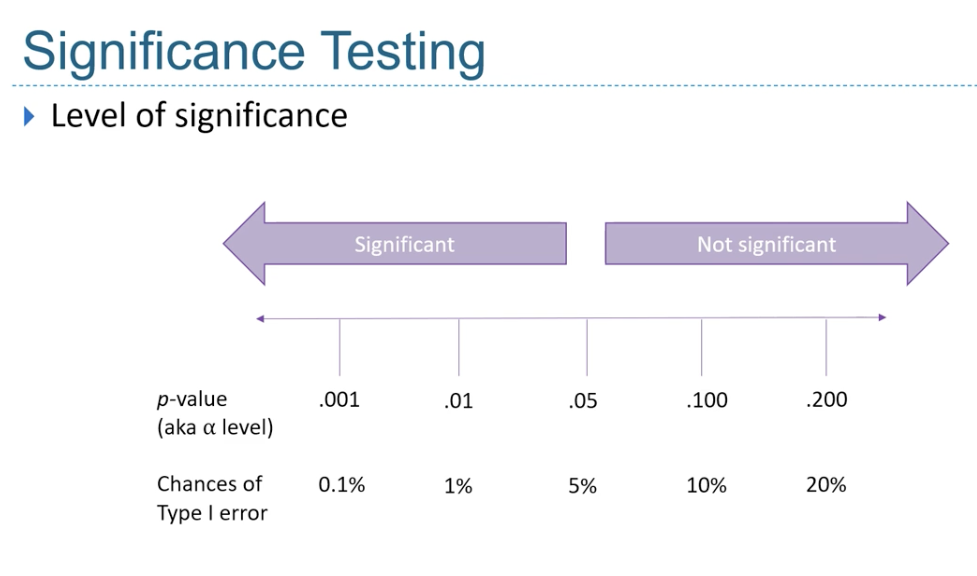
p value is the likelihood of us
observing a trend in the sample (H1) If there is not a trend in the population (H0)
significance level is also the proxy of
Committing a type 1 error
Is a significant results really meaningful?
With a sufficiently larger sample, a statistical test will almost always return a sig result
Significant result doesn’t mean a
meaningful result
We can use effect size to see if the significant results is..
meaningful
Effect size is a measure of the
magnitude/strength of a difference or relationship
effect size is
independent of sample size
Effect size helps its to quantify
practical significance e.g. the importance - can be compared across studies
Common effect size measures
Cohens d (t test)
Partial eta squared for anovas
Pearsons r (correlations)
Cramer’s V for chi squared
cohens d
measure of effect when we compare 2 groups (t tests)
Cohens d - interpretation
small - less than 0.2
Medium - 0.5
Large - 0.8
Partial eta squared
measure of effect sizes for anova - proportion of variance explained
eta squared intepretation:
0.01 = small effect
0.06 - med
0.13 - large effect
Sample size and effect size - when should we stop testing - before we have collected all the data
Resource constraints e.g. limited time/money
Sample size of previous research
Central limit theorem -
A priori power analysis
A priori power analysis -
work out how many p’s are needed to reliably detect an effect of a certain sample size or larger
Central limit theorem
distribution of sample becomes more normal as sample gets bigger. More than 30 = sufficient
Decision Errors - 4 types of decisions we can make
Acccpt Null and no effect in real world - correct d
Accept alternative H and there is a real world effect - correct d
Accept Hl and there’s no real world effect - Type I error
Accept null and theres a real world effect - Type II error
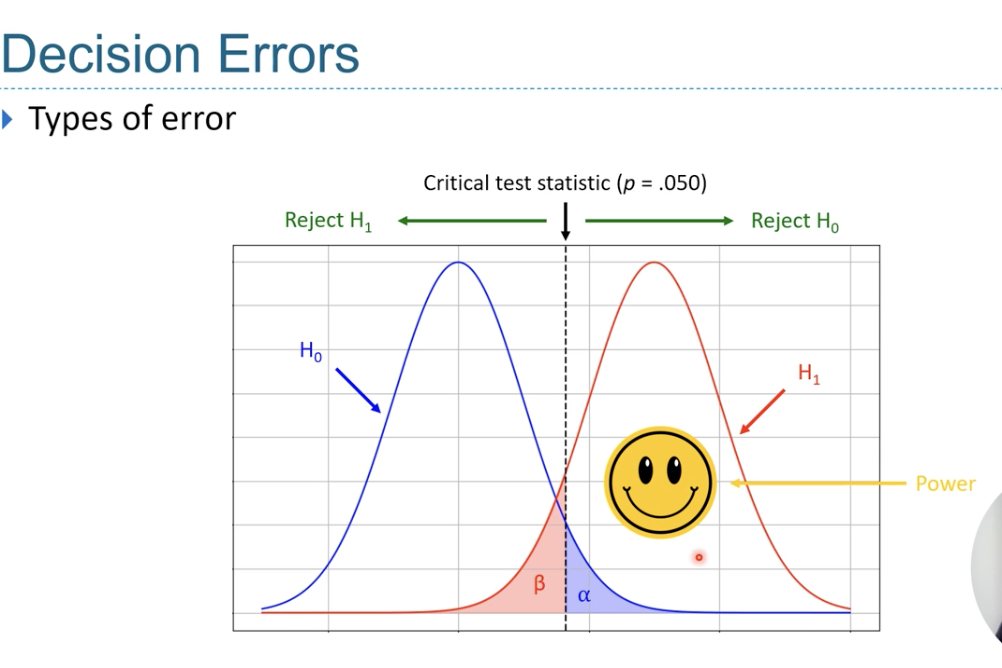
alpha level is
the probability of making a type I error (set at 0.05)
Beta level is the probability of making a
Type II error - usually set at (0.2)
Look at image - displaying that alpha and beta levels -
Power = 1 - beta
Power
the ability to detect a sig effect if H1 is true
power equation
1 - beta
If beta is set at 0.20 then
power will be 0.8 (80%)
if there is a genuine effect, there is a 20% chance of failing to reject H0, and 80% chance to successfully reject H0.
Power helps us make sense of
results that are not significant or results that are statistically significnat but not practically significant
Power depends on 3 parameters
alpha level - always set at 0.50
Effect size - larger the effect, the more likely that the effect will be detected - more power
Sample size - larger the more likely the effect will be detected = more power
The more lenient the alpha level, the more
statistical power the test would have
beta increases when the effect is
small , meaning a decrease in power. Larger effect size = higher the power
the larger the sample size the more
power
How to increase power: significance level
set a less stringent sig level (not normally done in psych) or consider a 1 tailed test ( but this should be based on prev research)
How to increase power: increase effect size
by increasing the predicted difference between the population means (using more explicit instructions in the experiment/give more practice time)
or, decrease population standard deviation (use more controlled environment e.g. lab study rather than natural observation, clear procedure)
How to increase power: increase sample size
recuit more participants
Power analysis with the 4 parameters (Power, sig level, effect size and sample size) we can
given any 3 estimate the 4th - we often don’t have power (use post hoc power analysis)
Power analysis p- we can also determine the sample size to achieve certain level of power (0.8) with
a specific effect size and significance level - A priori power analysis
Post hoc power analysis ….. we can look at whether a non - sig test result is
likely to be due to a lack of power
post hoc because it is concrete after data collection
A priori power analysis - determine the required..
sample size before conducting the test
A priori - as it is conducted before data collection - we need the other 3 parameters
Effect size for A priori power analysis
This is the size of the effect that you would like to be able to reliably detect
Effect size for A priori power analysis - determine via Previous/ pilot study but…
exact effect size from a pervious/ pilot study
Assumes the conditions to be similar enough to your study
Effect size for A priori power analysis - determine via general bench marks
effect size benchmarks (e.g. small, med, large)
Helpful when previous studies do not provide a consistent effect size - but less precise