Chapter 1
5.0(1)
Card Sorting
1/42
Earn XP
Last updated 2:14 AM on 9/6/23
Name | Mastery | Learn | Test | Matching | Spaced | Call with Kai |
|---|
No analytics yet
Send a link to your students to track their progress
43 Terms
1
New cards
Statistics \=
Statistics \= Basic Math + Context + Interpretation
2
New cards
Variables
Characteristics that can change or take on different values
3
New cards
Most research begins with a _
Most research begins with a general question about the relationship between 2 variables for a specific group
4
New cards
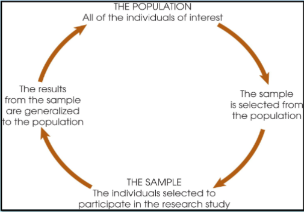
Population
An entire group of individuals
5
New cards
Label the 2 variables and population in the question: What’s the relationship between weekend drinking and academic performance among 1st year college students
weekend drinking is variable 1, academic performance is variable 2, 1st year college students is population
6
New cards
Sample
group of individuals selected to represent the population as usually populations are too large to examine the entire group

7
New cards
Inferential Statistics
Use sample data to make general conclusions about population
8
New cards
An example of inferential statistics
Presidential polling
9
New cards
Methods for organizing data
Tables or graphs
10
New cards
Methods for summarizing data
Descriptive values
11
New cards
Descriptive value for a population
parameter (the p’s go together)
12
New cards
Descriptive value for a sample
statistic (the s’s go together)
13
New cards
Sampling error
discrepancy between a sample statistic and its population parameter
14
New cards
Data
measurements obtained in research
15
New cards
Goal of statistics
to help researchers organize and interpret data
16
New cards
Discrete variables
consist of indivisible categories
17
New cards
Example of discrete variable
dice roll, score of football game, number of tickets sold
18
New cards
Continuous variable
categories that are infinitely divisible into any unit the researcher chooses
19
New cards
Example of continuous variable
time, weight, length
20
New cards
4 major scales of measurement
the scale chosen determines the types of questions that can be answered with the data: nominal, ordinal, interval, and ration
21
New cards
Nominal scale
an unordered set of categories identified by name only
22
New cards
Ordinal scale
an ordered set of categories, tells you the direction of difference between two individuals
23
New cards
Interval scale
an ordered series of equal sized categories, identify the direction and magnitude of a difference, zero point is located arbitrarily
24
New cards
Ratio scale
an interval scale where a value of zero indicates none of the variable, identify the direction and magnitude of differences
25
New cards
Which of the four levels of measurement categories and labels variables
Nominal, ordinal, interval, ratio
26
New cards
Which of the four levels of measurement ranks categories in order
Ordinal, interval, ratio
27
New cards
Which of the four levels of measurement has known equal intervals
Interval, ratio
28
New cards
Which of the four levels of measurement has a true or meaningful zero
Ratio
29
New cards
Goal of correlational studies
determine the strength and direction of the relationship between two variable
30
New cards
Correlational studies
uses observations of the two variables as they exist naturally
31
New cards
Correlation \________ causation
Correlation does not equal causation
32
New cards
Experiments
examine the relationship between 2 (or more) variables by changing one variable and observing the effects on the other variable
33
New cards
Independent Variable
a condition or event manipulated by experimenter (I decide)
34
New cards
Dependent Variable
an aspect of behavior thought to be affected by the independent variable (Depends on what I decide)
35
New cards
Nonexperimental studies
similar to experiments because they also compare groups of scores, do not use a manipulated variable to differentiate groups, the IV is a pre existing participant variable or a time variable
36
New cards
“X” or “Y” indicates
individual measurements or score obtained
37
New cards
“N” indicates
Number of individuals in a data set for a population
38
New cards
“n” indicates
Number of individuals in a data set for a sample
39
New cards
P in PEMDΣAS
calculations within parentheses are first
40
New cards
E in PEMDΣAS
exponents are second
41
New cards
MD in PEMDΣAS
multiplying and dividing are tied for third and must be completed from left to right
42
New cards
Σ in PEMDΣAS
Forth is summation with the Σ notation
43
New cards
AS in PEMDΣAS
Finally the remaining adding and subtracting is completed from left to right