GW Blok 6 Seminar 4.1 Simple linear regression including hypothesis testing for regression coefficients
1/6
There's no tags or description
Looks like no tags are added yet.
Name | Mastery | Learn | Test | Matching | Spaced | Call with Kai |
|---|
No analytics yet
Send a link to your students to track their progress
7 Terms
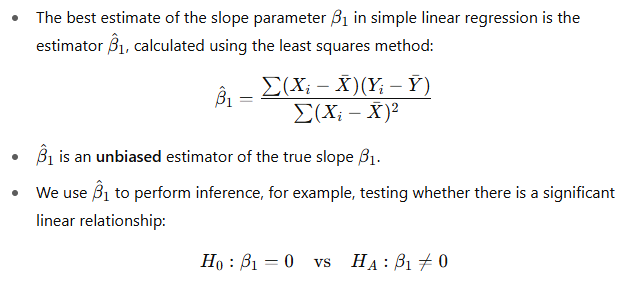
What is the best estimate?
What is simple linear regression?
To determine whether the slope coefficient β1 is significantly different from zero.
H0 = β1 = 0
Ha = β1 ≠ 0
β1 = 0 → variables X does not explain any linear variation in Y, the variables are not related → horizontal line
To test if the slope is significantly different from zero at population level, use CI, p-value or t-statistic
What are the assumptions in linear regression?
Linear relation between X and Y
Independent observations
Body temperature and age is observed per person → implies independence
Constant variance of Y for the whole range of X
Those are the conditions to be met, but we don’t test this during the exam
For any value of X, Y is normally distributed
Those are the conditions to be met, but we don’t test this during the exam
Then β1 hat follows an approximately normal distribution or t-distributed with n-2 degrees of freedom
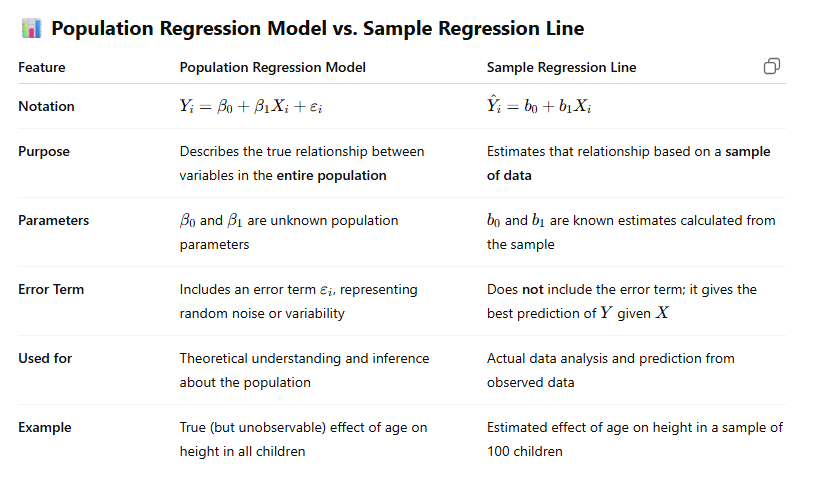
What is the difference between the population regression model and the sample regression line?
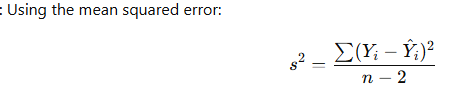
How is the error variance σ2 estimated in regression?
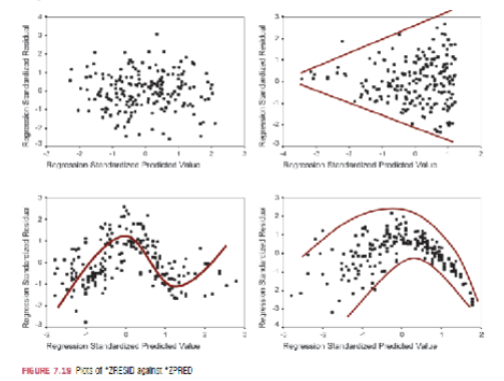
Why should you always plot your data before running a regression?
Because visual inspection can reveal outliers, nonlinear patterns, heteroscedasticity, and data errors that summary statistics might miss.
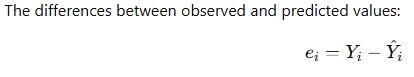
What are residuals in regression?