TRADING
1/17
There's no tags or description
Looks like no tags are added yet.
Name | Mastery | Learn | Test | Matching | Spaced | Call with Kai |
|---|
No analytics yet
Send a link to your students to track their progress
18 Terms
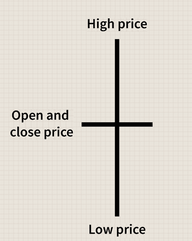
DOJI
short candlestick with little to no body indicating indecision, weakness and trend reversal
open and closes at nearly the same price
LONG LEGGED DOJI
long upper and lower shadows indicating uncertainty
ex: market rallied and sold off significantly but neither position held as market opened and closed in the same spot
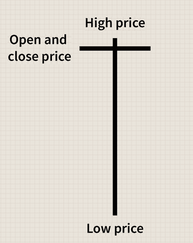
DRAGONFLY DOJI
long lower shadow
greater significance in a downtrend as it has bullish indications
sellers were able to drive price lower but were unable to hold price down
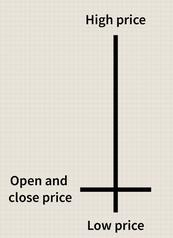
GRAVESTONE DOJI
long upper shadow and no lower shadow
uptrend is running out of steam
indicates buyers pushed price up but were unable to hold the market at higher levels, conceding to sellers
HANGING MAN
bearish trend reversal signal seen in uptrend
long lower shadow is generally bullish
indicates demand forced price into upper third price range for that period
confirmation of trend reversal: the next candle should close below hanging man’s real body (ex: engulfing or piercing pattern)
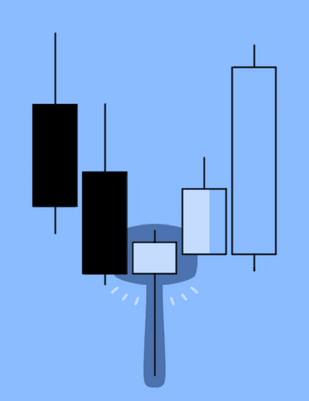
HAMMER PATTERN
bullish trend reversal signal appearing in downtrend
hammers out a base at bottom of downtrend
confirmation: followed by bullish candle, increased volume
INVERTED HAMMER
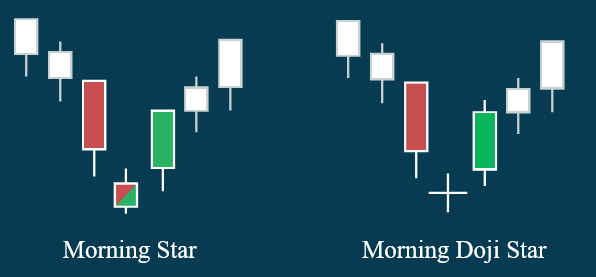
MORNING STAR
bullish bottom reversal pattern
three candlestick pattern
bearish candle confirming downtrend
star, indicating weakness
long green candle providing bullish confirmation
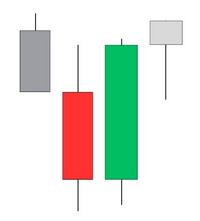
EVENING STAR
bear top trend reversal pattern of an uptrend
three candlestick pattern
large green bullish candle
star with short body, indicating weakness
large red bearish candle
BULLISH ENGULFING PATTERN
trend reversal pattern where the second candle completely engulfs previous candle’s body
appears in down trend
red candle at bottom of down trend, next candle is green and completely engulfs the red candle
BEARISH ENGULFING PATTERN
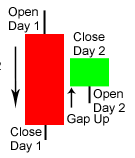
BULLISH HARAMI
occurs at bottom of down trend
large red candle on day one followed by smaller red candle or bullish candle on day two
prices gapped up on day two and price was held up and unable to move lower back to day one’s bearish close
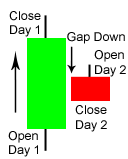
BEARISH HARAMI
occurs at top of uptrend
large green candle on day one followed by smaller bearish or bullish candle on day two
prices gapped down on day two and were unable to move higher back to day one’s close
SHOOTING STAR
TWEEZERS TOP
TWEEZERS BOTTOM
PIERCING PATTERN
DARK CLOUD COVER PATTERN