Correlations
1/14
There's no tags or description
Looks like no tags are added yet.
Name | Mastery | Learn | Test | Matching | Spaced | Call with Kai |
|---|
No analytics yet
Send a link to your students to track their progress
15 Terms
Correlational studies
the movement and direction of co-variables in response to each other is measured
measures how strong the relationship is between 2 or more variables
there is no claim of cause and effect relationship , but after a correlational study further research may be done to determine if one variable affects the other
e.g. cigarette-smoking and lung cancer. It was noticed that there was a positive correlation between the number of cigarettes smoked and likelihood of getting lung cancer. Later, this research was extended and a cause and effect relationship was found.
Types of correlation
positive, negative, zero
Positive correlation
as one variable increases, so does the other
e.g height and shoe size
Negative correlation
as one variable increases the other decreases
e.g student GCSE grades and the amount of time they are absent from school
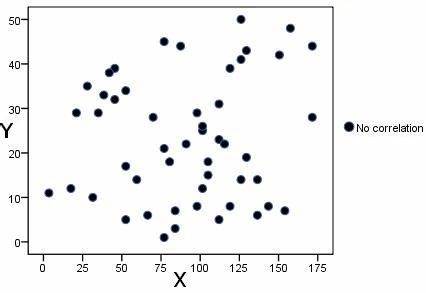
Zero correlation
when a correlational study finds no relationship between variables
e.g. the amount of rainfall in Wales and number of people who have read the Lord Of The Rings Trilogy
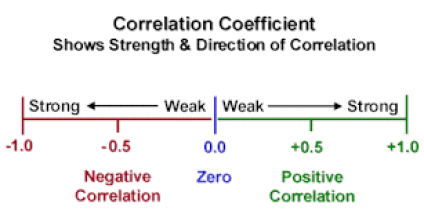
Correlation coefficient
measures the strength and nature (positive or negative) of the relationship between the co-variables
ranges between -1.0 and +1,0
the nearer the number is to -1.0 or +1.0 the stronger the correlation
A perfect positive correlation = +1.0
A perfect negative correlation = -1.0
scattergram / scattergraph
shows the correlation between 2 sets of data by plotting points to represent each pair of scores. It indicates the degree and direction of the correlation between the co-variables (one on y-axid and one on x-axis)
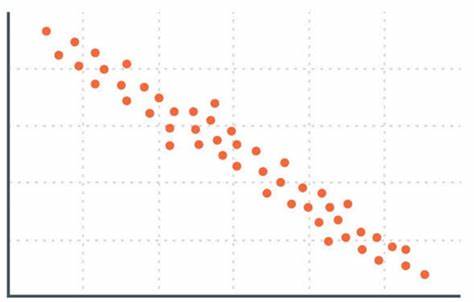
strong negative correlation scattergram
weak negative correlation scattergram
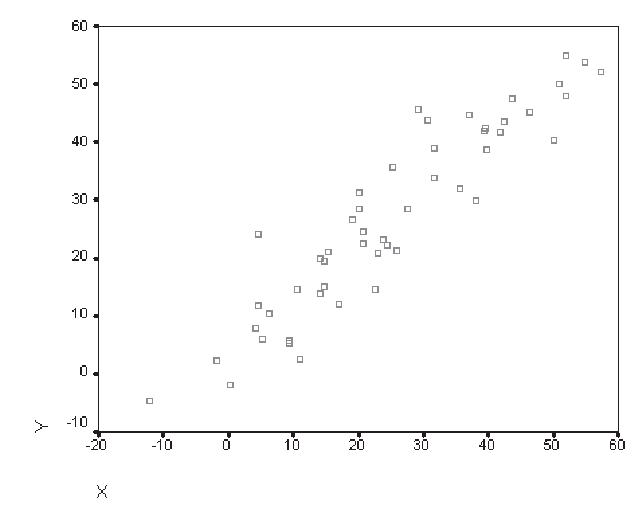
strong positive correlation scattergram
weak positive correlation scattergram
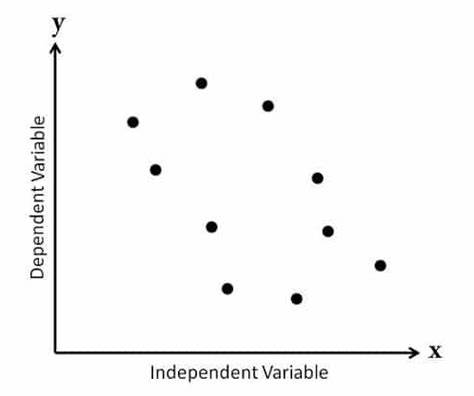
no correlation scattergram
strengths of correlational techniques
can be used when a lab experiment would be unethical as the variables are not manipulated, only correlated
measures the strength of a relationship between variables, allowing for further research to be conducted
Economical - no need for a controlled environment and can use secondary data
limitations of correlational techniques
not possible to establish cause and effect relationships through conducting a correlation
can only identify linear relationships and not curvlinear
3rd variable - may explain relationship between co-variables