W2 : demand and supply
1/15
There's no tags or description
Looks like no tags are added yet.
Name | Mastery | Learn | Test | Matching | Spaced |
|---|
No study sessions yet.
16 Terms
market
the buyers of a group determine the demand for the product
The sellers as a group determine the supply of the product
competitive market:
Price and quantity are determined by all buyers and sellers as they interact with the marketplace
buyers want to buy for less, sellers want to sell for more
revenue
price X quantity
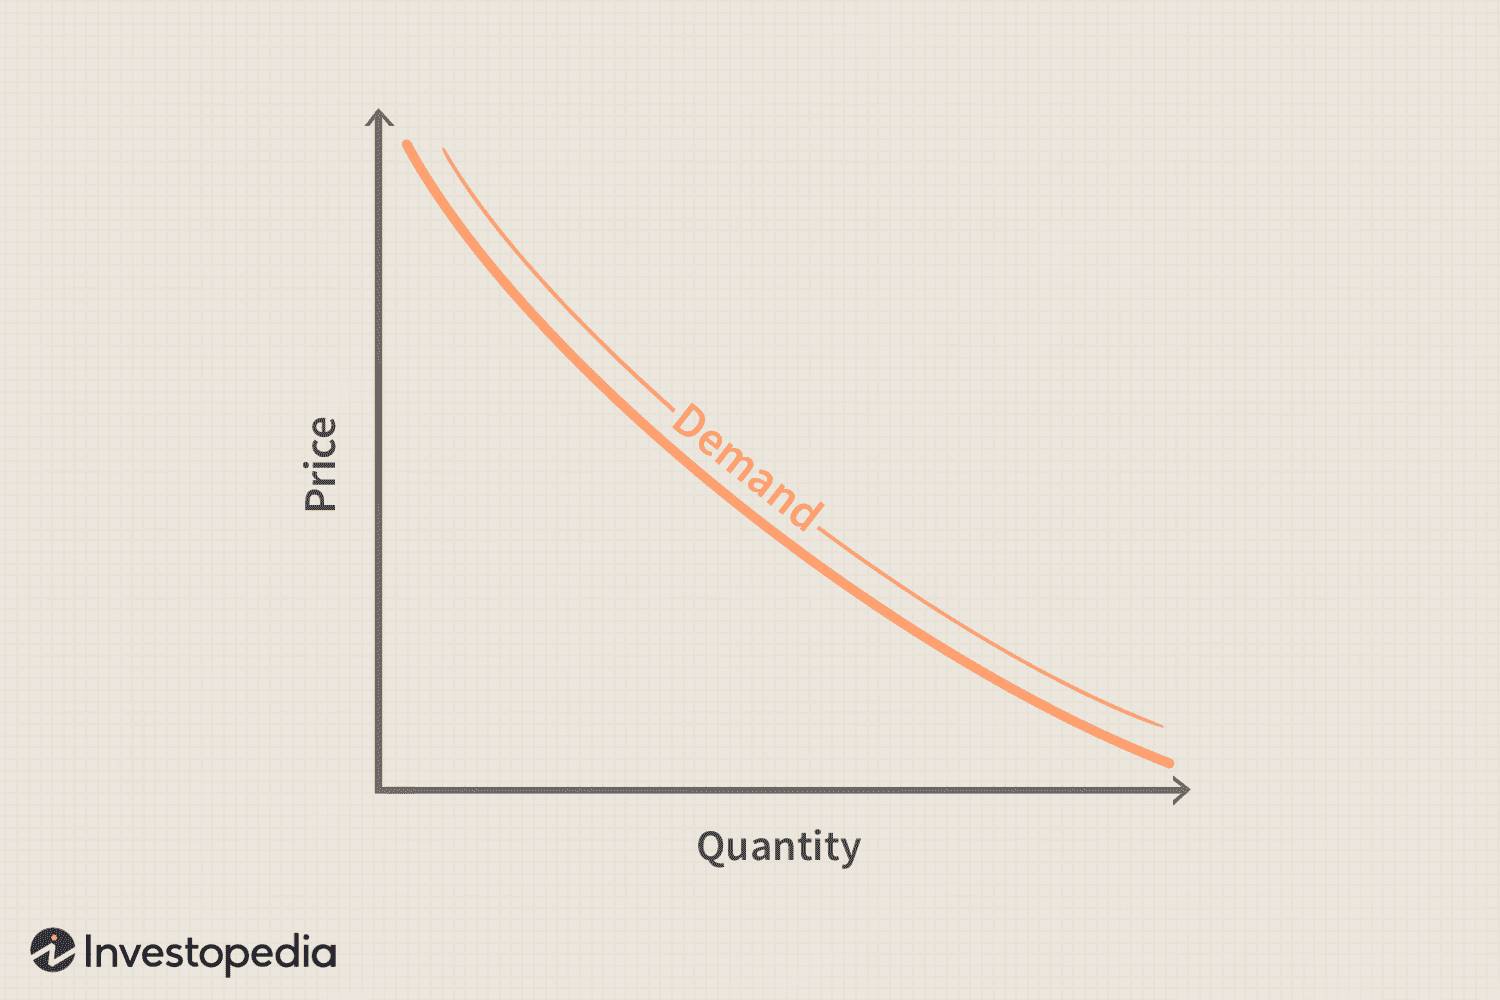
law of demand
the lower the price, the more product/ services bought
demand curve
downward slope ,graph that shows the relationship between the price of a good or service and the quantity demanded within a specified time frame.
movement along demand curve
Increase - demand curve shifts to the right
Decrease - demand curve shifts to the left
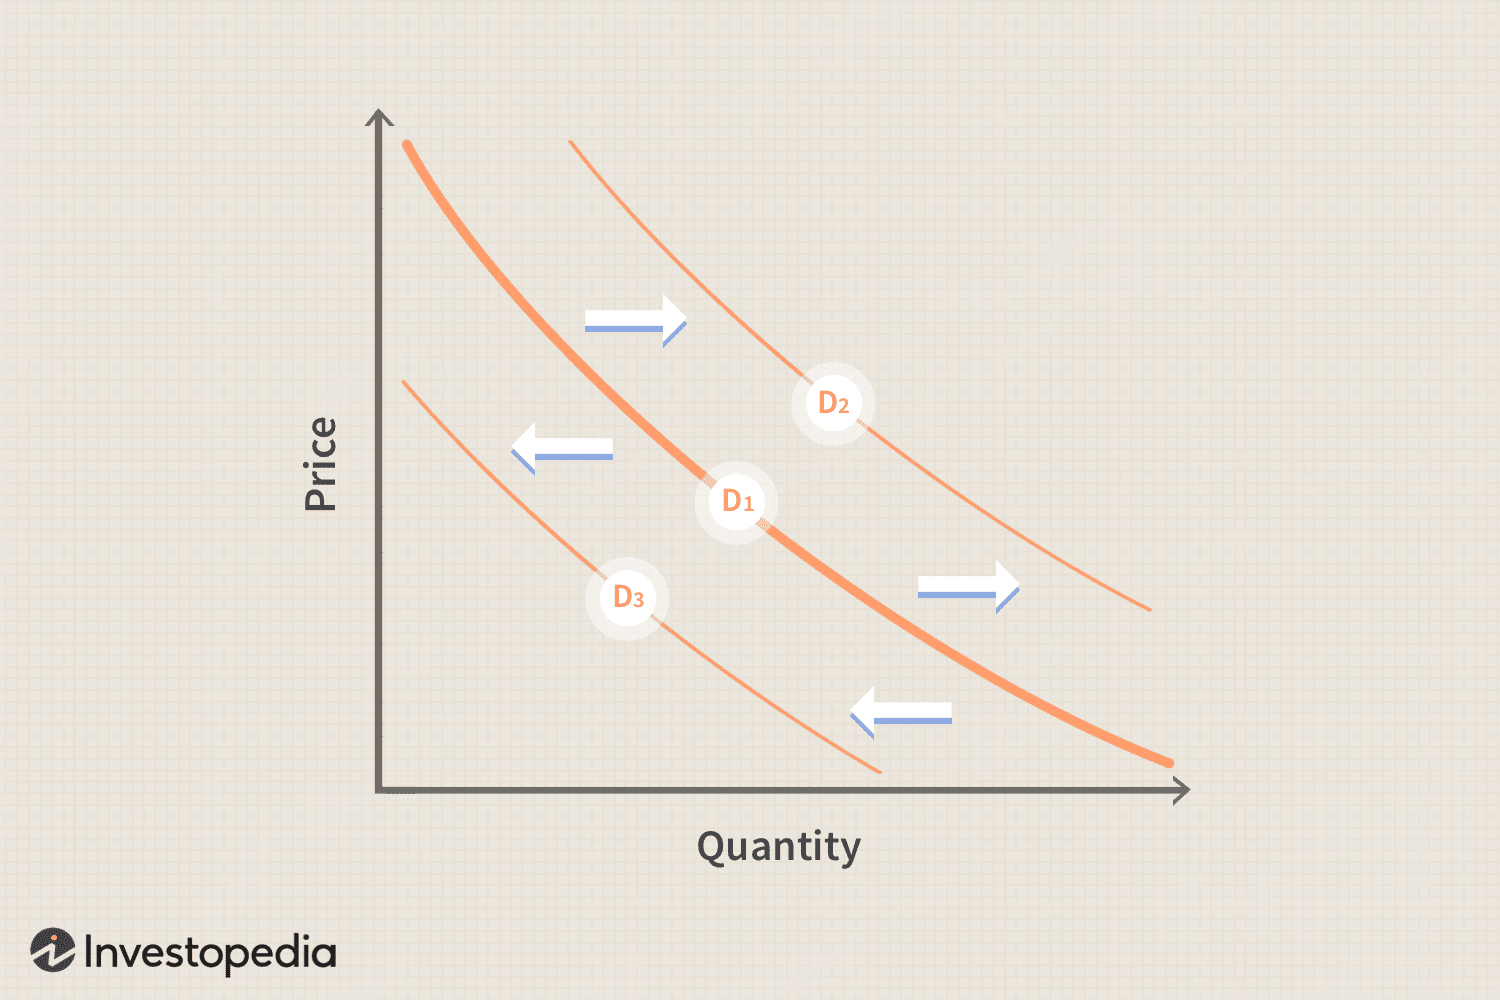
causes of shifts in demand curve
subsitites ( ex pepsi goes up can buy coke instead)
compliments: if one does down so does other
trends, # of buyers,& adds
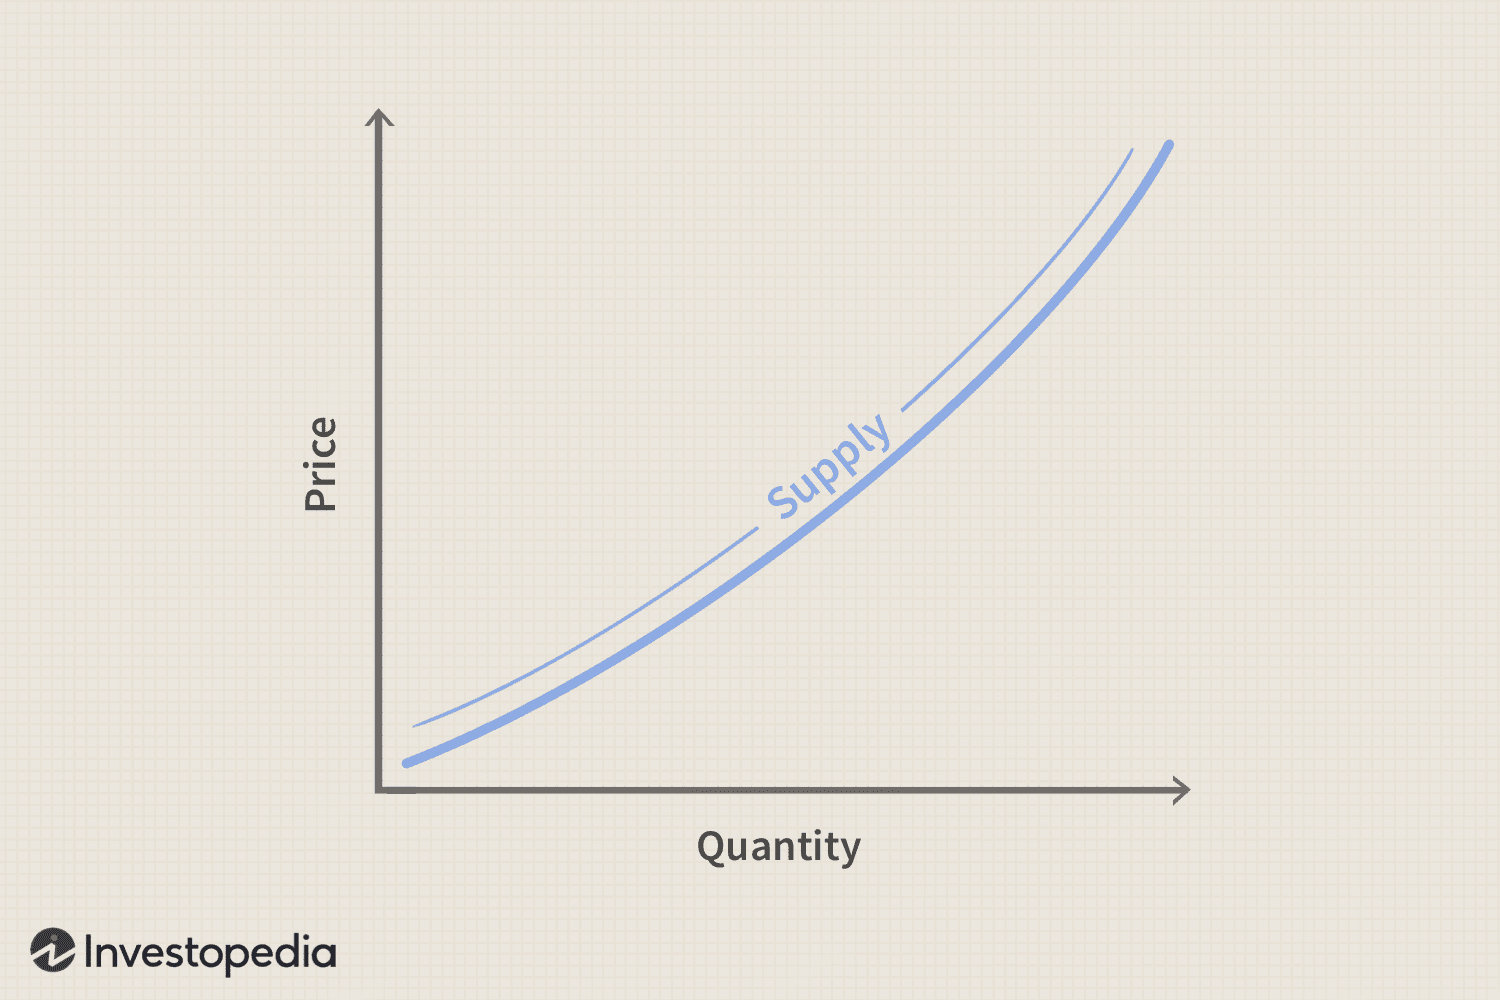
law of supply
will want to sell more products if price is higher
supply curve
upward, shows relationship of price and quantity
shifts in supply curve
increase - supply curve shifts to the right (down )
decrease - supply curve shifts to the left (up)
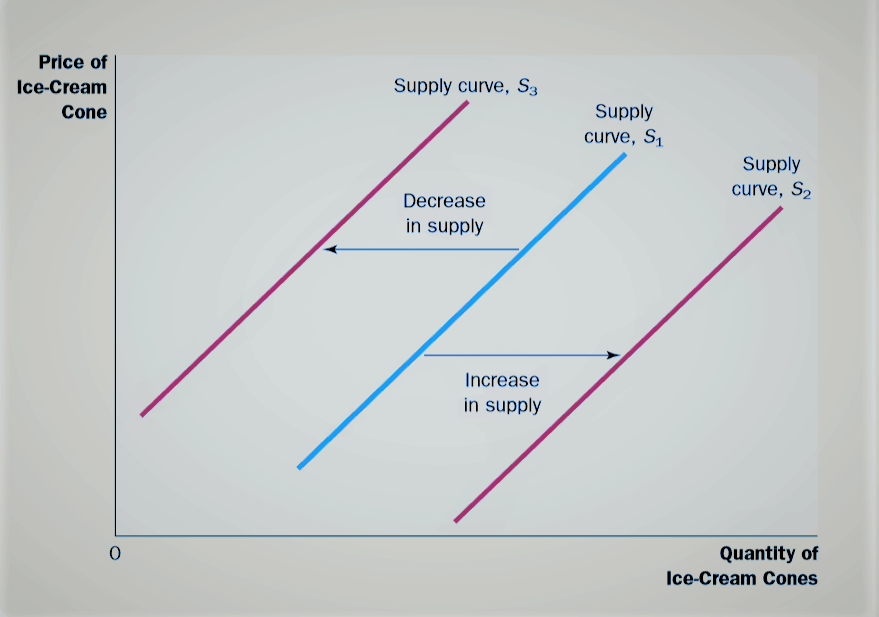
causes for shifts in supply curve
tech, price expectations, # of sellers , events
Equillibrium
quantity supplied equals quantity demanded
eq price
market price where the quantity of goods supplied is equal to the quantity of goods demanded.
eq quantity
when there is perfect amt of product
dis equilibrium
either to much or to little, need price to match demand and demand match price
change in demand means..
that the entire demand curve shifts either left or right.