Old Material - QA, Liver/Portal, Mesenteric, Renal, Physiologic Testing, Venous Insufficiency/PPG/APG/Non-Atherosclerotic Pathologies
1/183
There's no tags or description
Looks like no tags are added yet.
Name | Mastery | Learn | Test | Matching | Spaced | Call with Kai |
|---|
No analytics yet
Send a link to your students to track their progress
184 Terms
Gold Standard
Well-established, reliable diagnostic method used as a reference
True Positive (TP)
Those who have disease and a positive test
Ultrasound shows disease, gold standard shows disease
True Negative (TN)
Those who do not have disease and a negative test
Ultrasound shows no disease, gold standard shows no disease
False Positive (FP)
Those who do not have disease and a positive test
Ultrasound shows disease, gold standard shows no disease
False Negative (FN)
Those who have disease and a negative test
Ultrasound shows no disease, gold standard shows disease
Sensitivity
Ability of test to correctly detect patients with disease compared to the gold standard - positive sonogram with positive gold standard
Sensitivity Formula
Number of true positive tests
Number of all positive tests by gold standard
Specificity
Ability of test to correctly detect patients without disease compared to the gold standard - negative sonogram with negative gold standard
Specificity Formula
Number of true negative tests
Number of all negative tests by gold standard
Positive Predictive Value (PPV)
Probability that a positive test result reflects the actual presence of disease
Portion of patients with a positive test that have disease
Positive Predictive Value (PPV) Formula
Number of true positive tests
Number of all positive noninvasive tests
Negative Predictive Value (NPV)
Probability that a negative test result reflects the actual absence of disease
Portion of patients with a negative test that do not have disease
Negative Predictive Value (NPV) Formula
Number of true negative tests
Number of all negative noninvasive tests
Accuracy
Degree of closeness of a test result to the actual value
Percentage of overall correct results
Must lie between sensitivity & specificity and PPV & NPV
Accuracy Formula
Total number of correct tests
Total number of all tests
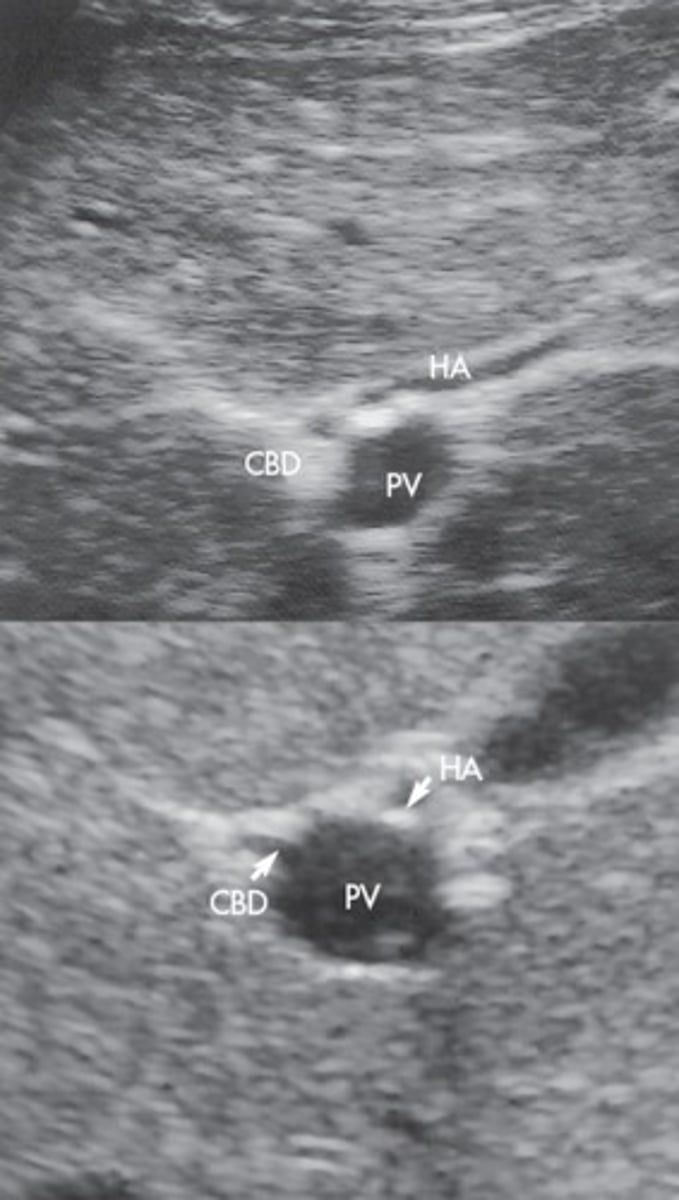
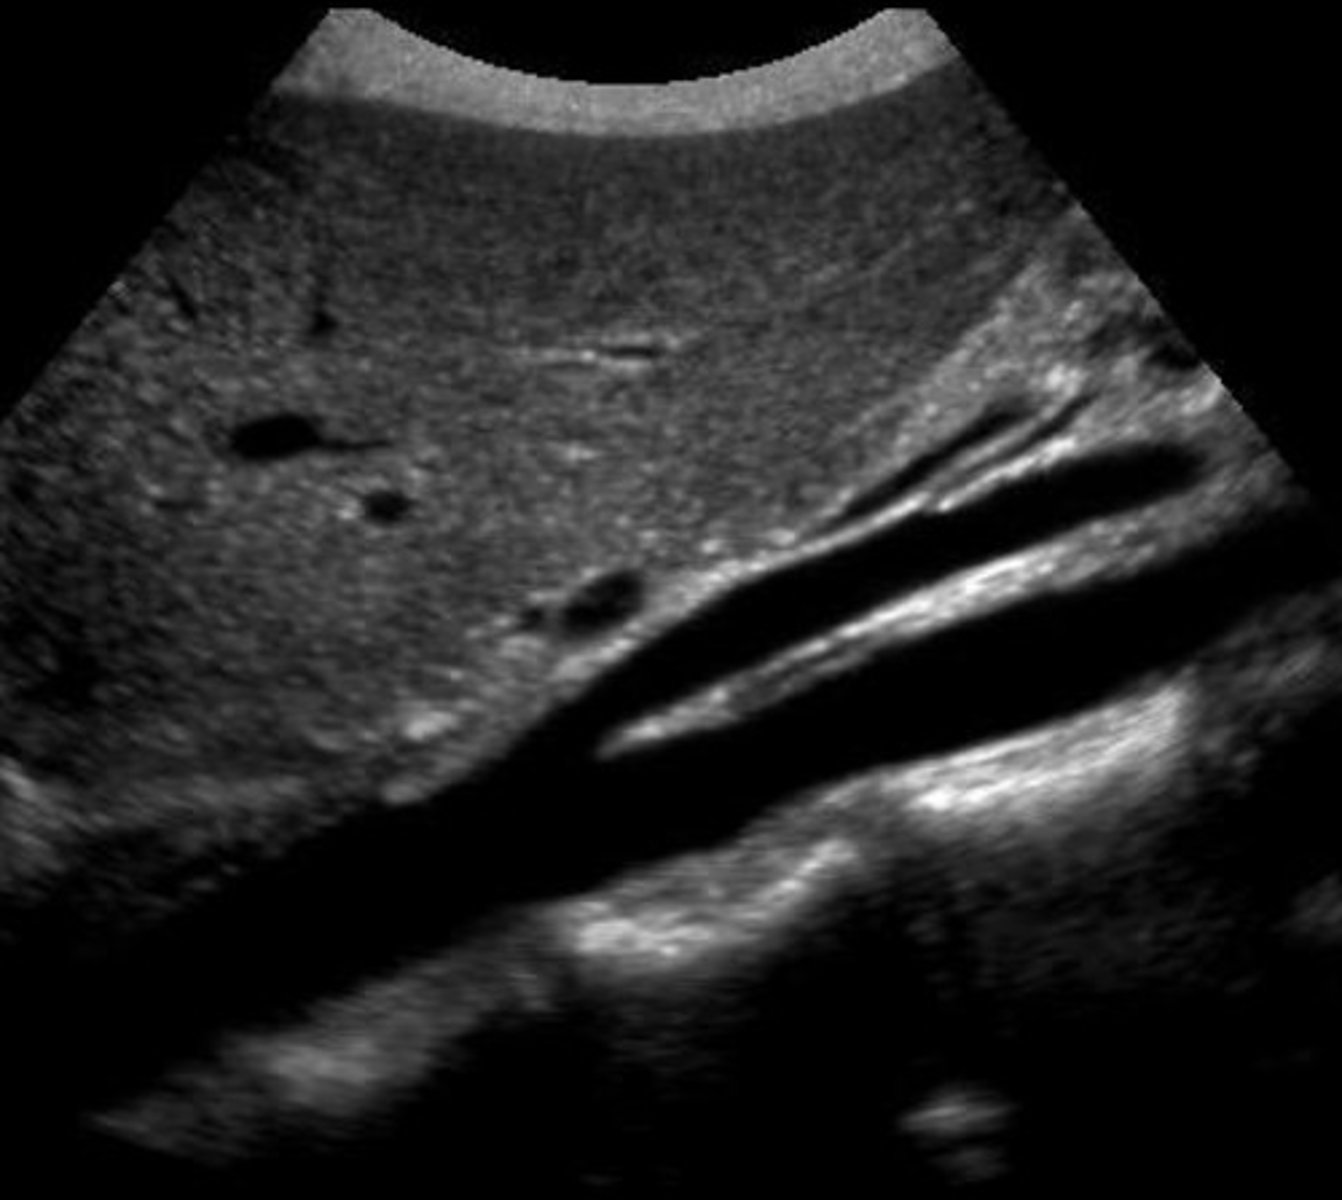
Pre-Hepatic/Inflow Vessels
Portal Vein
Hepatic Artery
Post-Hepatic/Outflow Vessels
Hepatic Veins
IVC
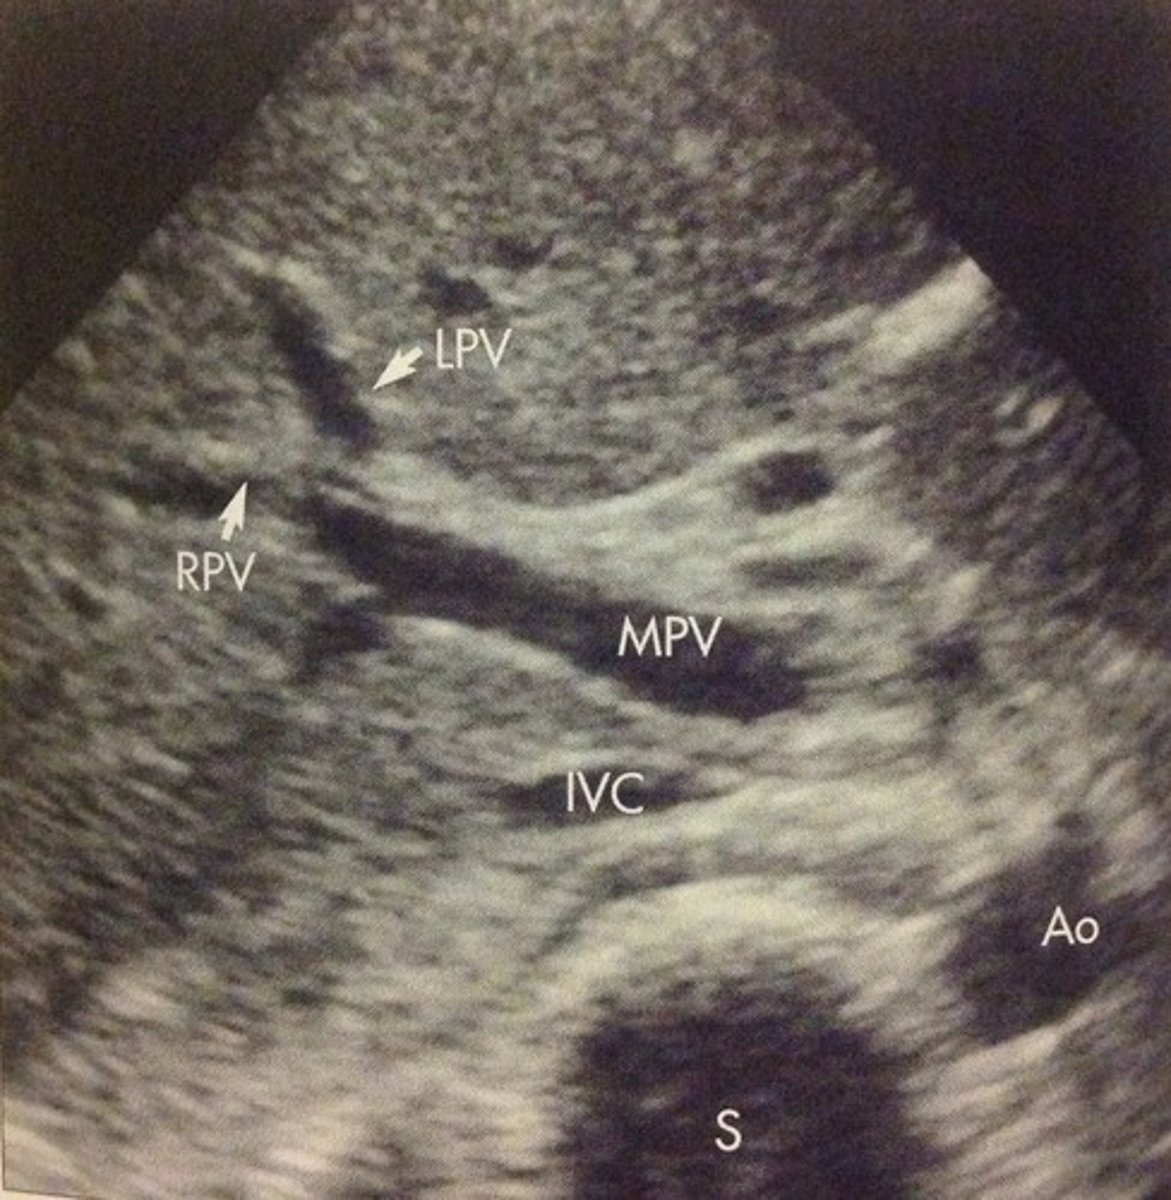
Main Portal Vein
Junction of splenic vein & SMV
Brings blood from bowel and spleen into liver
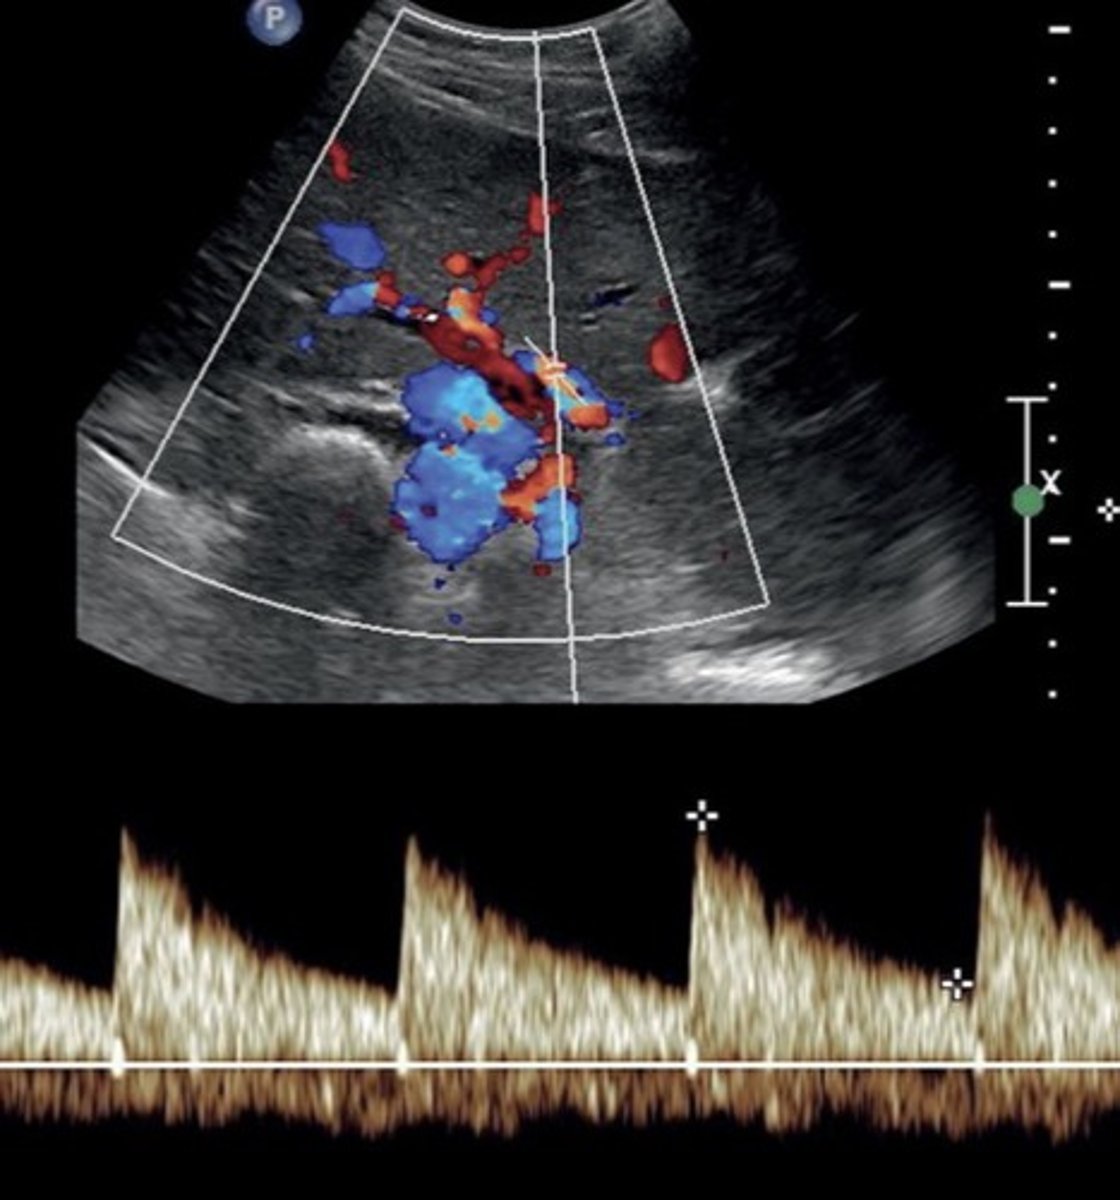
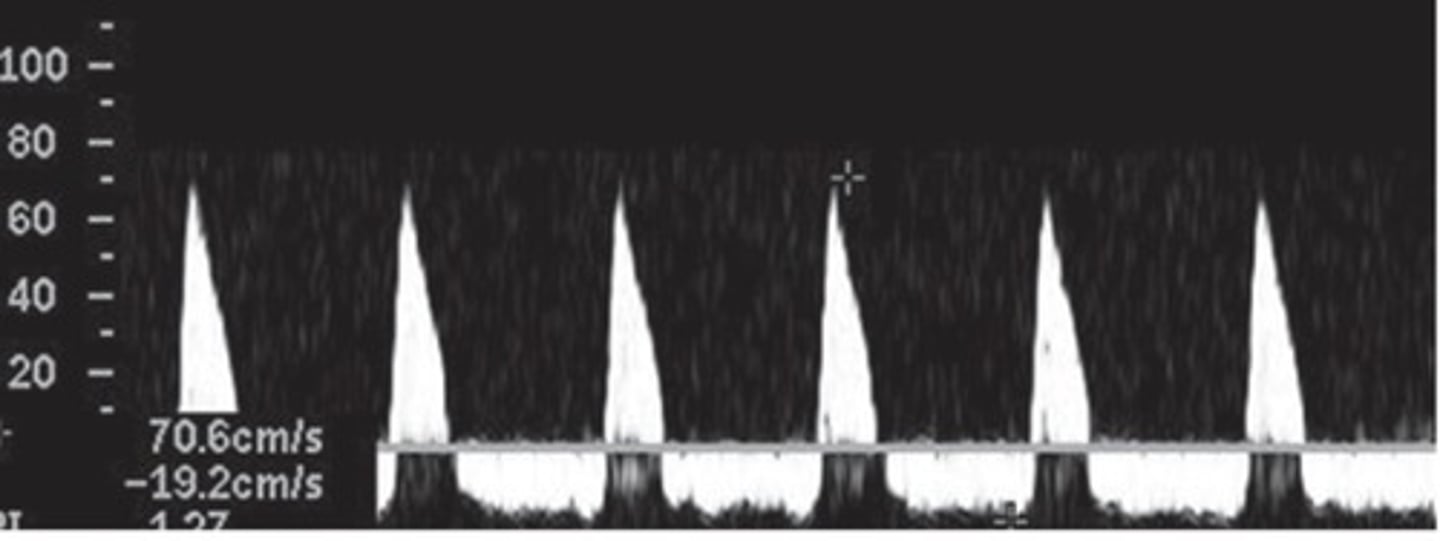
Main Portal Vein Doppler Waveform
Monophasic continuous waveform
Hepatopetal flow (antegrade flow)
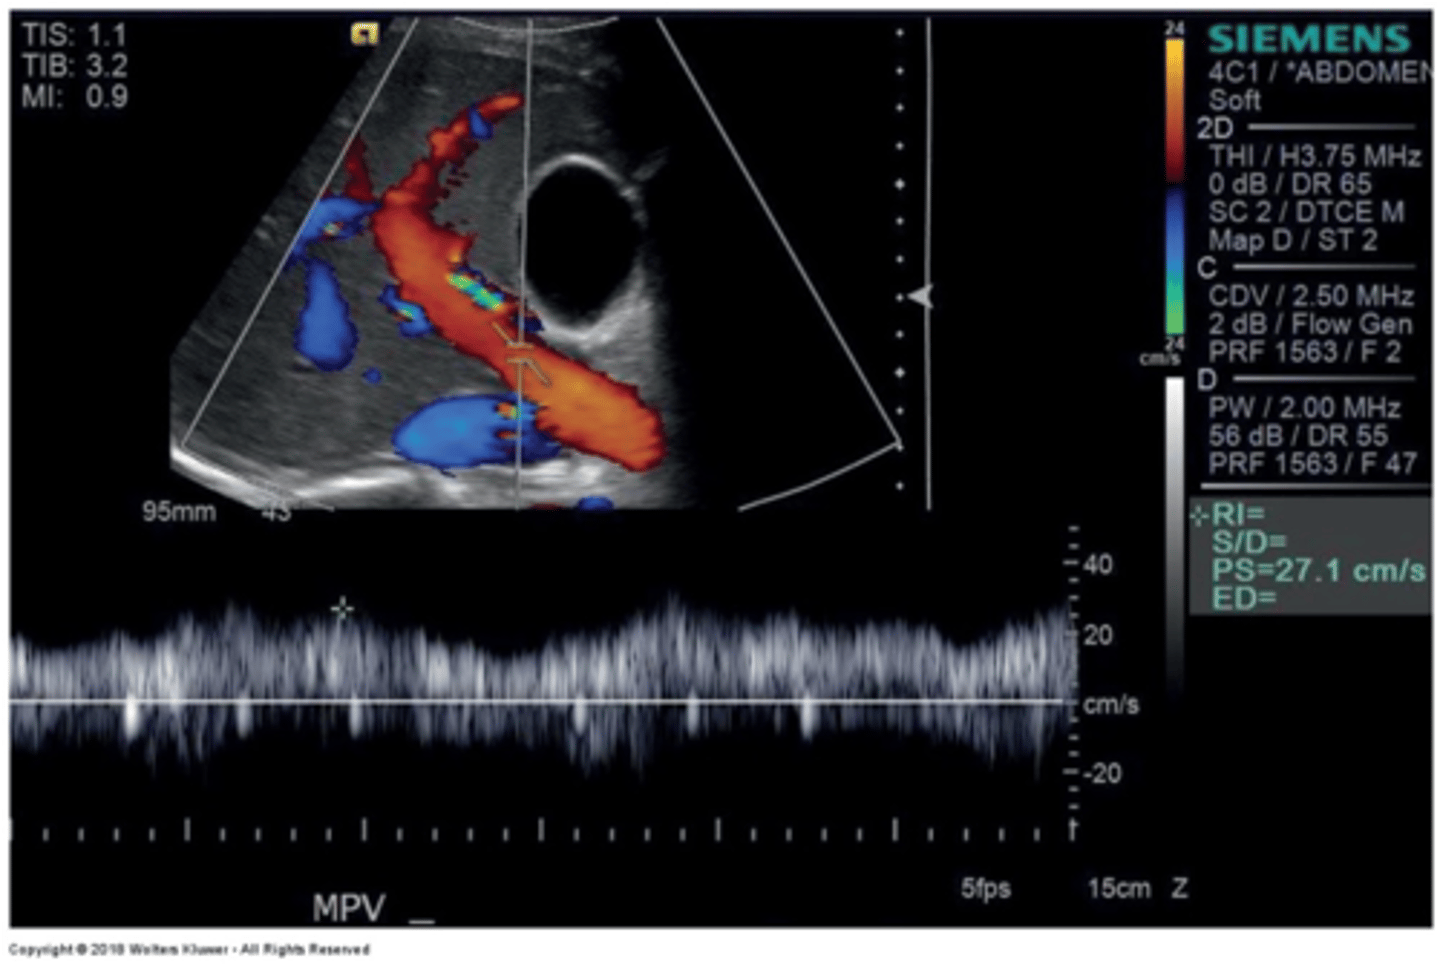
Main Portal Vein PSV
16-31 cm/sec
Slight respiratory variation
-> breath in = decreased velocity
-> breath out or eating = increased velocity
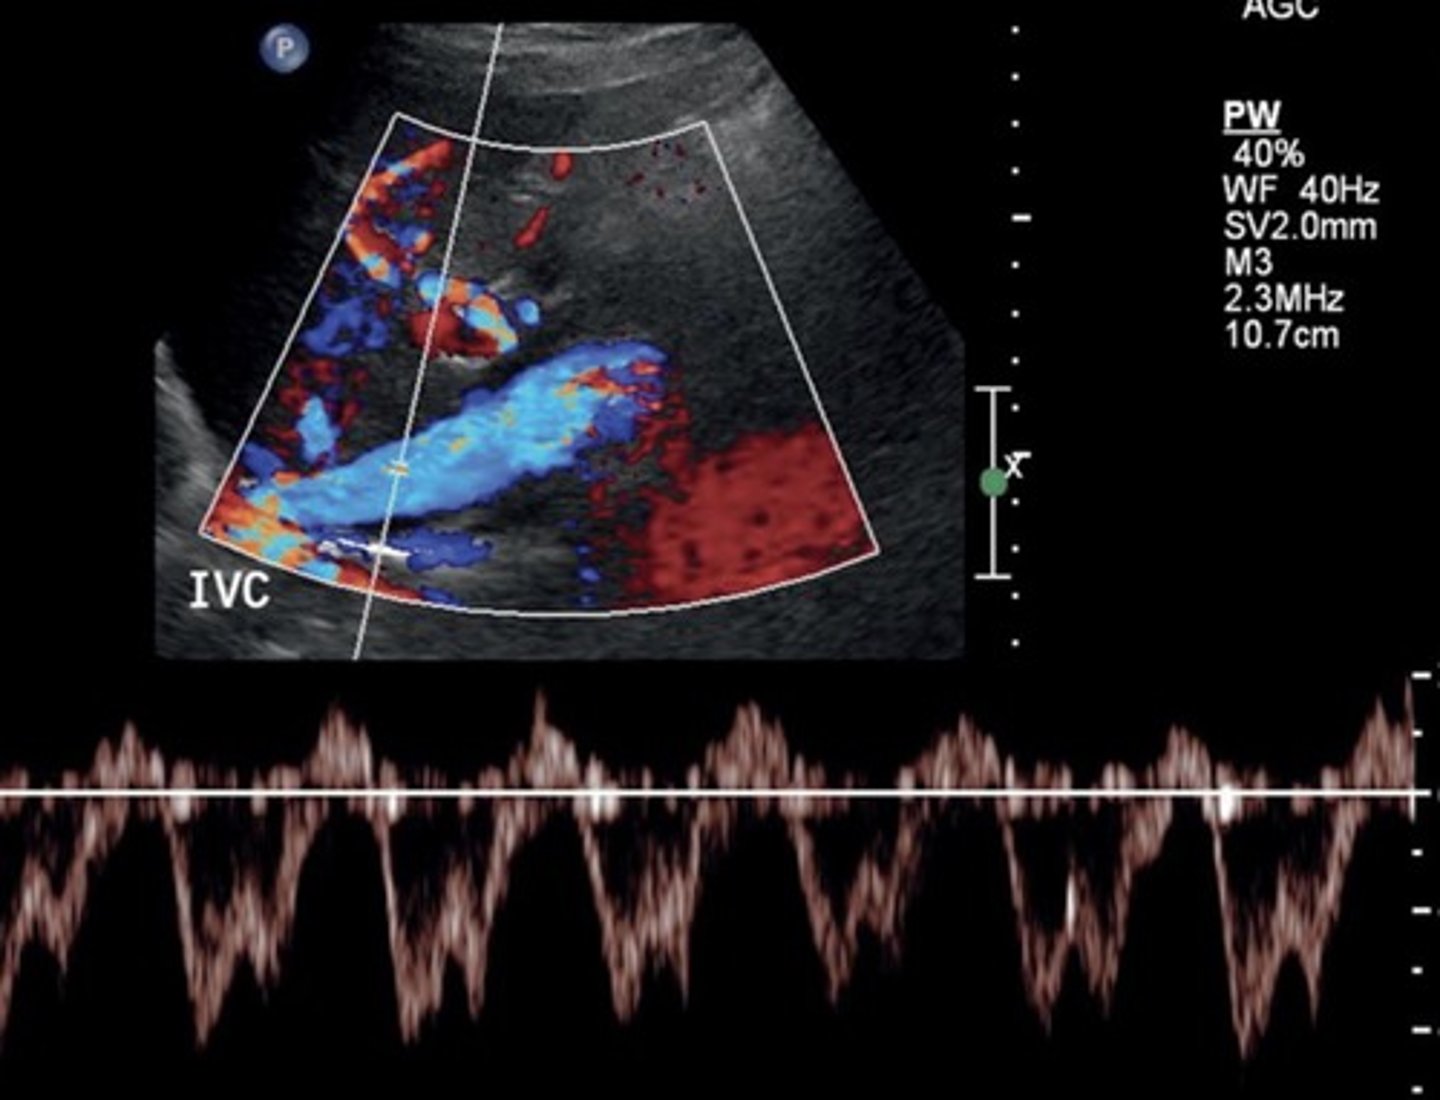
Hepatic Vein Doppler Waveform
Triphasic
Antegrade & retrograde flow - cardiac pressure changes
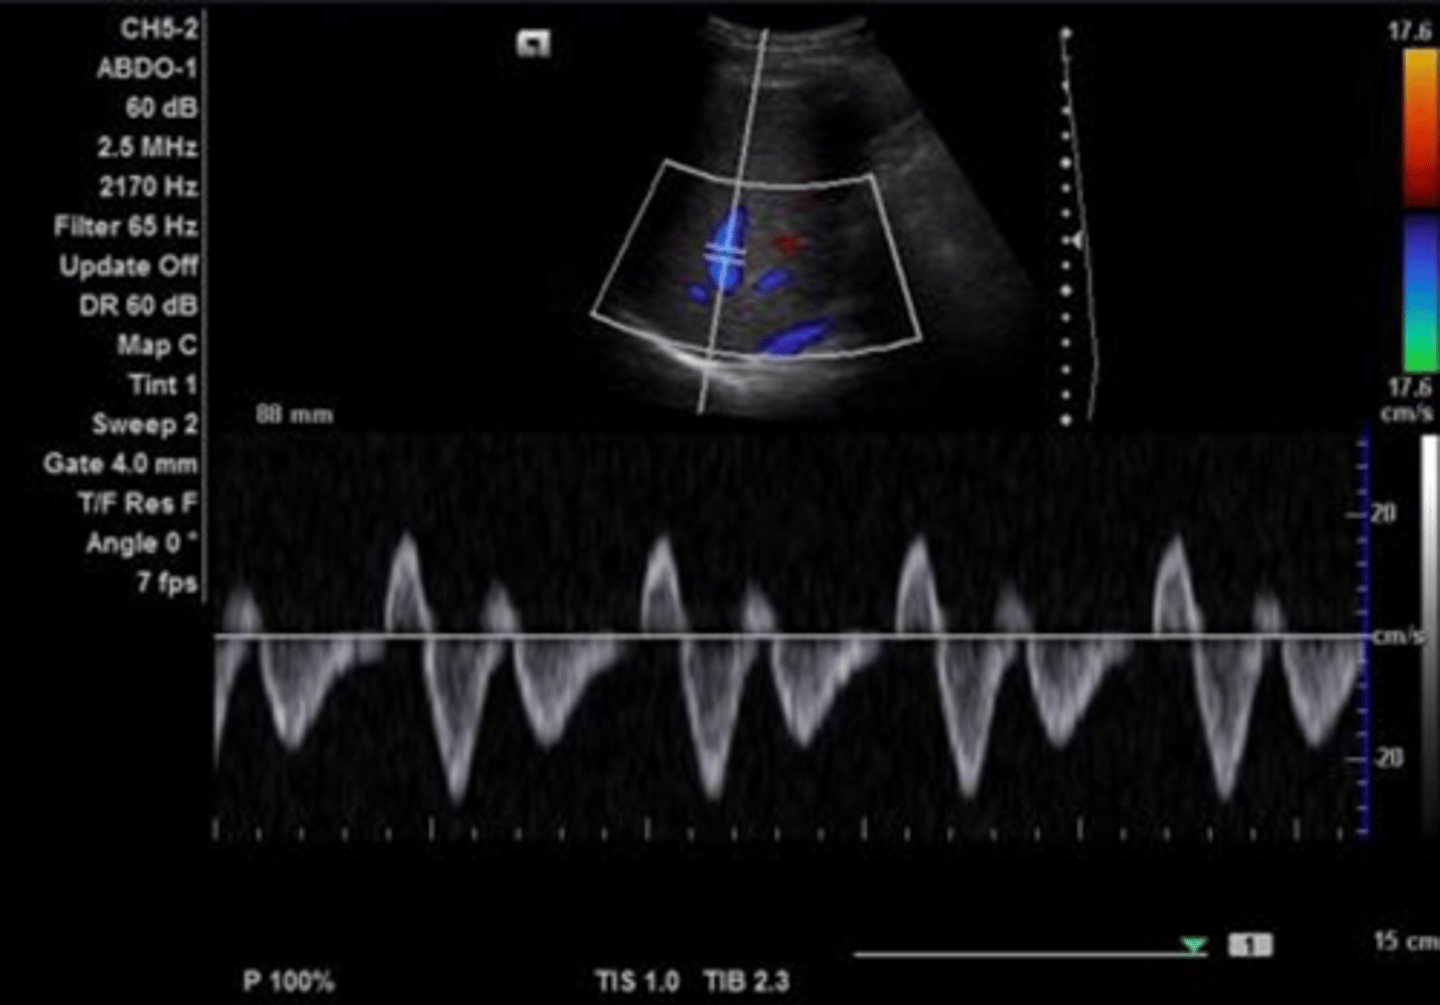
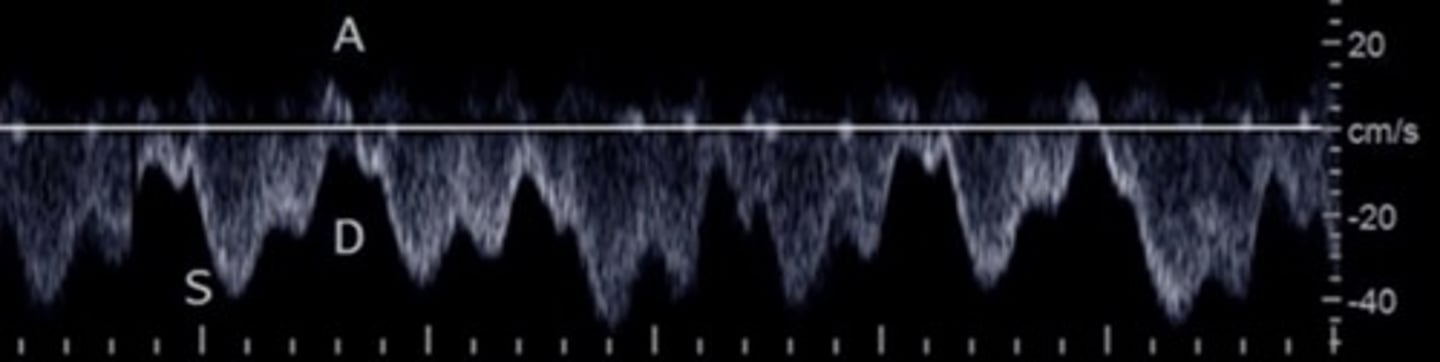
Hepatic Vein Doppler
S wave: ventricular systole
D wave: atrial filling
A wave: atrial contraction
Inspiration depresses systolic wave
Exhalation augments systolic wave
Valsalva diminishes pulsatility
Hepatic Vein PSV
20-39 cm/sec
Hepatic Artery
Right branch of celiac trunk
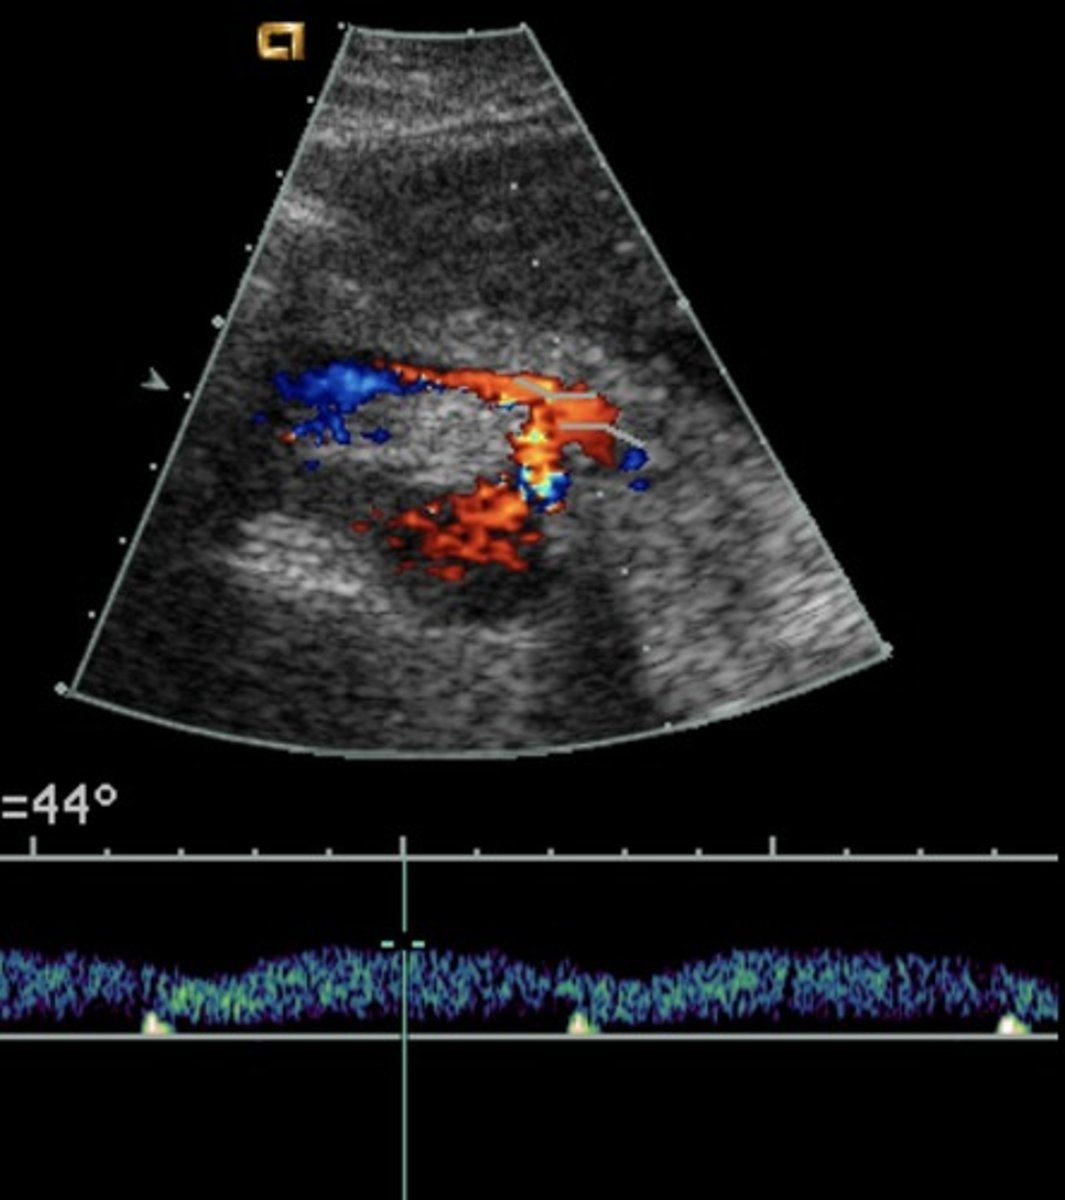
Hepatic Artery Doppler Waveform
Hepatopetal
Low resistant monophasic pan-diastolic forward flow
Hepatic Artery PSV
70-120 cm/sec
Hepatic Artery RI
0.5 - 0.7
Splenic Vein Doppler Waveform
Hepatopetal flow
Continuous monophasic with slight respiratory variation
Splenic Vein PSV
9-30 cm/sec
IVC PSV
44-118 cm/sec
Increases with inspiration
Sub-Xiphoid/Transverse Epigastric & Left Sagittal
Left Hepatic V at IVC: blue
Ascending Left Hepatic V: red
Hepatic Artery: red
Porta Hepatis: red
Portal Confluence: blue
Splenic Vein: red
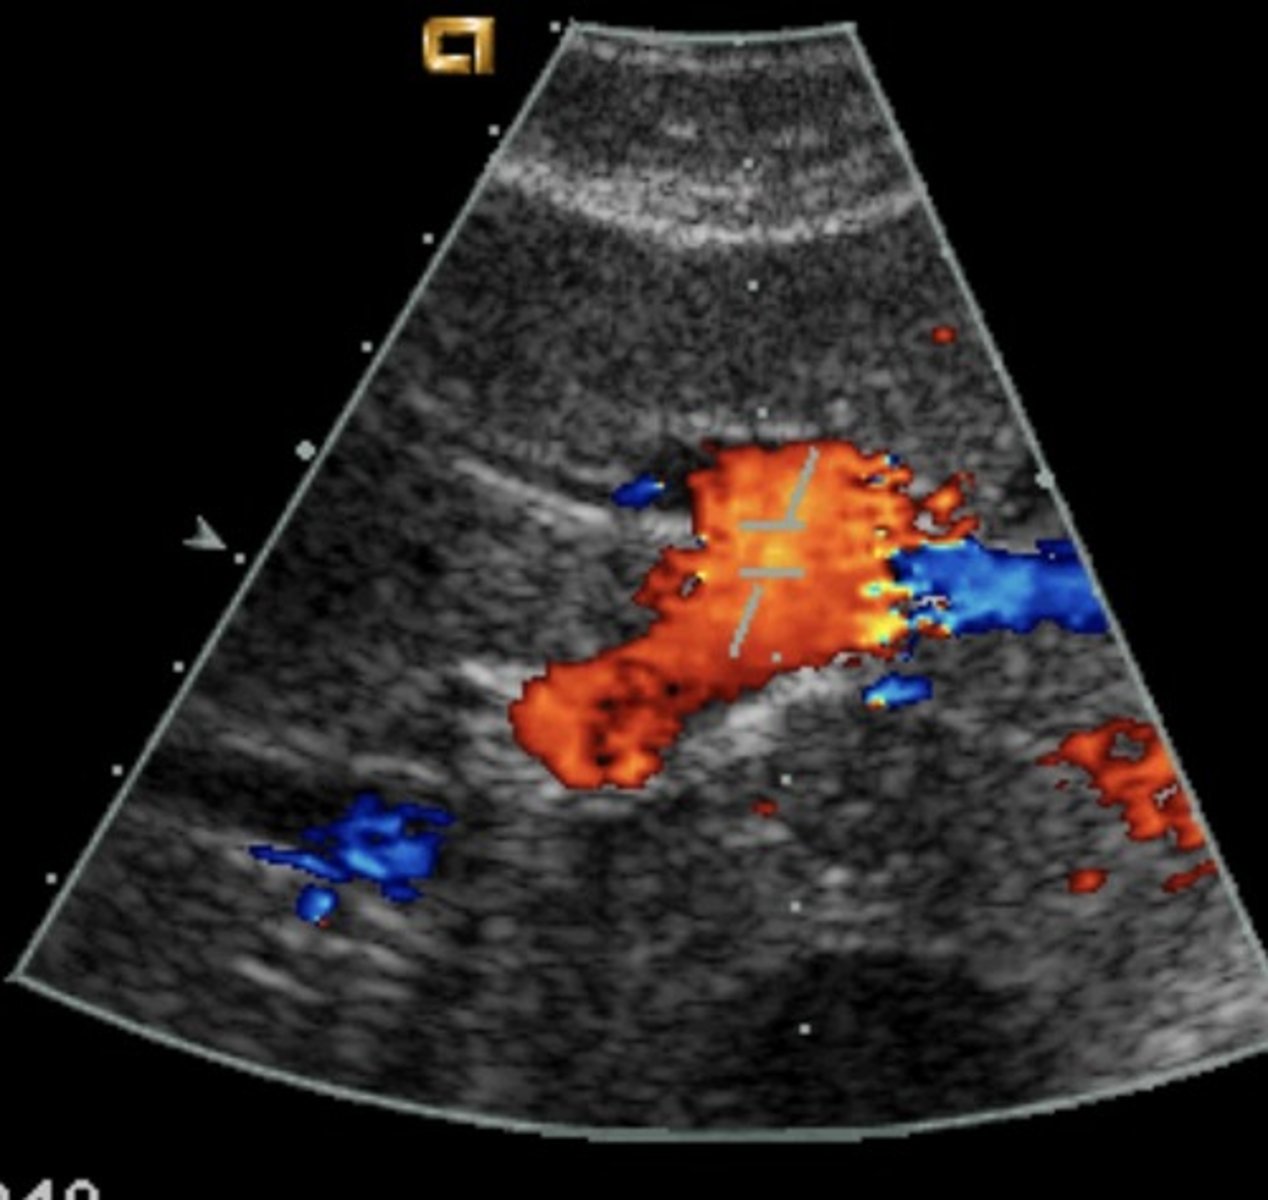
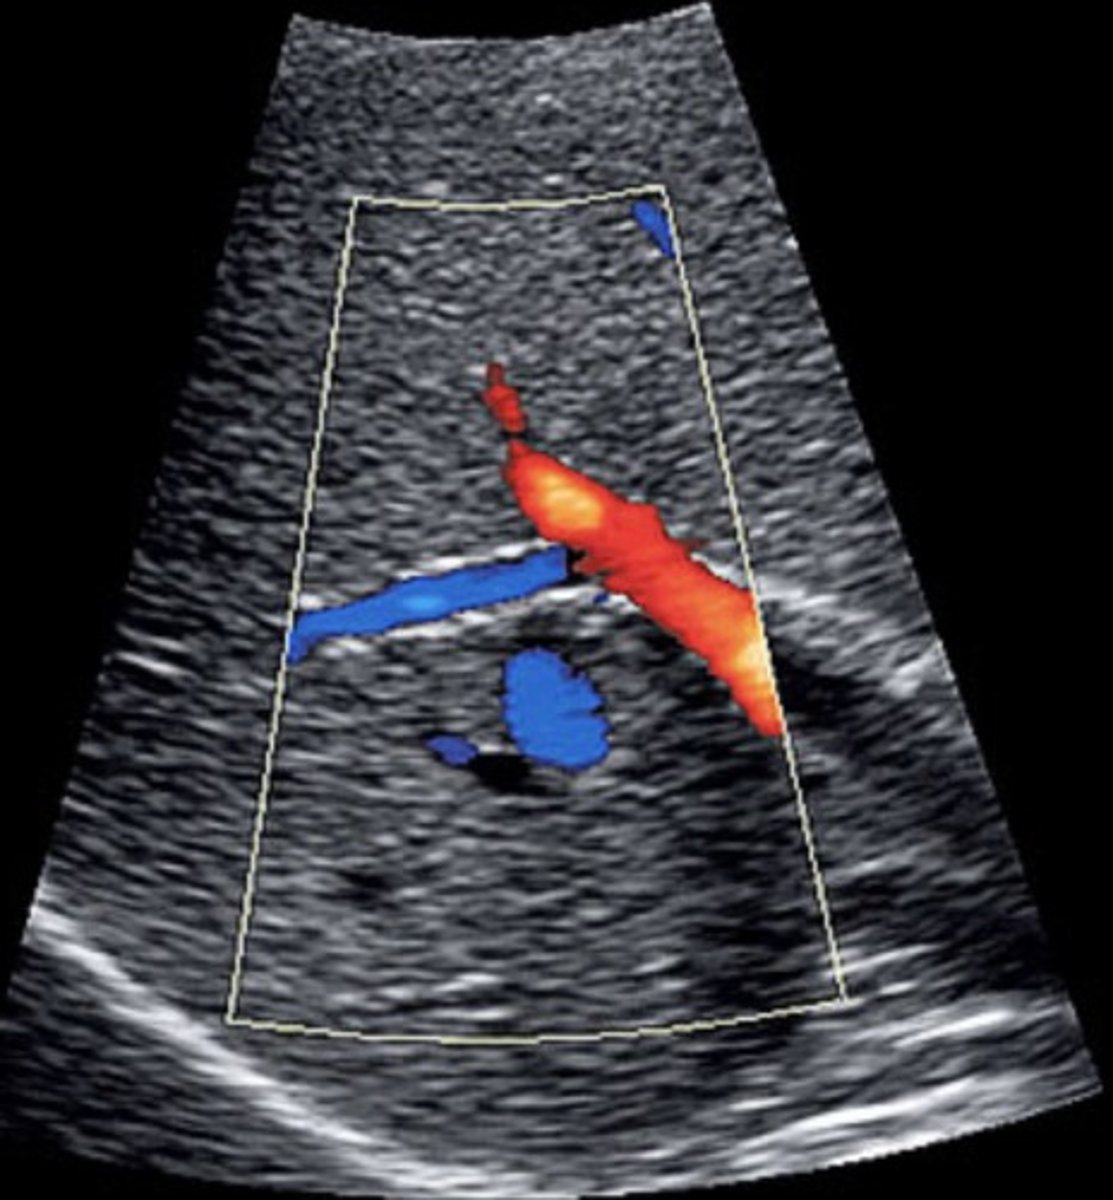
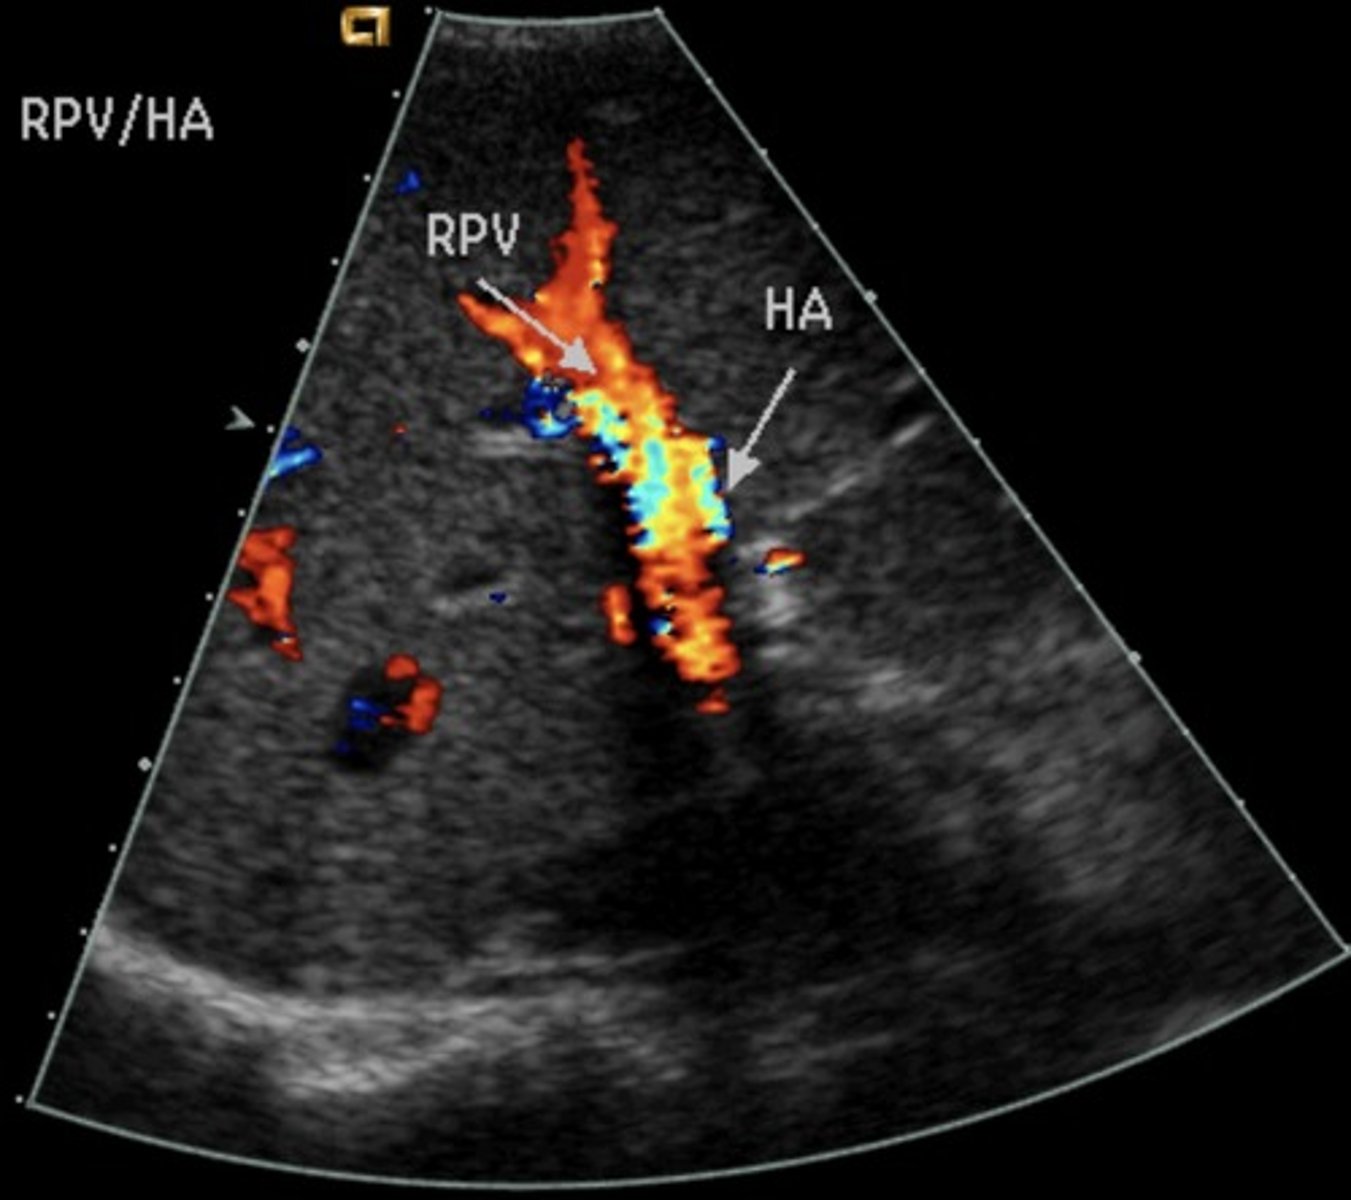
Right Subcostal Margin
Porta hepatis, MPV, anterior RPV, HA: red
Posterior RPV : blue
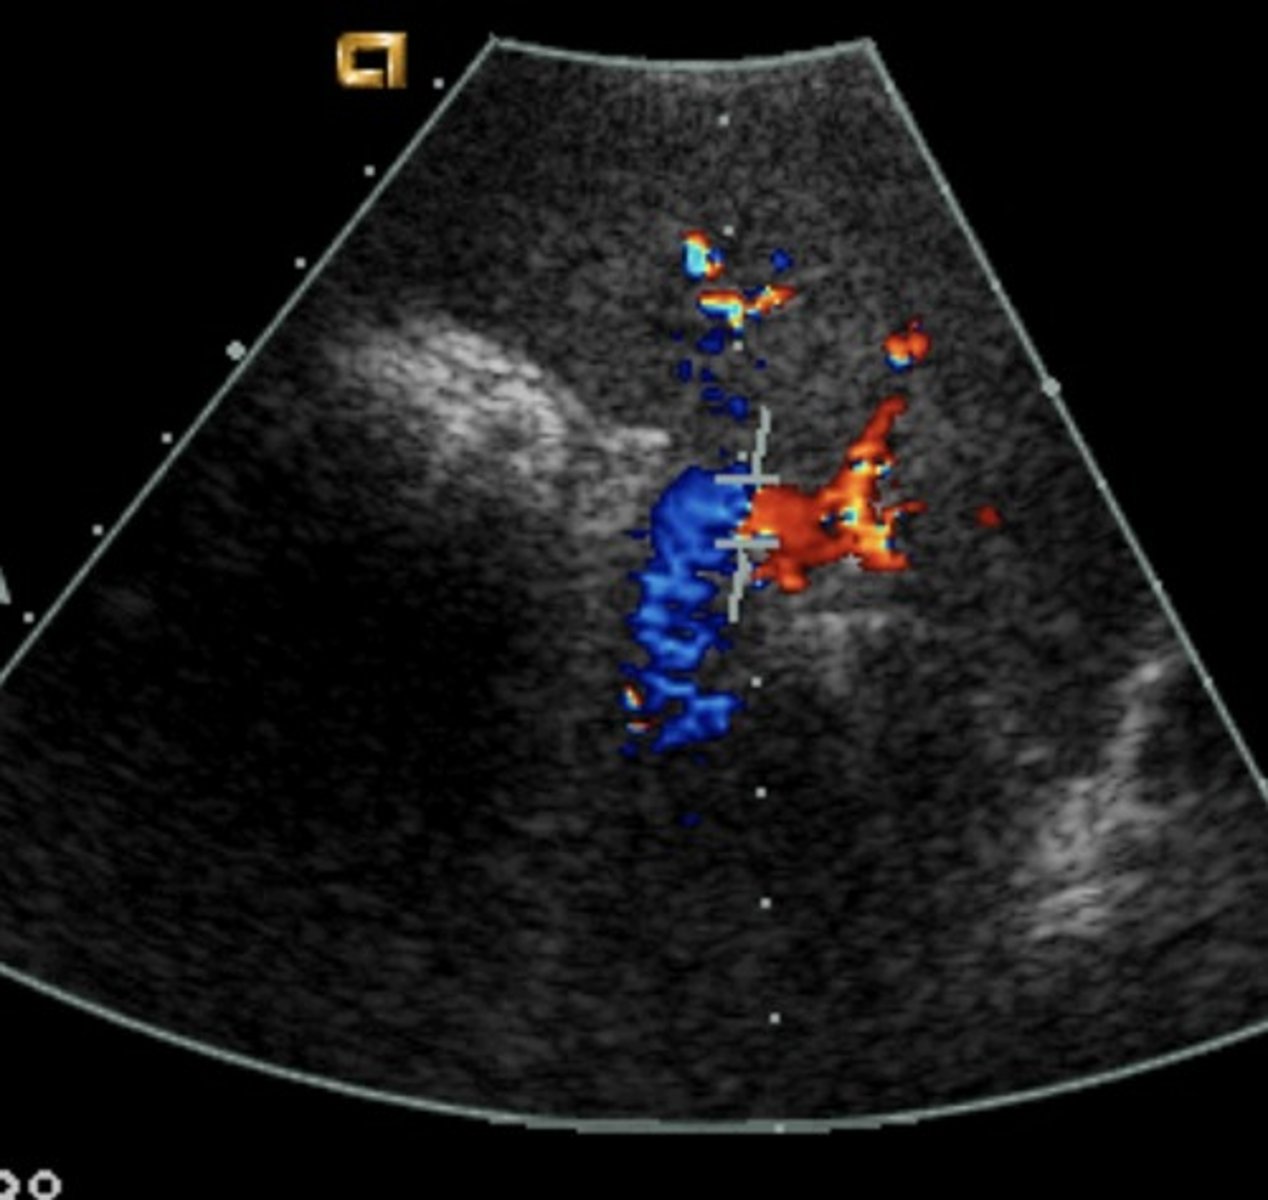
Right Intercostal
Porta hepatis: red
Portal-Splenic confluence: red
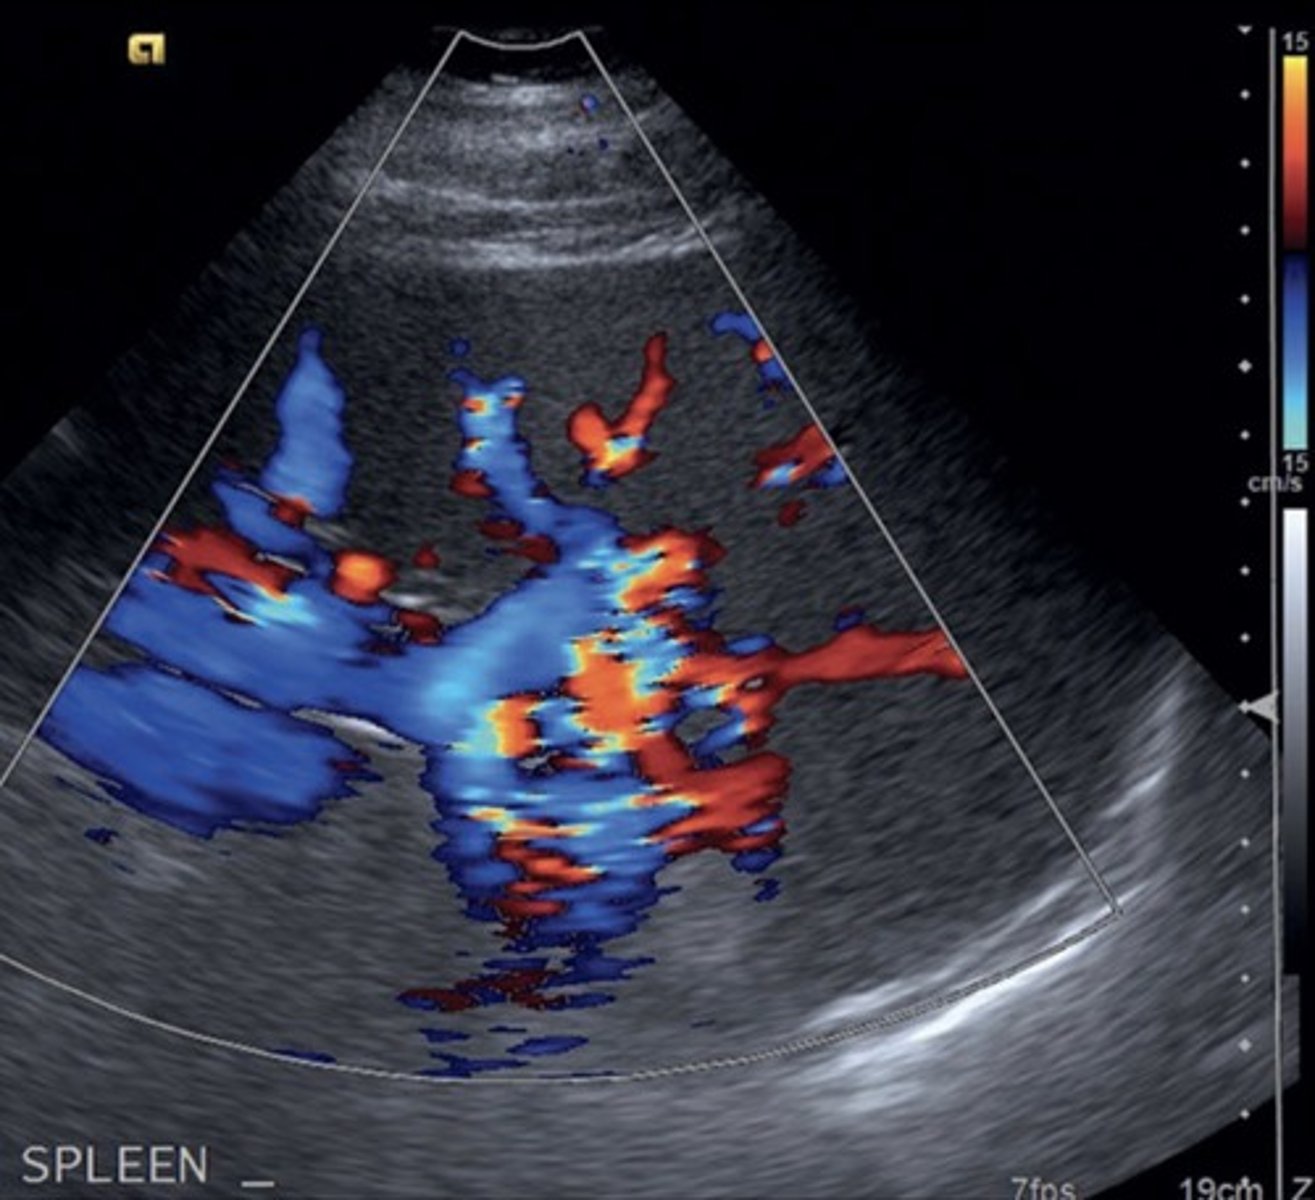
Left Coronal Oblique
Splenic vein: blue
Portal HTN
Increased pressure in portal venous system
Not diagnosed with spectral Doppler -> diagnosed with gray scale & color
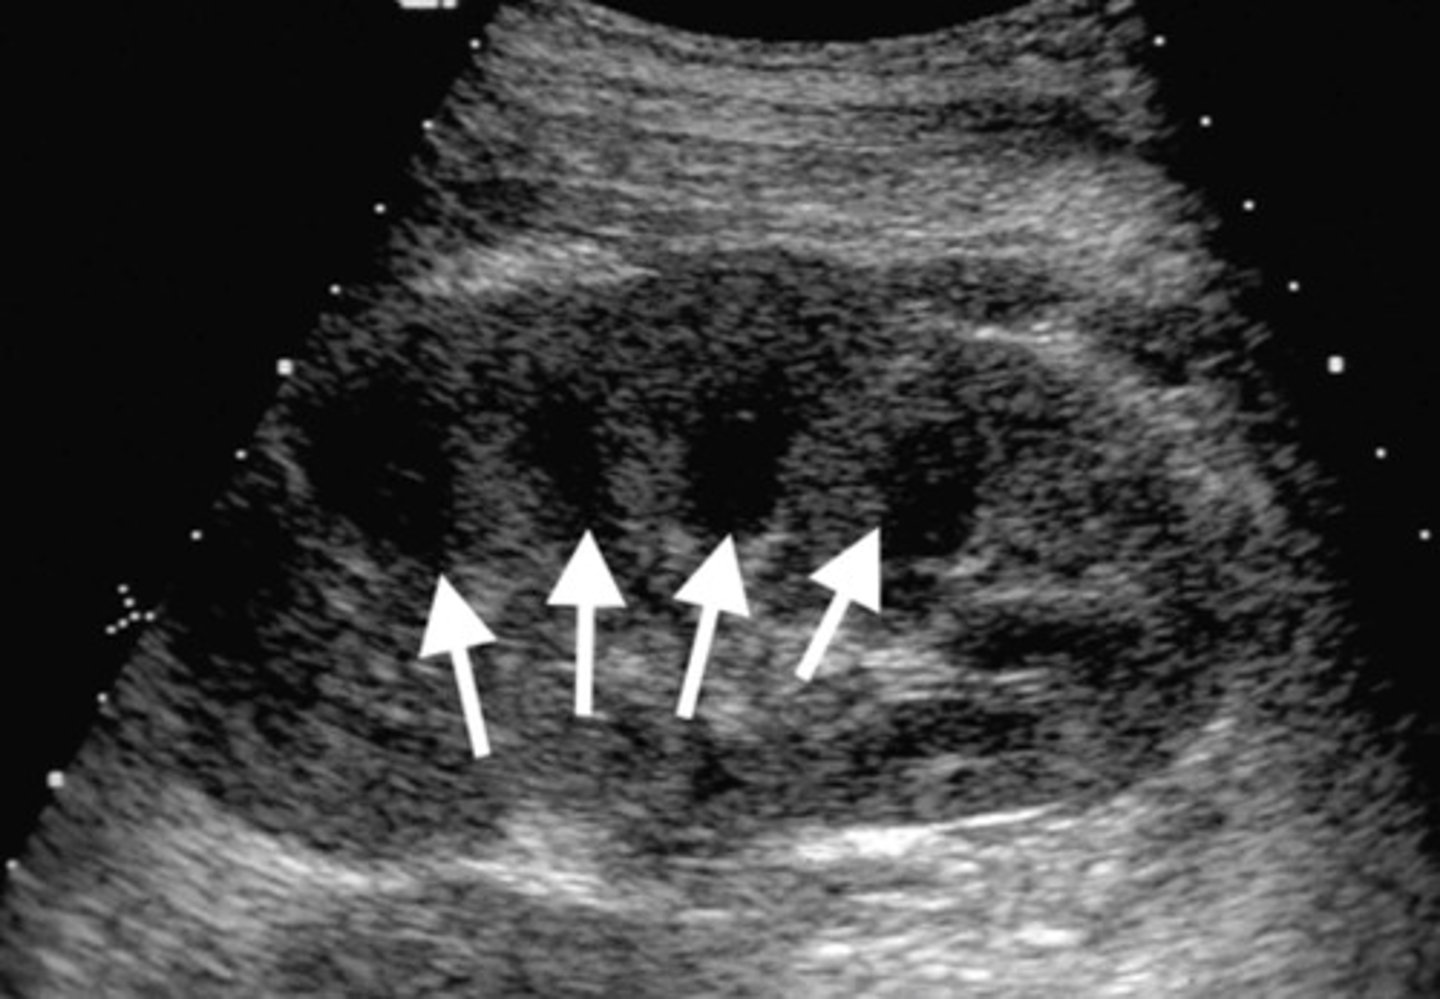
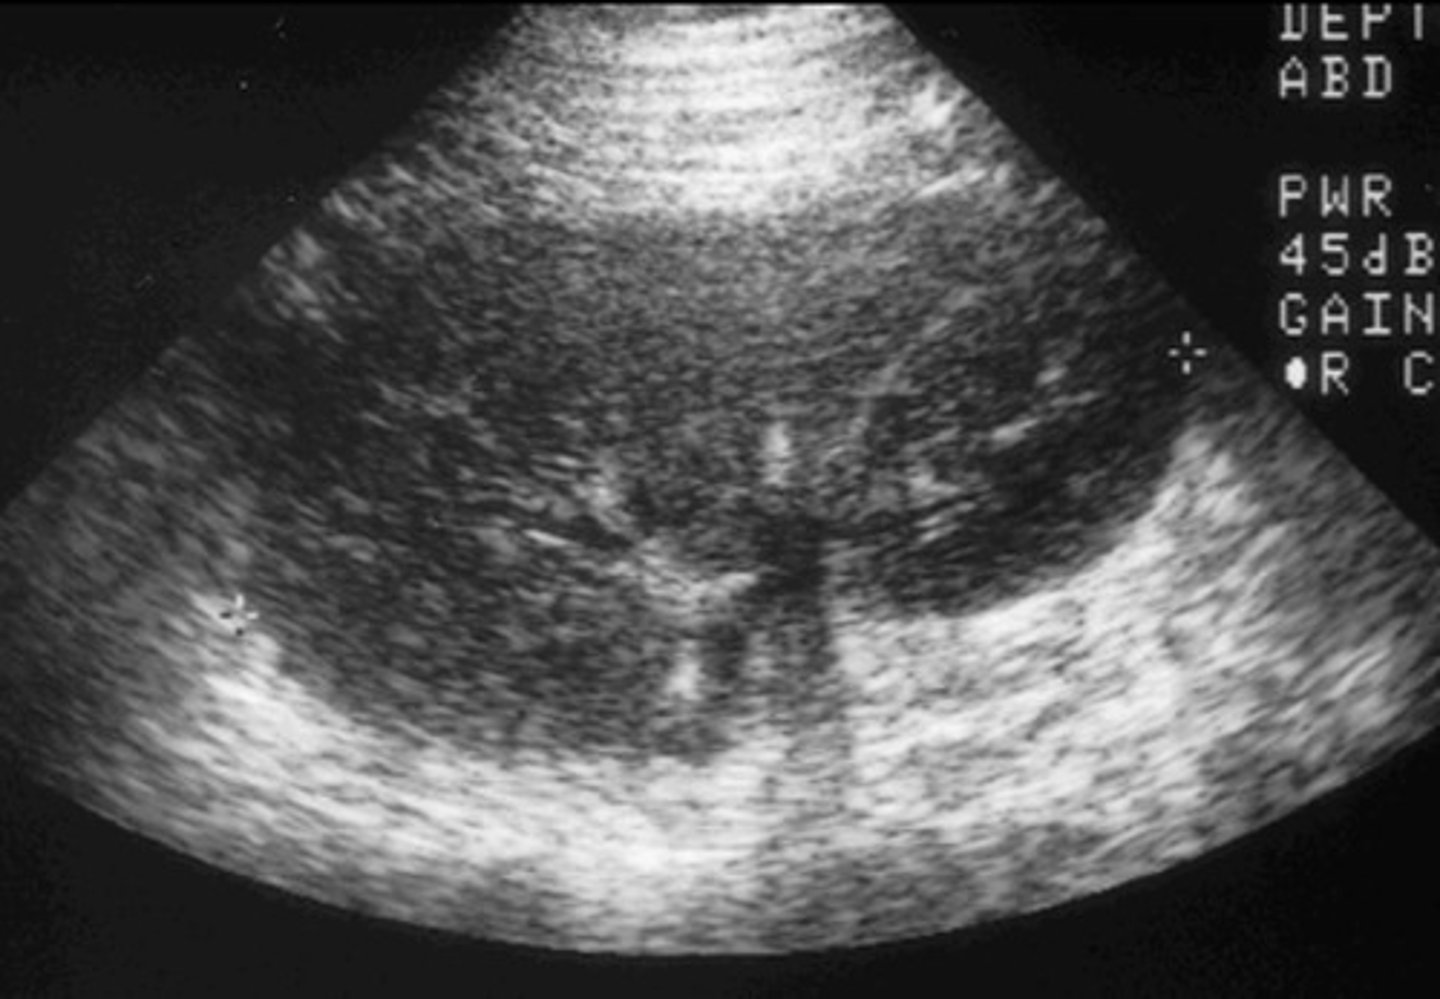
Portal HTN 2D Findings
Large pulmonary vein
Collaterals
Splenomegaly
Ascites
Enlarged hepatic artery
Portal HTN Doppler Findings
Slow, hepatofugal flow in portal vein
Coronary Vein Collateral
Can lead to esophageal varices
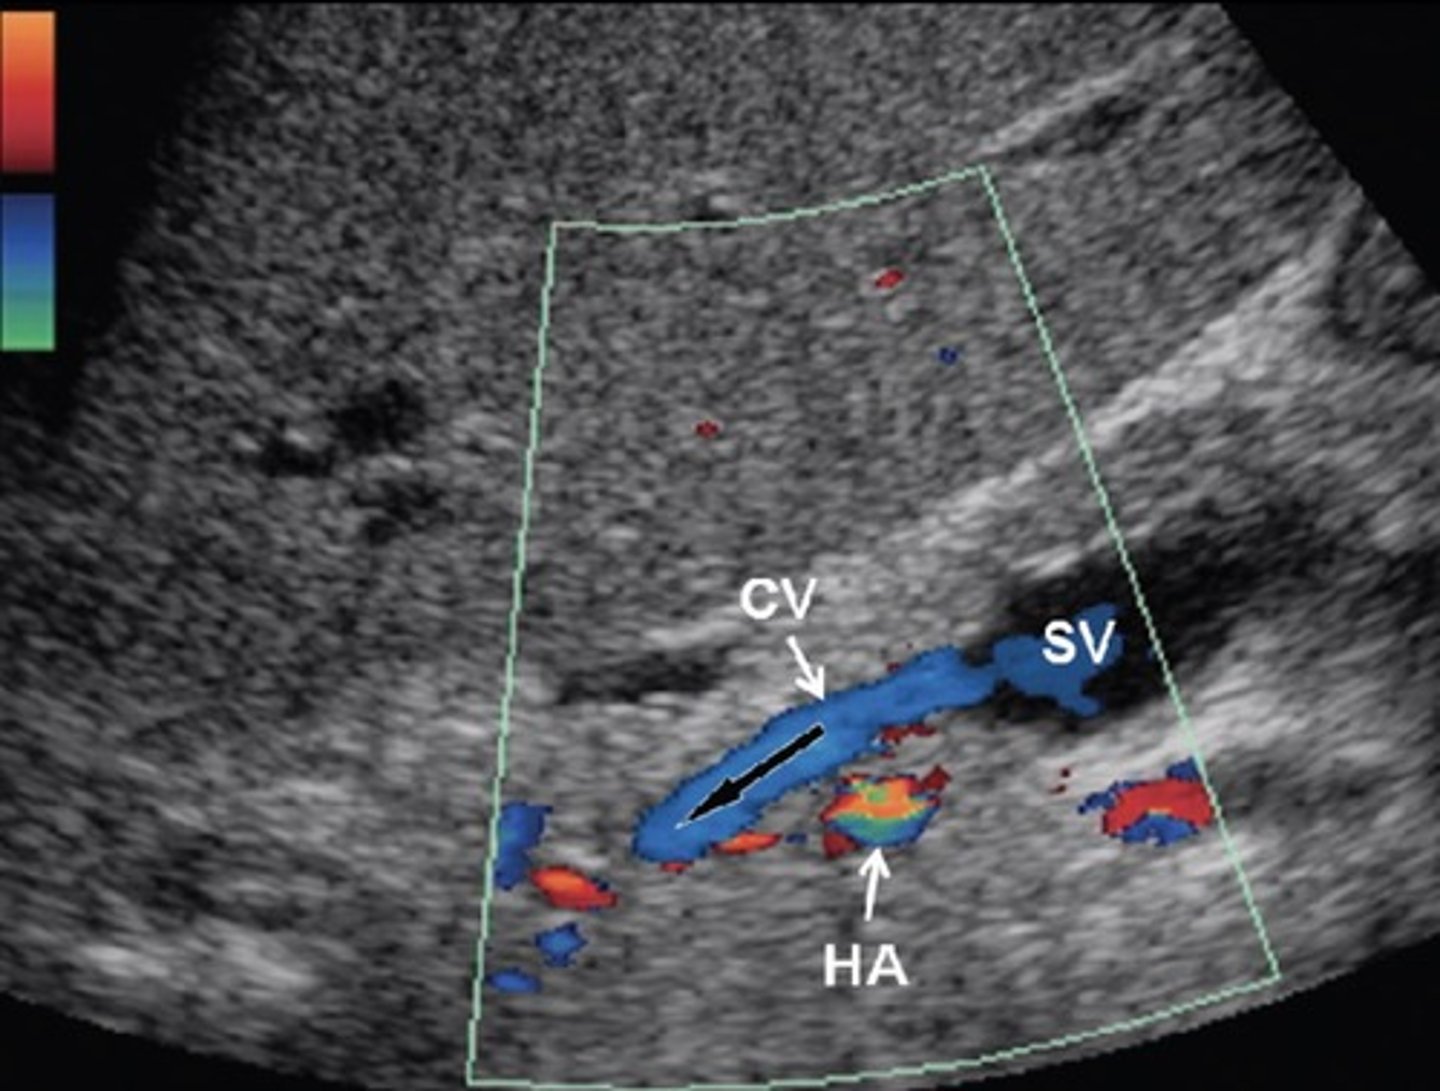
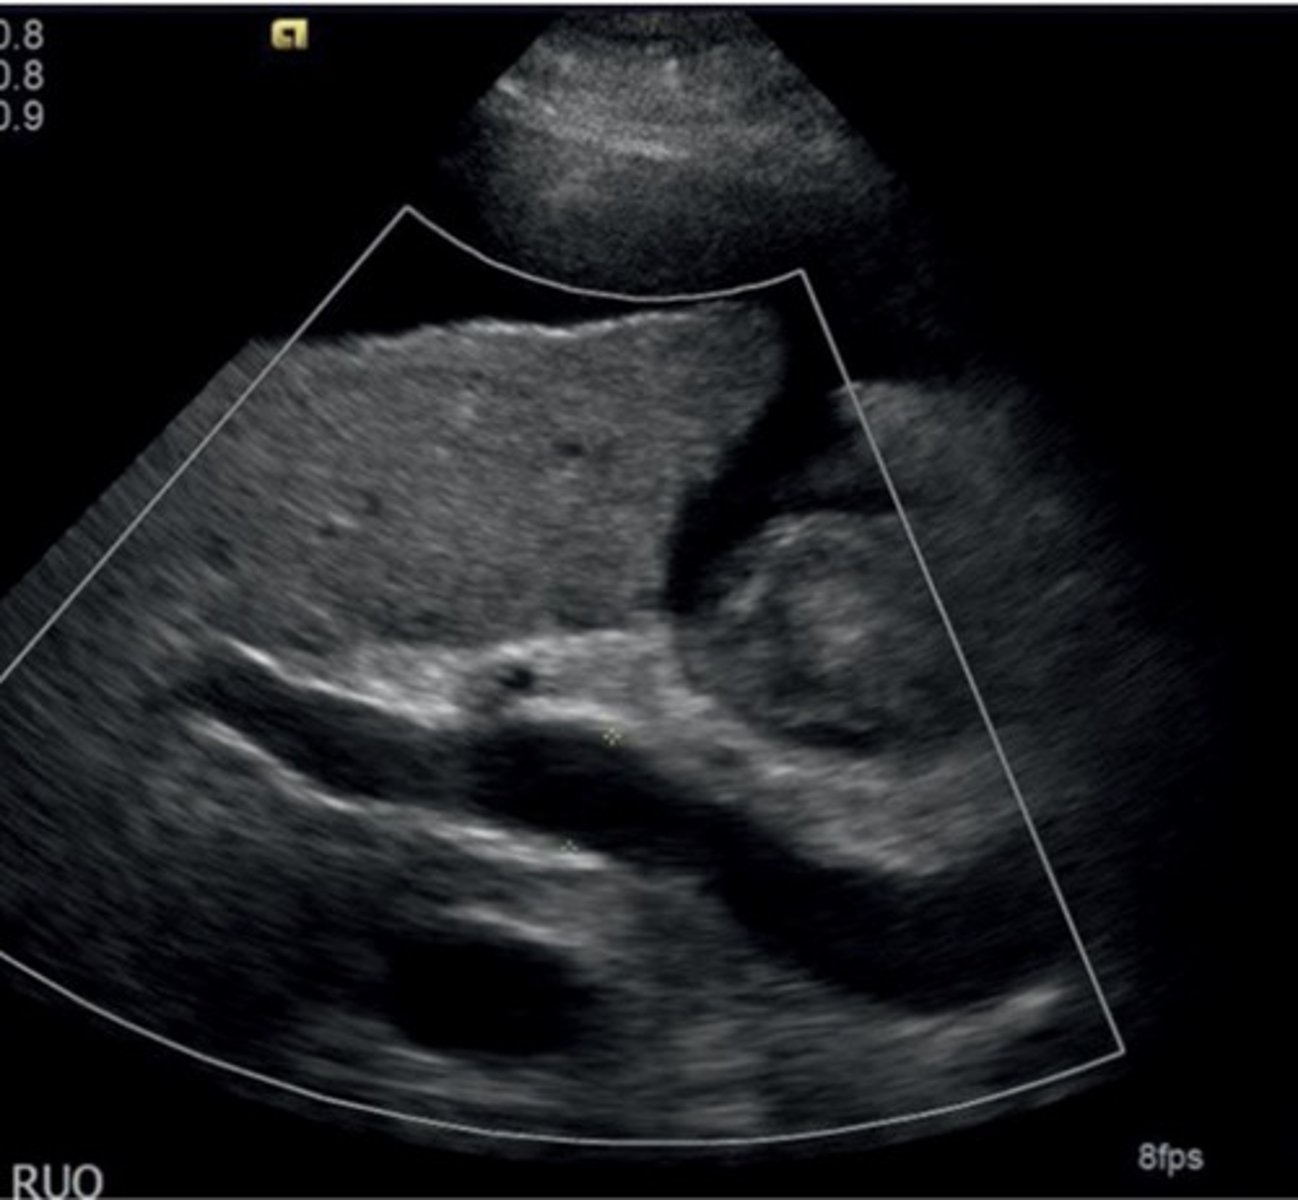
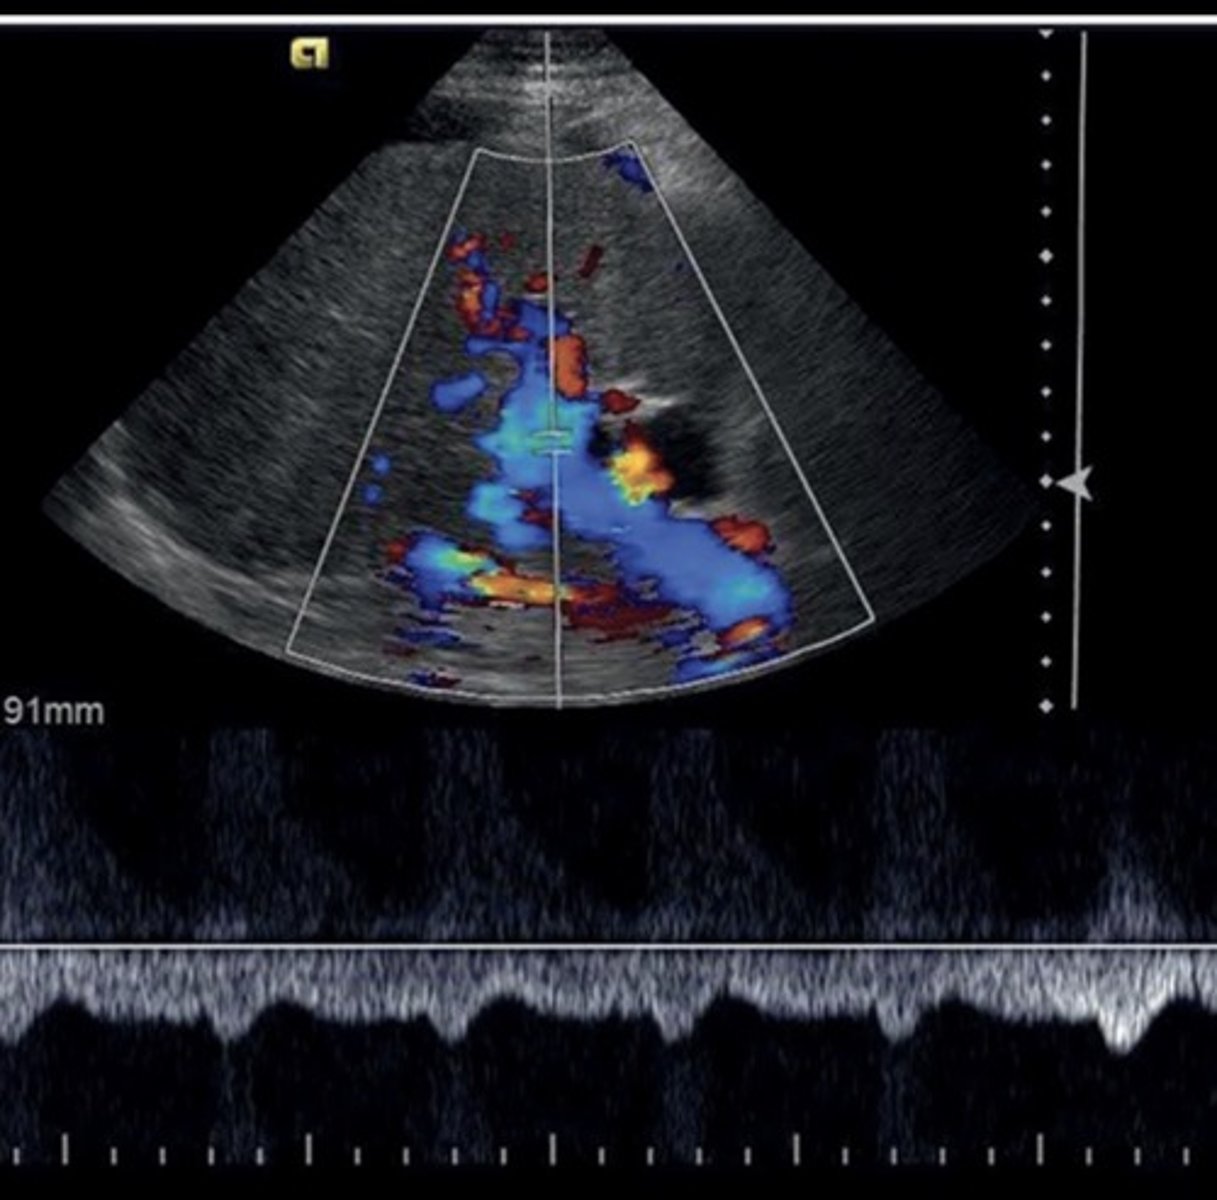
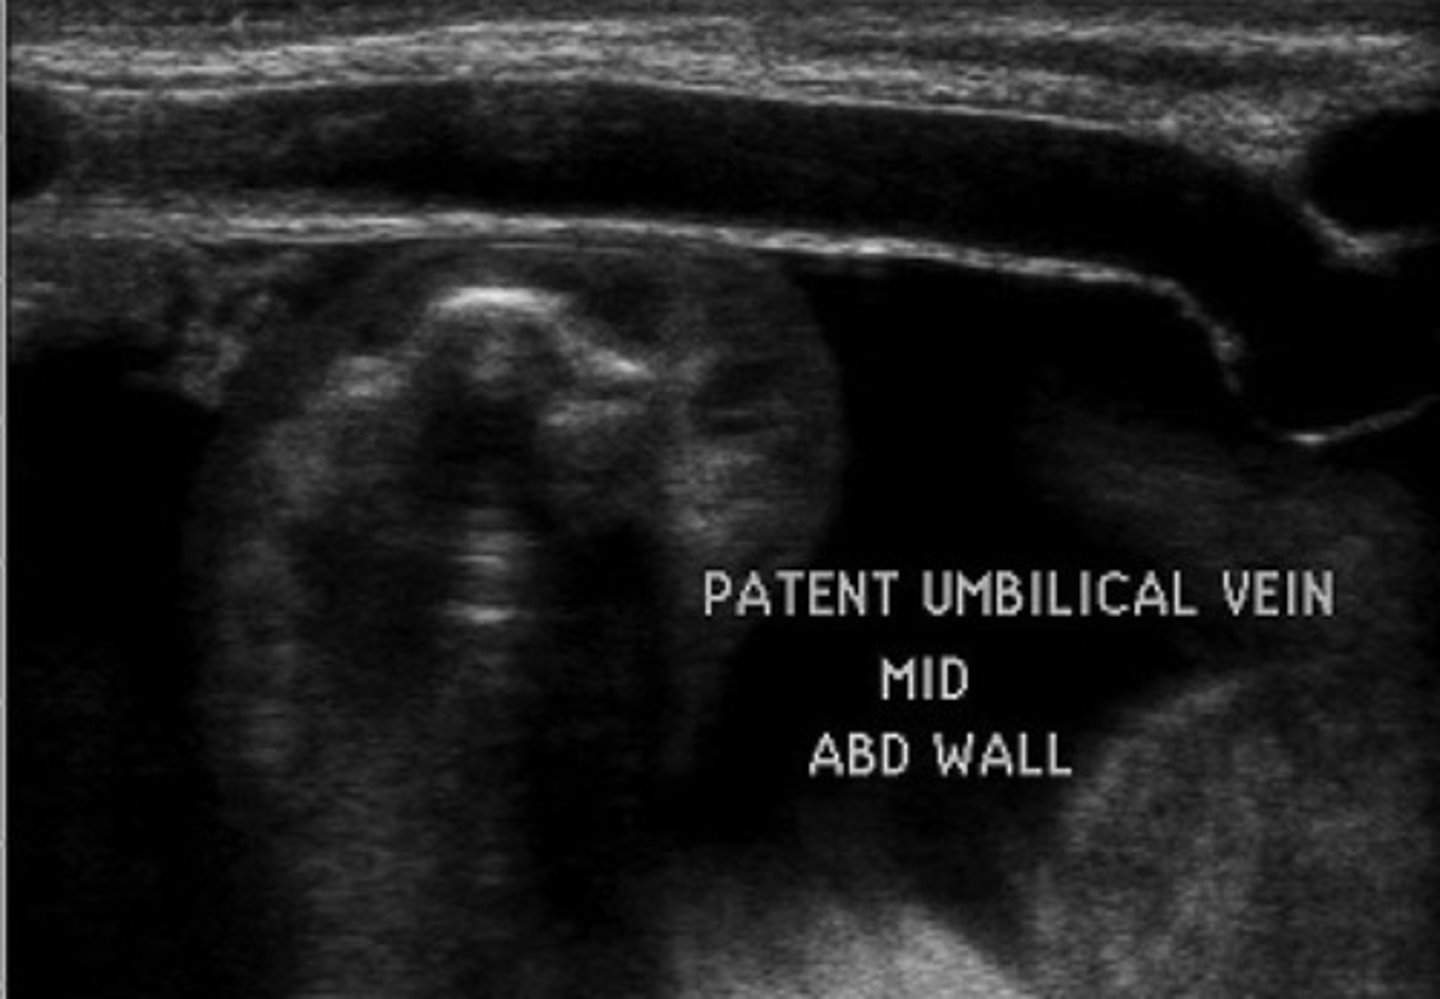
Recanalized Paraumbilical Vein
Ligamentum teres recanalizes
Courses from left portal vein to anterior abdominal wall
Hepatofugal flow
Splenorenal Shunt
Prominent veins at splenic hilum
Hepatofugal flow in splenic vein
Gastroesophageal Veins/Esophageal Varices
Originate from gastroesophageal junction posterior to left liver lobe
Due to hepatofugal flow in coronary vein shunt
High risk of rupture
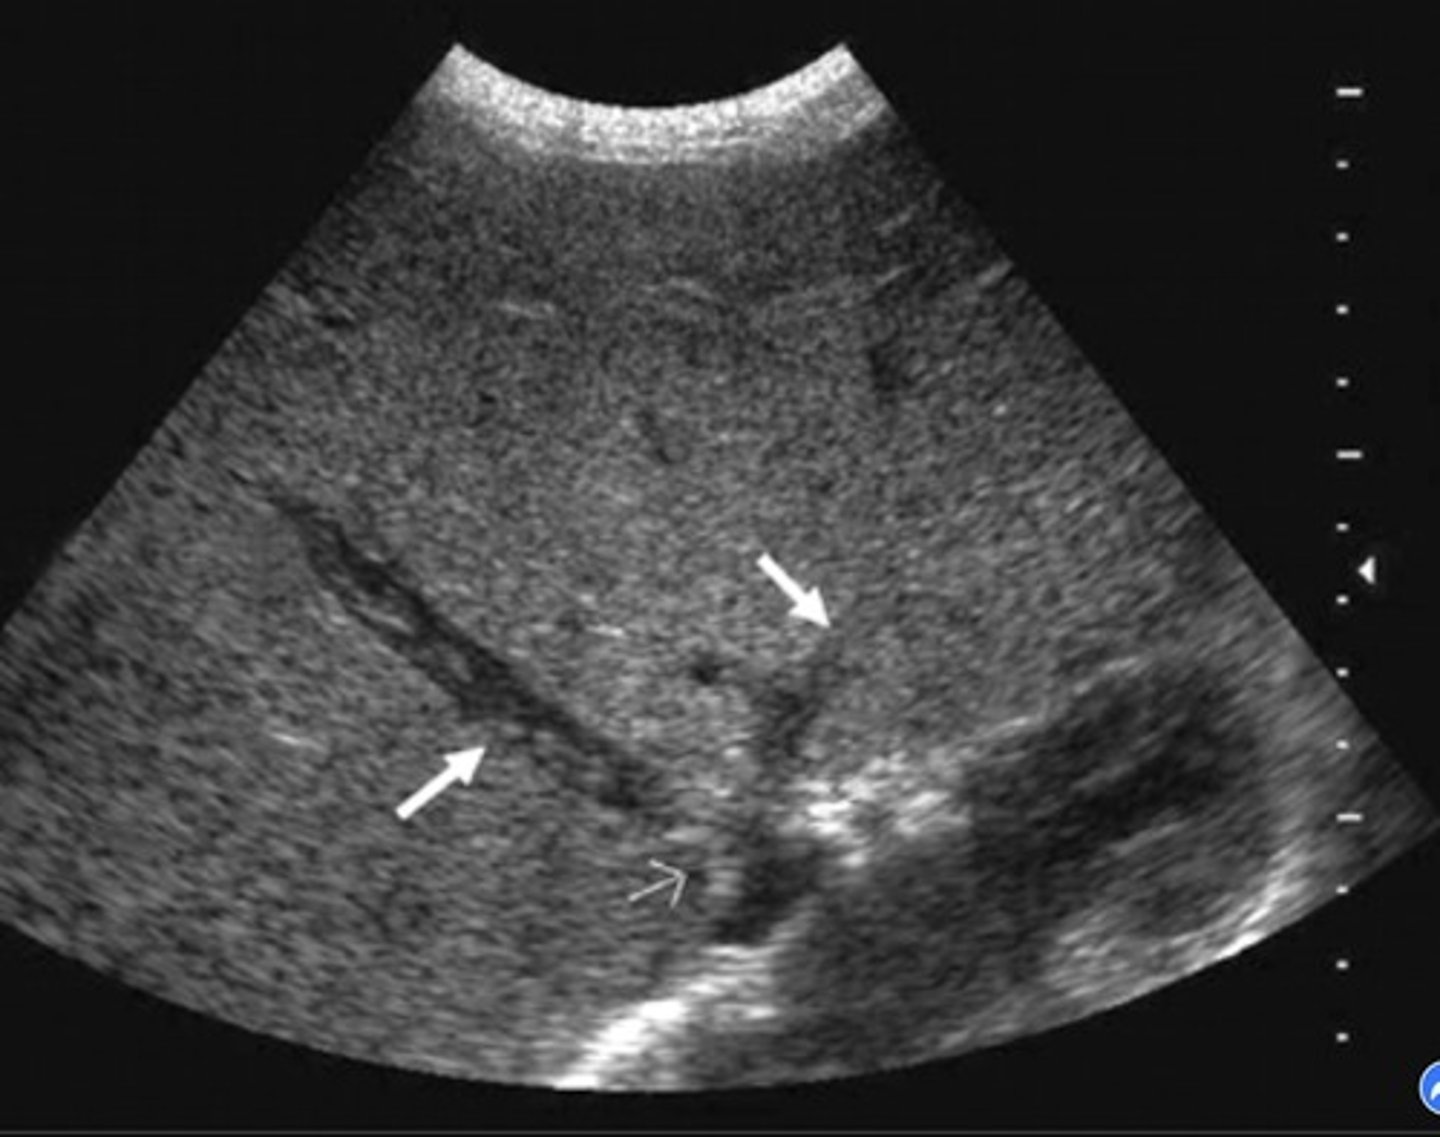
Budd-Chiari Syndrome
Hepatic vein/liver outflow obstruction
Causes increased sinusoidal pressure
Budd-Chiari Syndrome Findings
Hepatic vein thrombosis/post-sinusoidal thrombosis
Monophasic, reduced/reversed flow in portal vein
Enlarged caudate lobe
Ascites
Splenomegaly
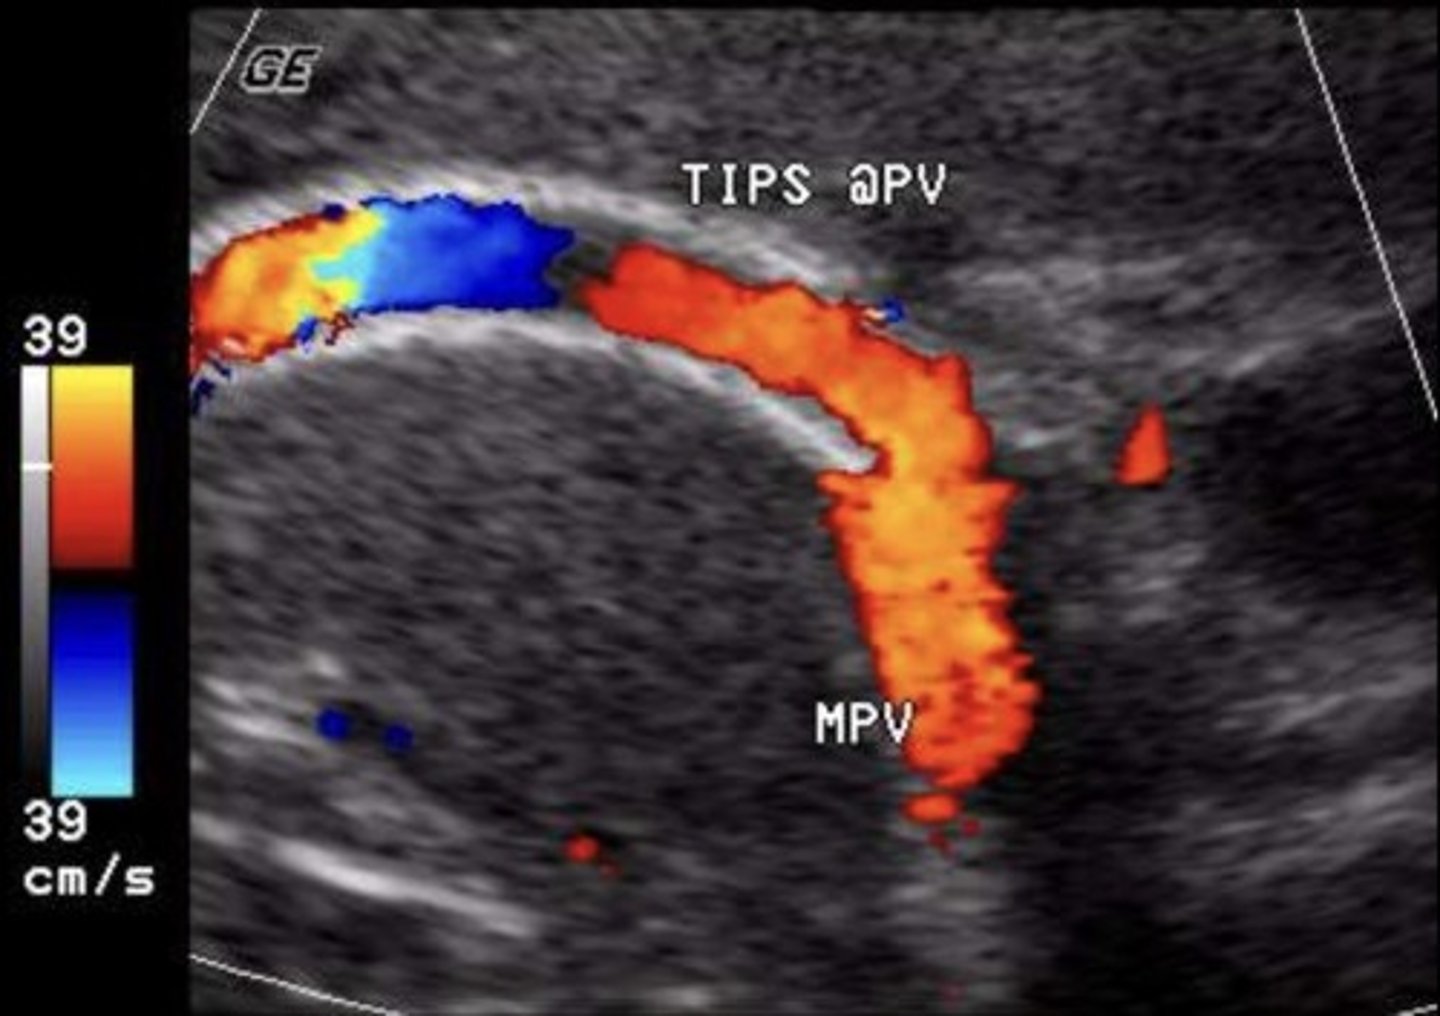
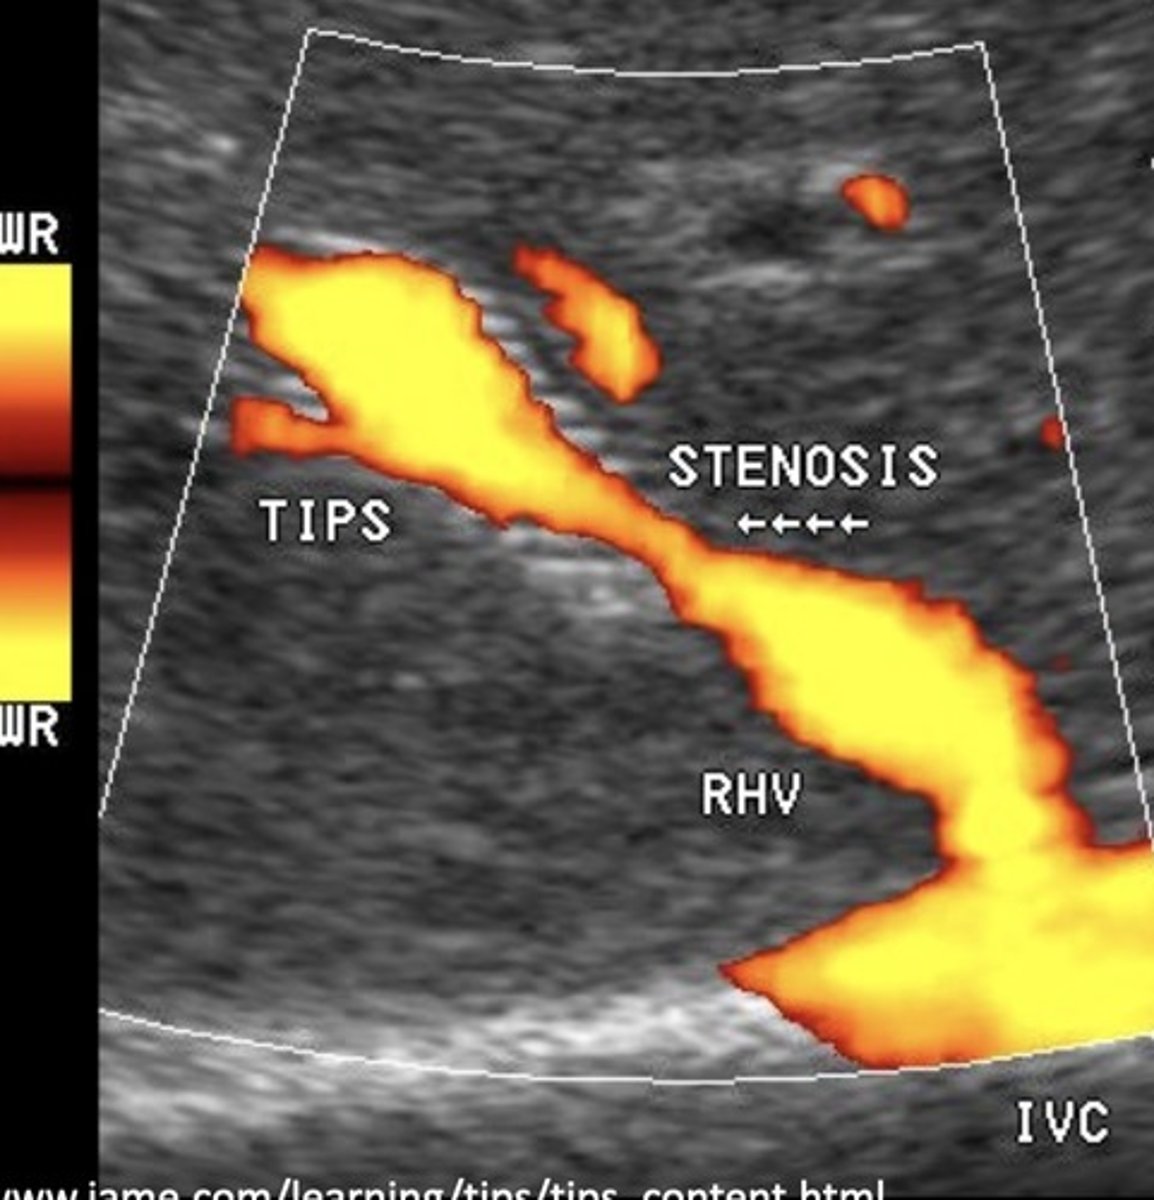
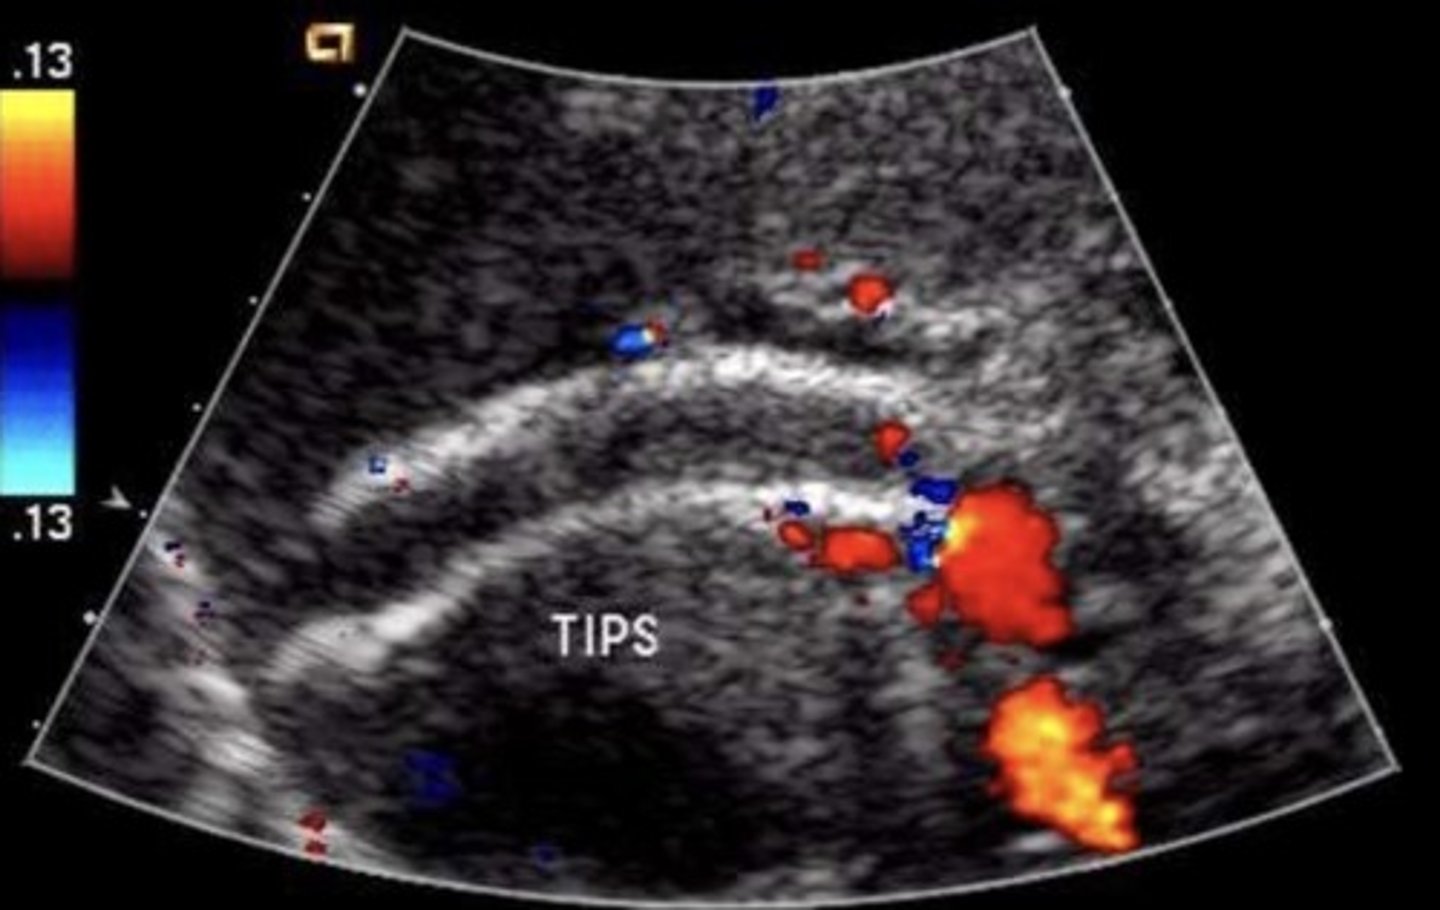
TIPS Shunt
Stent between portal vein & hepatic vein
(commonly right portal vein and right hepatic vein)
TIPS Shunt Purpose
Decompress portal system
Reduces risk of variceal rupture & ascites
Treats hepatic venous outflow obstructions
TIPS Shunt PSV
90-190 cm/sec
TIPS Shunt Normal Findings
No focal aliasing
Hepatofugal flow in portal veins beyond stent
TIPS Shunt Abnormal Findings
Focal aliasing
Velocity changes
Antegrade flow in right & left portal veins
Retrograde flow in hepatic vein
Developing ascites or collaterals
TIPS Shunt Stenosis Findings
< 50 cm/sec velocity within stent
Focal area velocity increase > 200 cm/sec
> 50 cm/sec velocity change in same portion of stent compared to past exams
TIPS Shunt Occlusion Findings
Hepatopetal flow in right & left portal veins
Hepatofugal flow in main portal vein
Protocol for Mesenteric Study
RUQ first - eliminate GB as pain source
Pre and post-prandial images - 2D, color, spectral
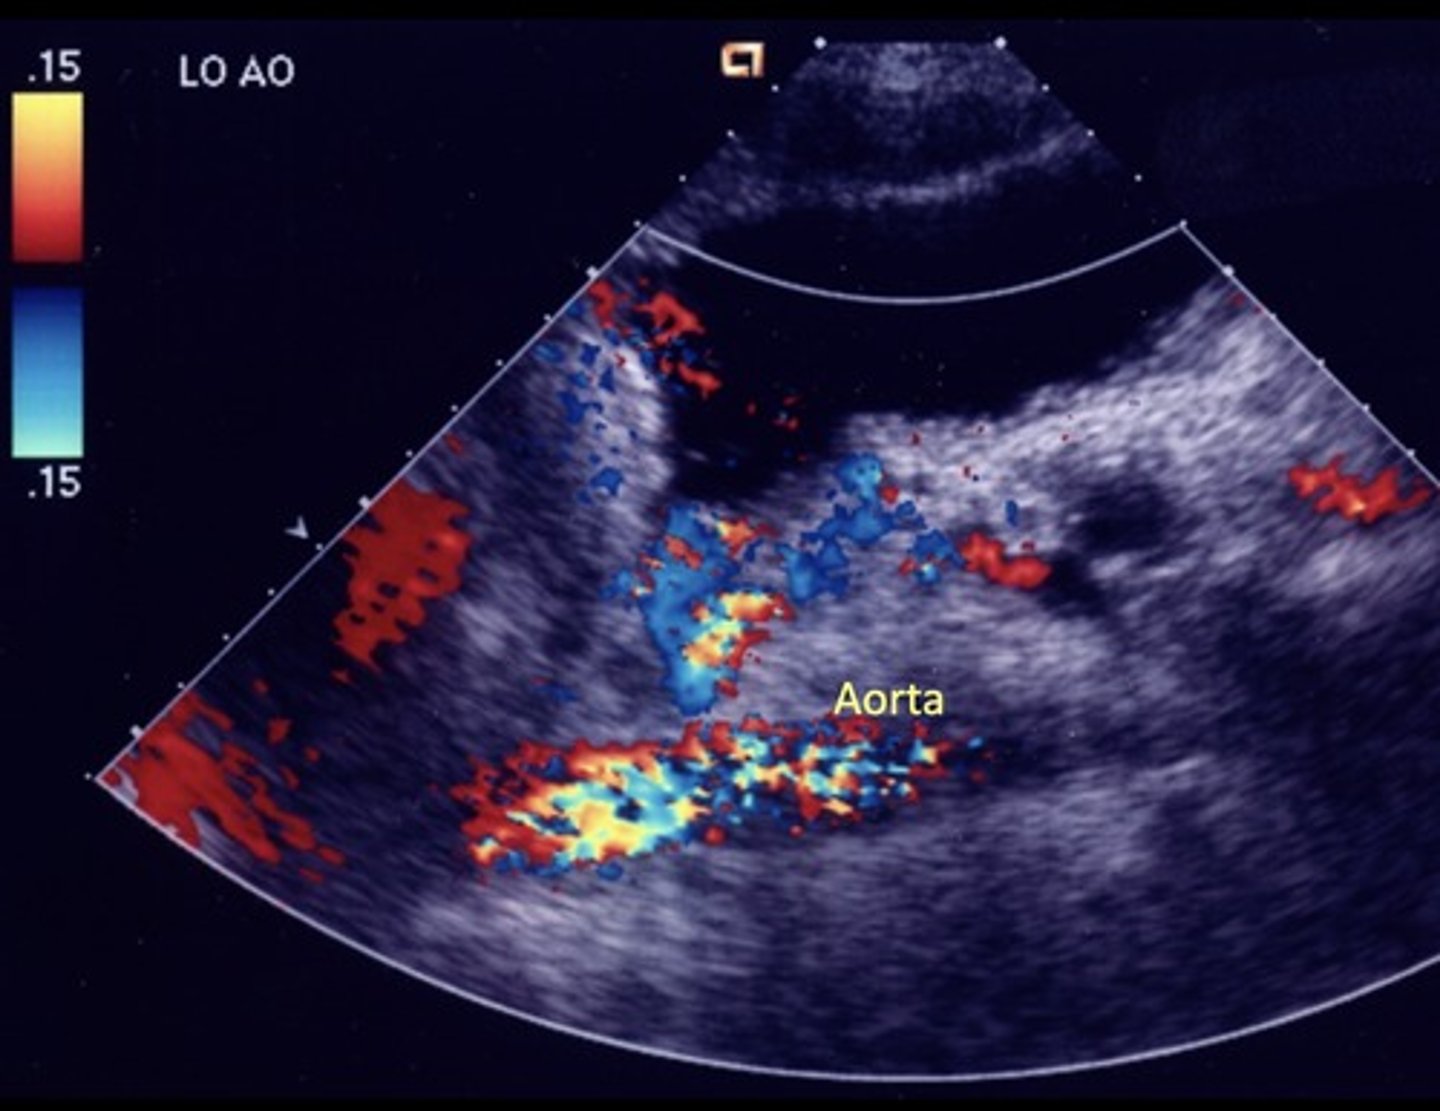
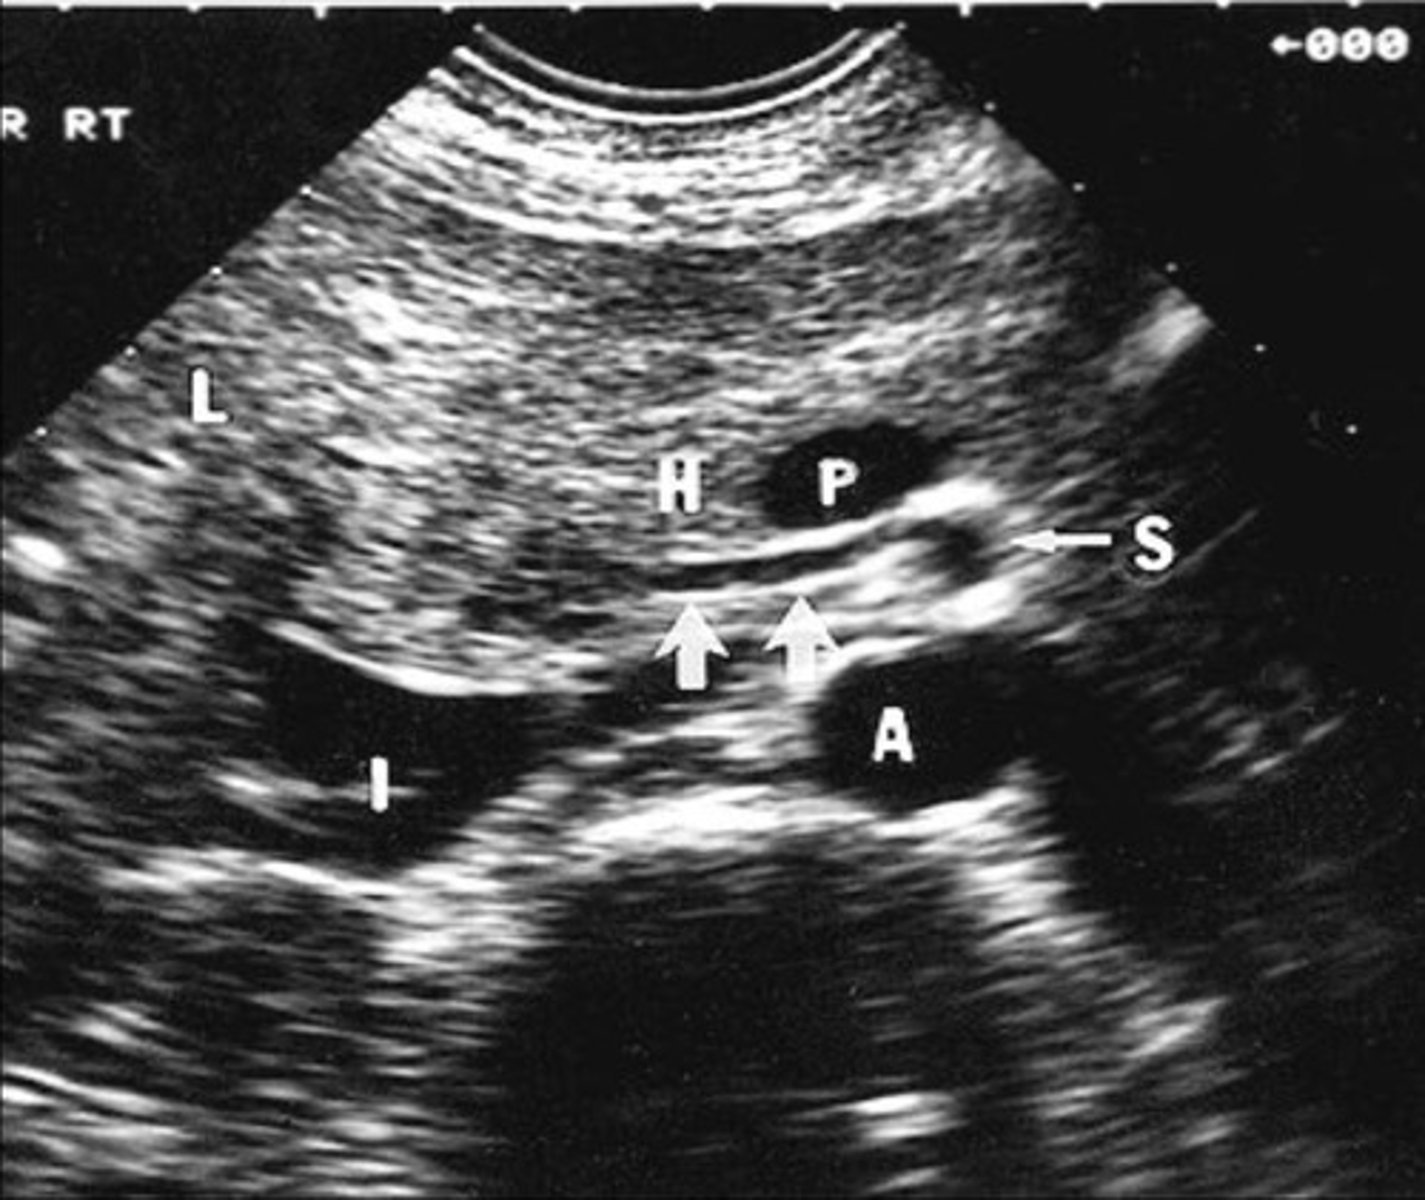
Aorta at level of celiac axis and SMA
Origin of celiac axis
Origin of SMA
Origin of IMA
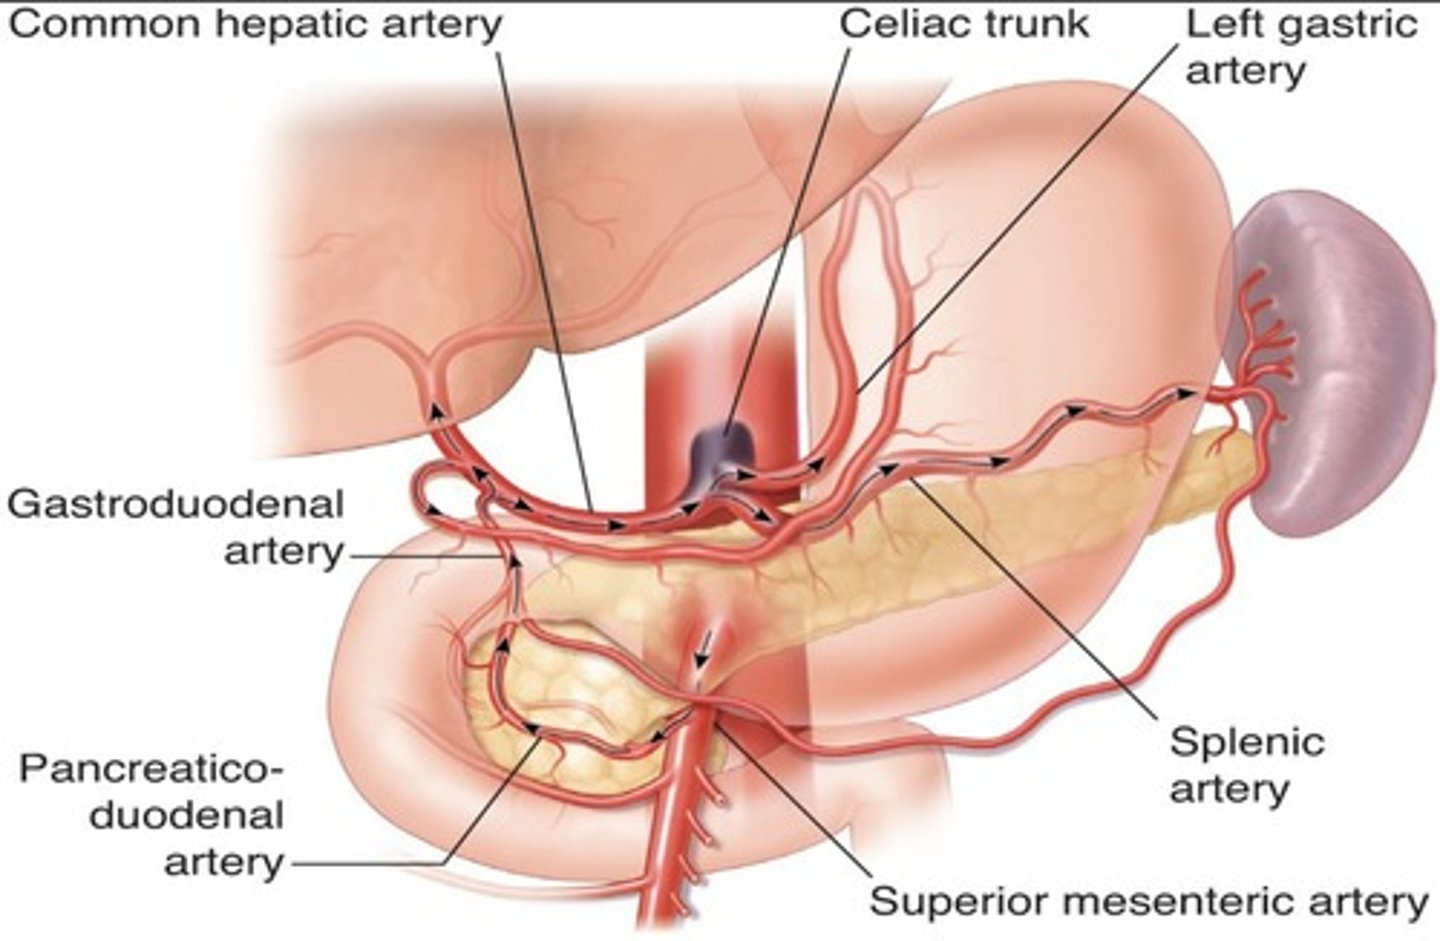
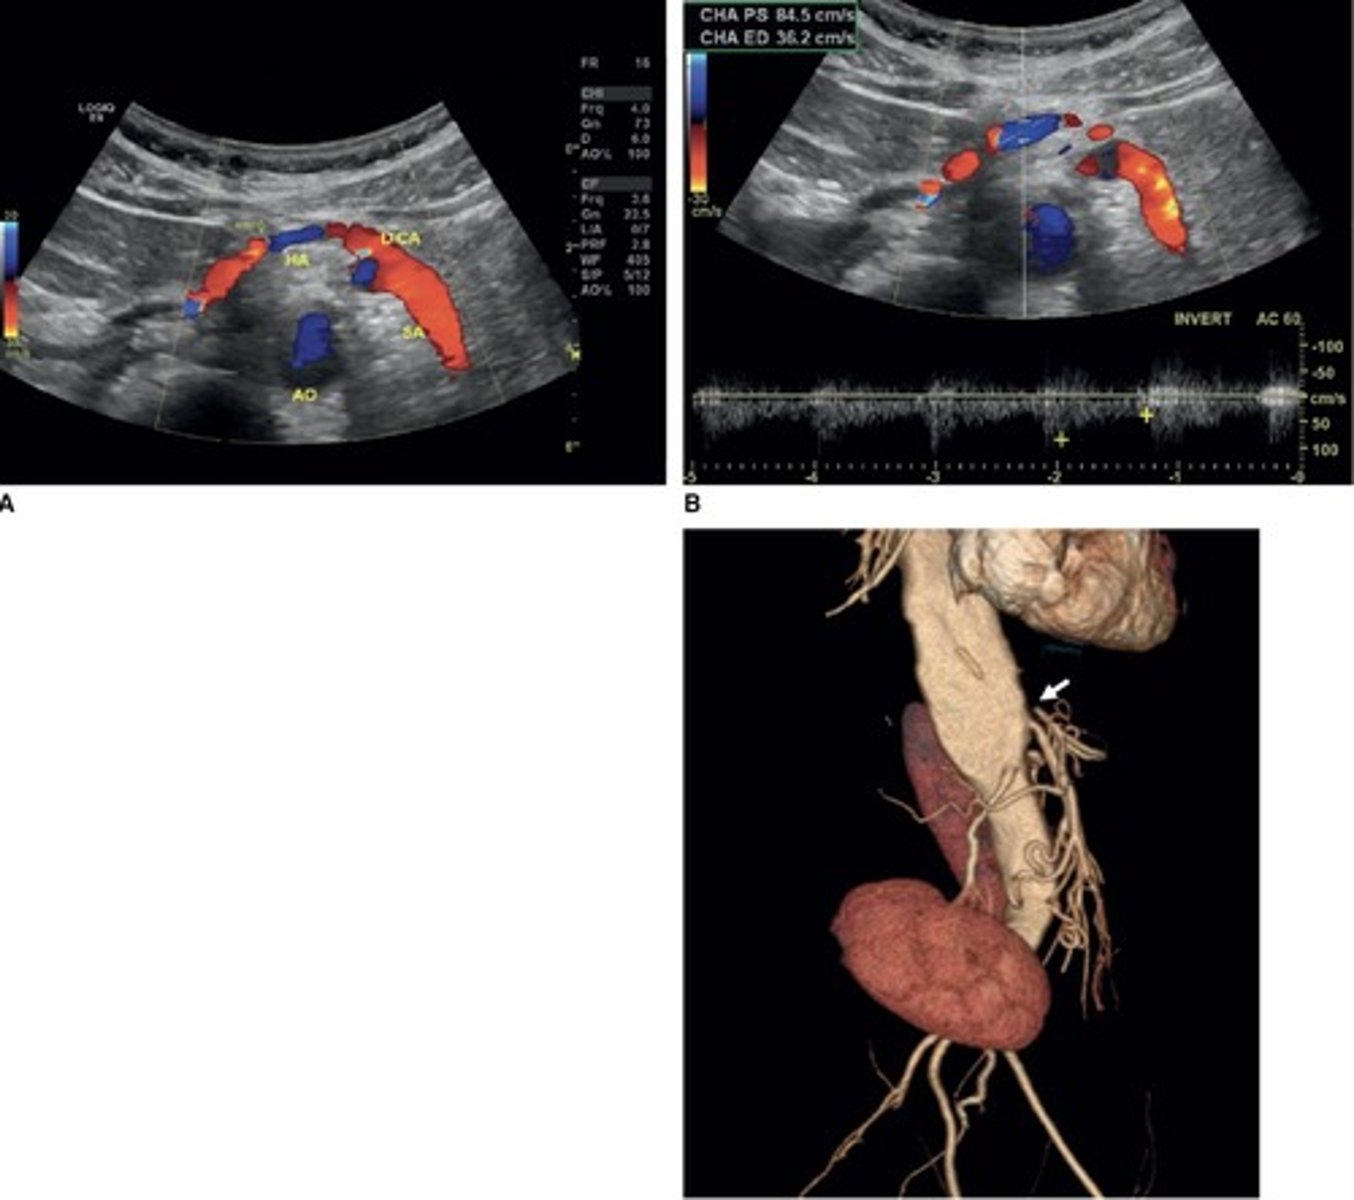
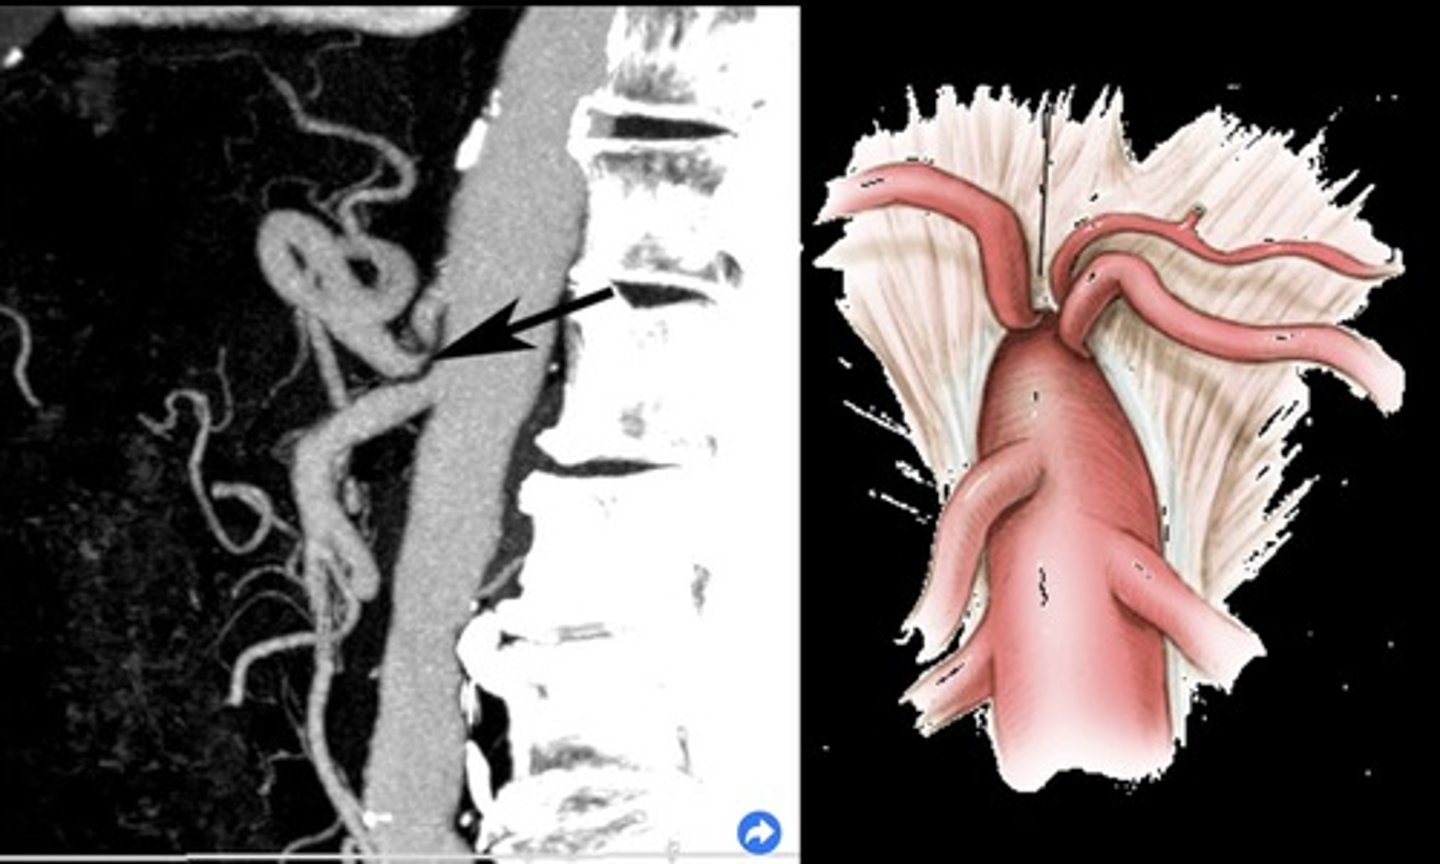
Celiac Artery
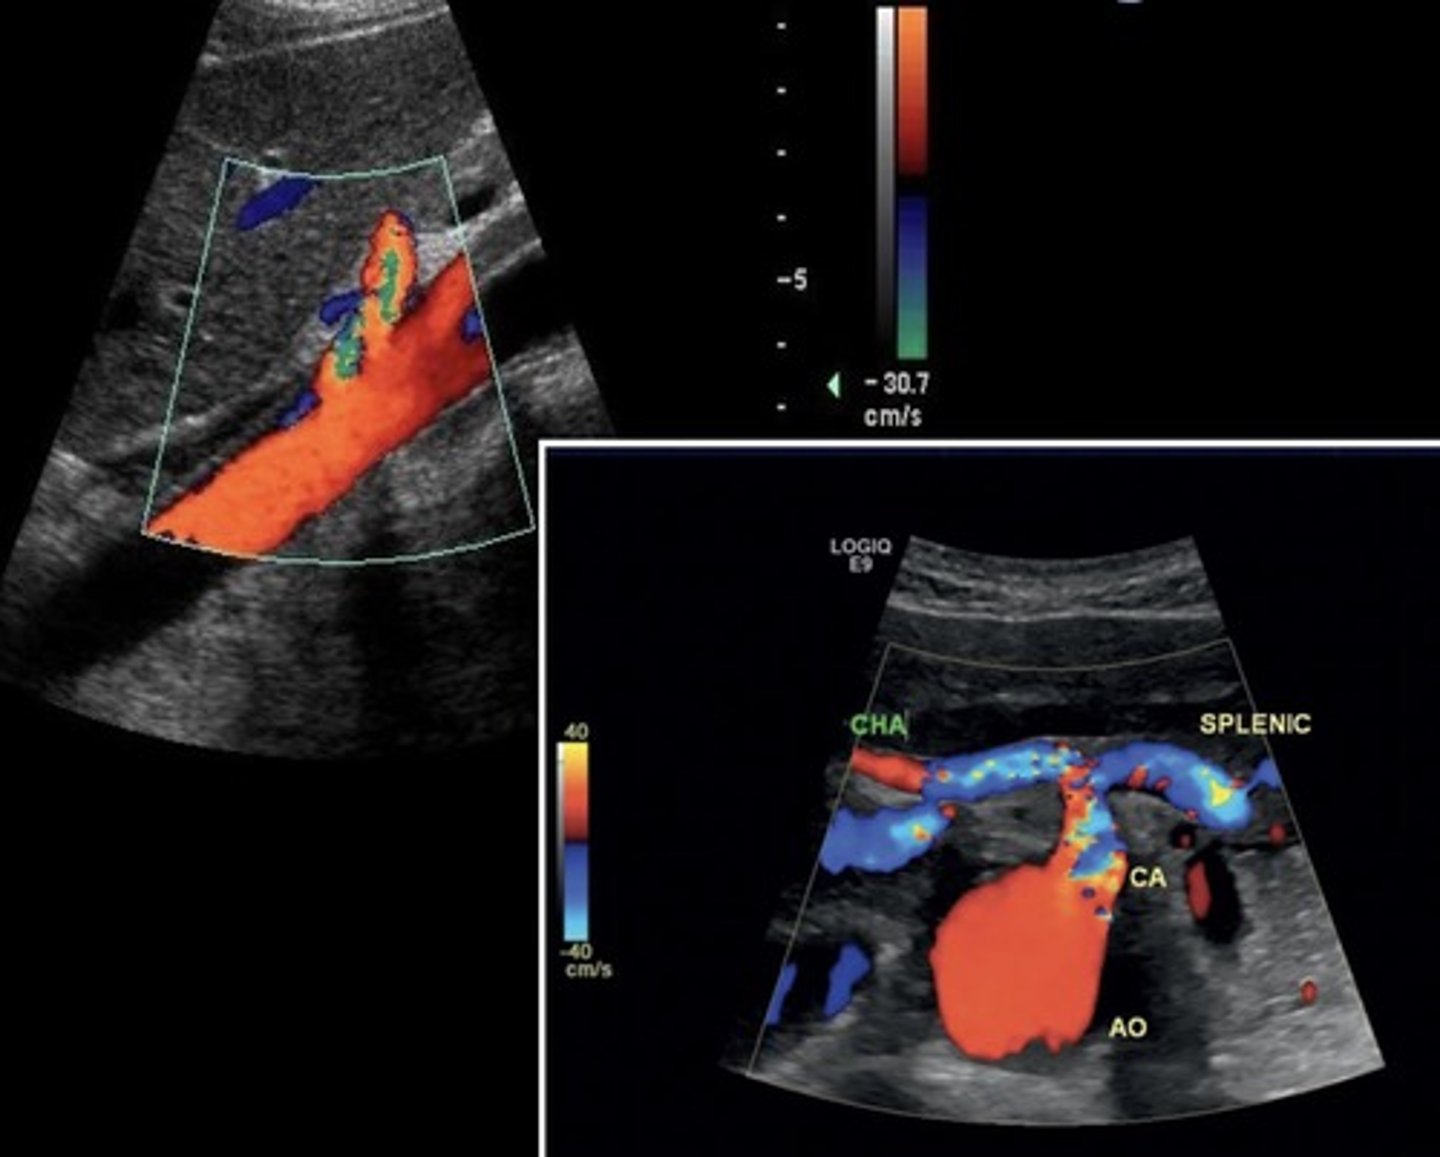
Celiac Artery Doppler Waveform
Low resistant
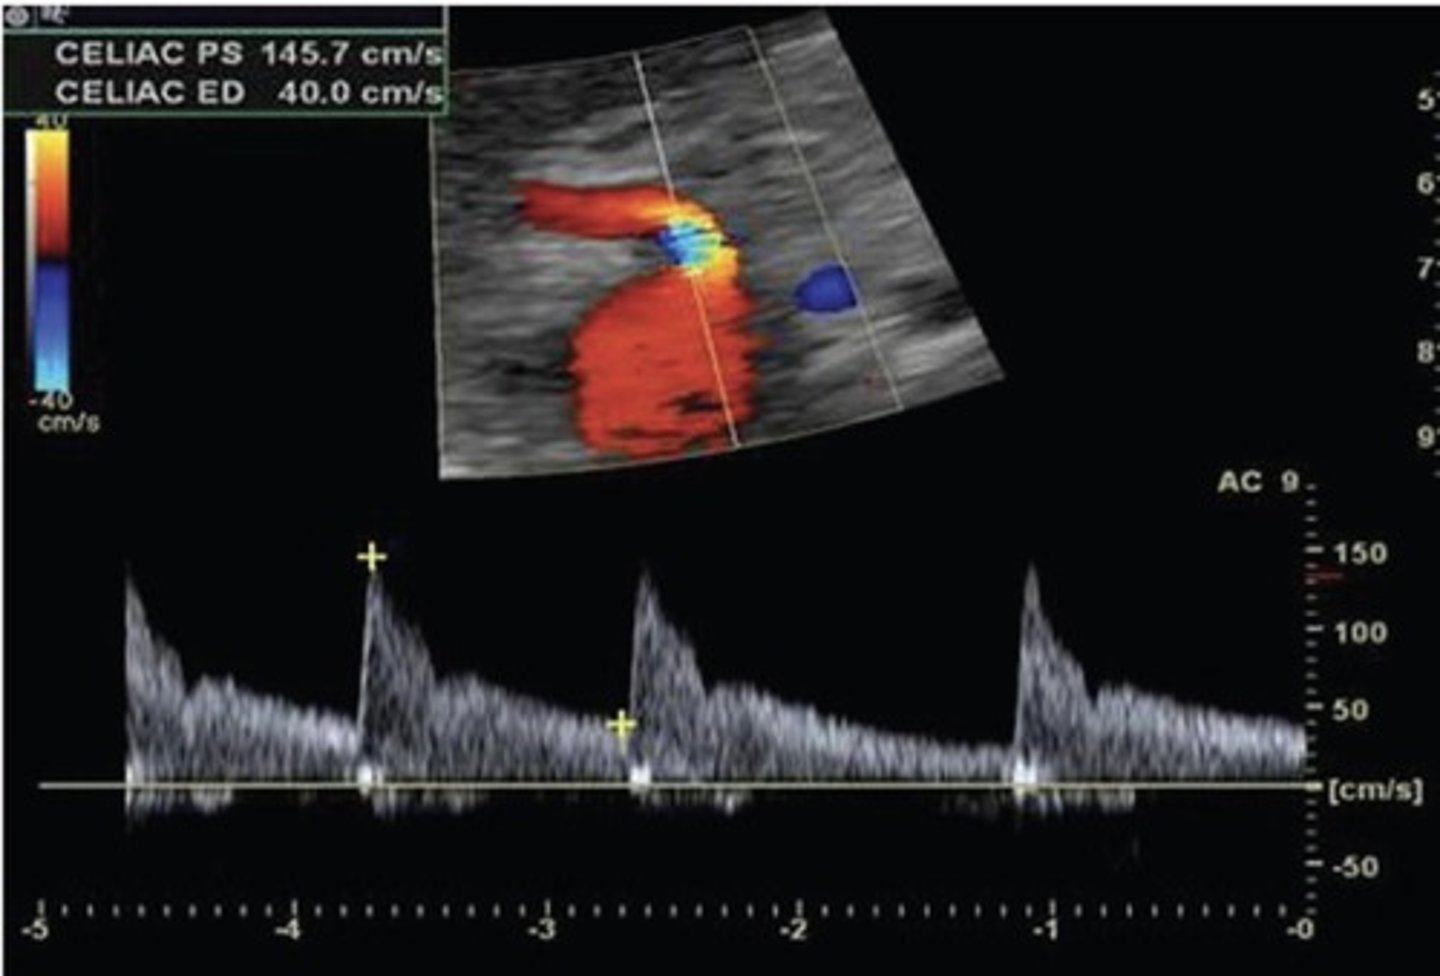
Celiac Artery PSV
101 cm/sec
Celiac Artery Occlusion
Results in SMA collaterals diverting blood through gastroduodenal artery toward the liver and spleen
Replaced Right Hepatic Artery
Right hepatic artery branches off something else besides celiac artery - usually SMA
Hepatic Artery Retrograde Flow
Due to celiac artery occlusion
Blood flows towards splenic artery - RABT color pattern
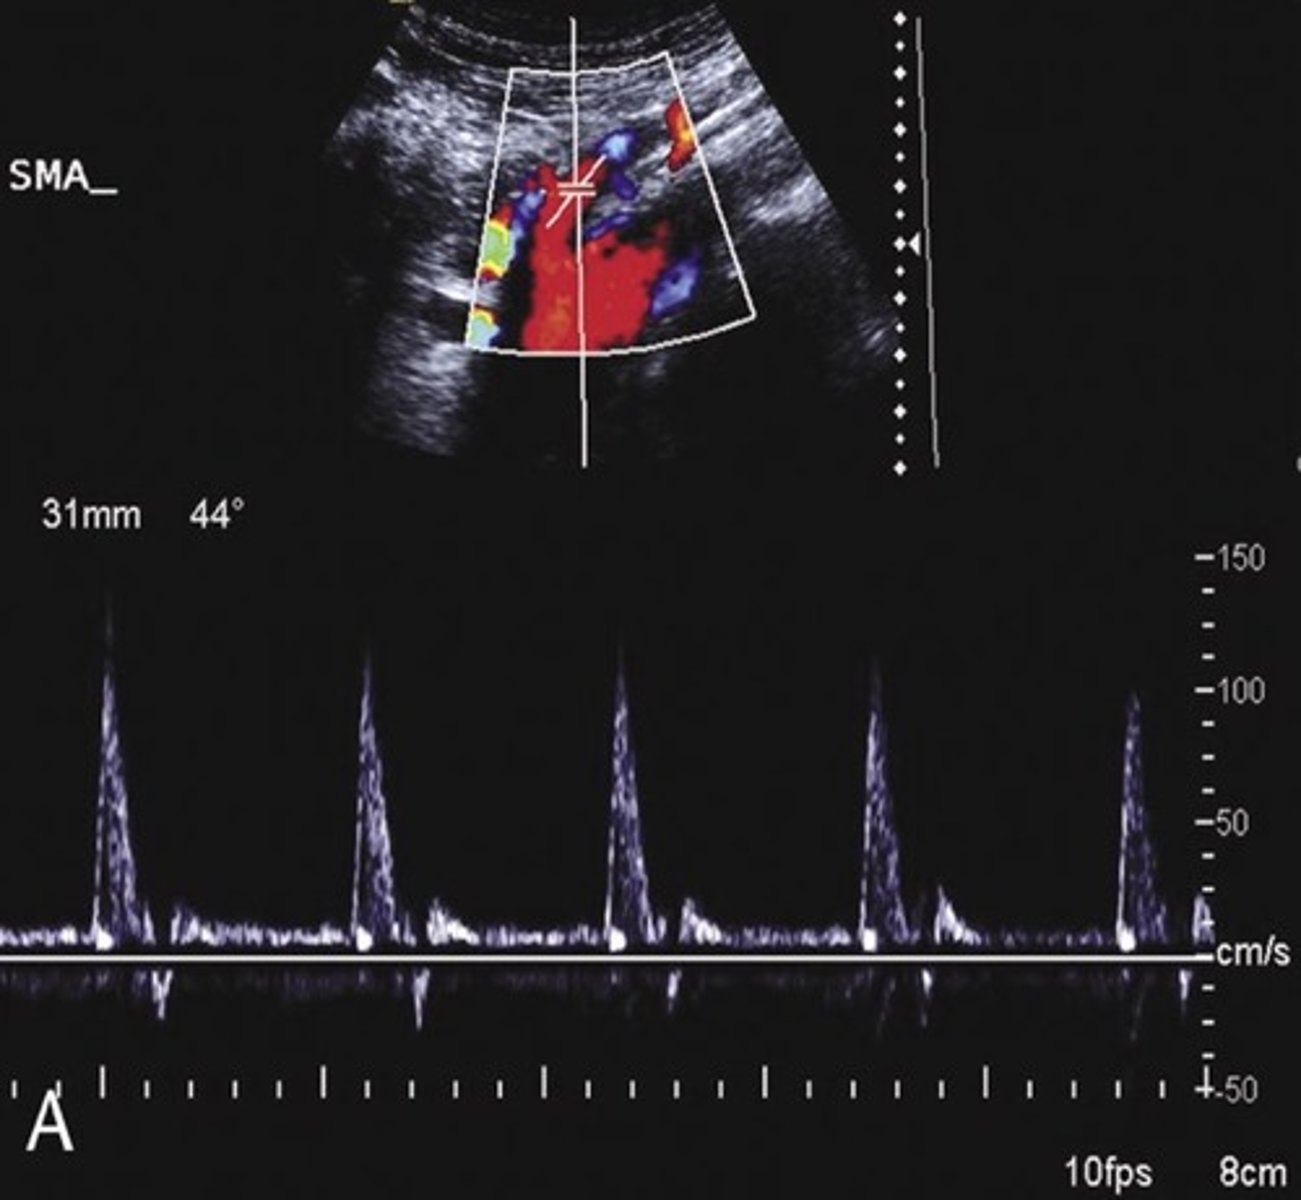
SMA
Pre-Prandial SMA Doppler
Post-Prandial SMA Doppler
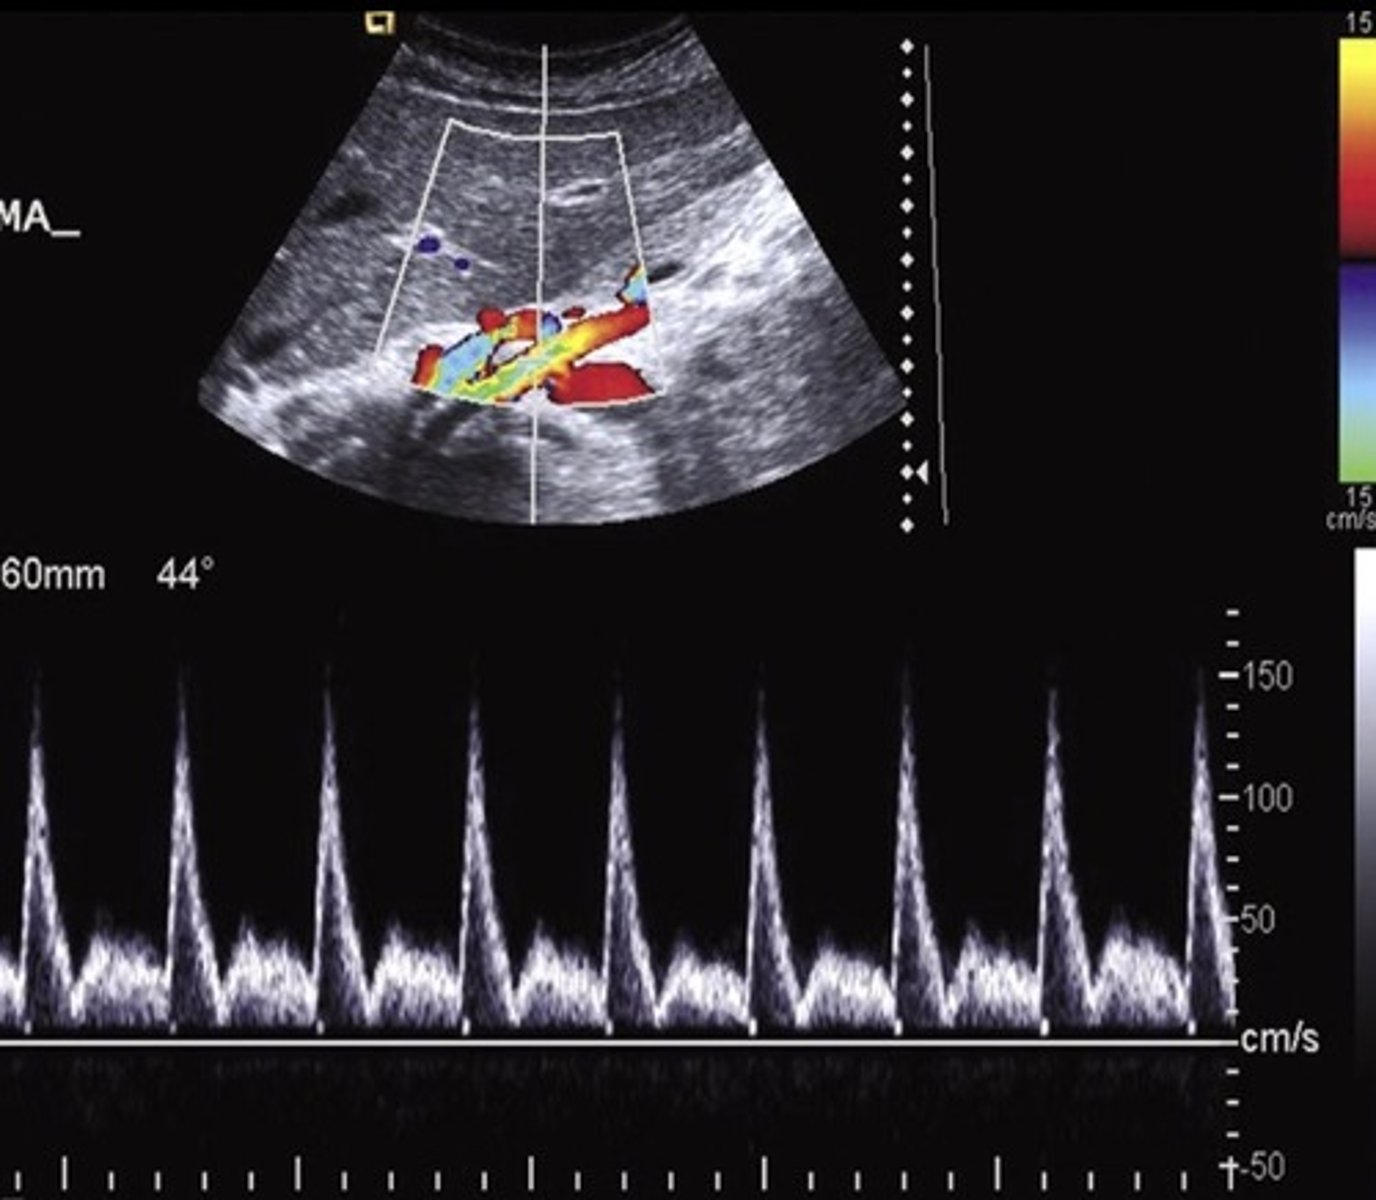
SMA PSV
113 cm/sec
Common Trunk Variant
Celiac and SMA come off common trunk
IMA
IMA PSV
141 cm/sec
Prominent IMA
Due to SMA occlusion
Median Arcuate Ligament Syndrome (MALS)
Compression of celiac axis during exhalation by median arcuate ligament
Pain relieved by inhalation
Evaluate in supine & upright positions and with inspiration & expiration
Celiac Artery PSV with MALS
> 250 cm/sec during expiration that normalizes with inspiration
Acute Mesenteric Ischemia
Thrombosis of one or more mesenteric vessels
Life threatening - requires immediate intervention
Severe cramping/pain - disproportional pain
Chronic Mesenteric Ischemia
Low resistant pre-prandial doppler signals
70% occlusion of 2/3 splanchnic arteries required for diagnosis (celiac, SMA, IMA)
Epigastric pain after eating - fear of food, weight loss, decreased nutrition
Small Vessel Disease
Fasting low resistant waveform
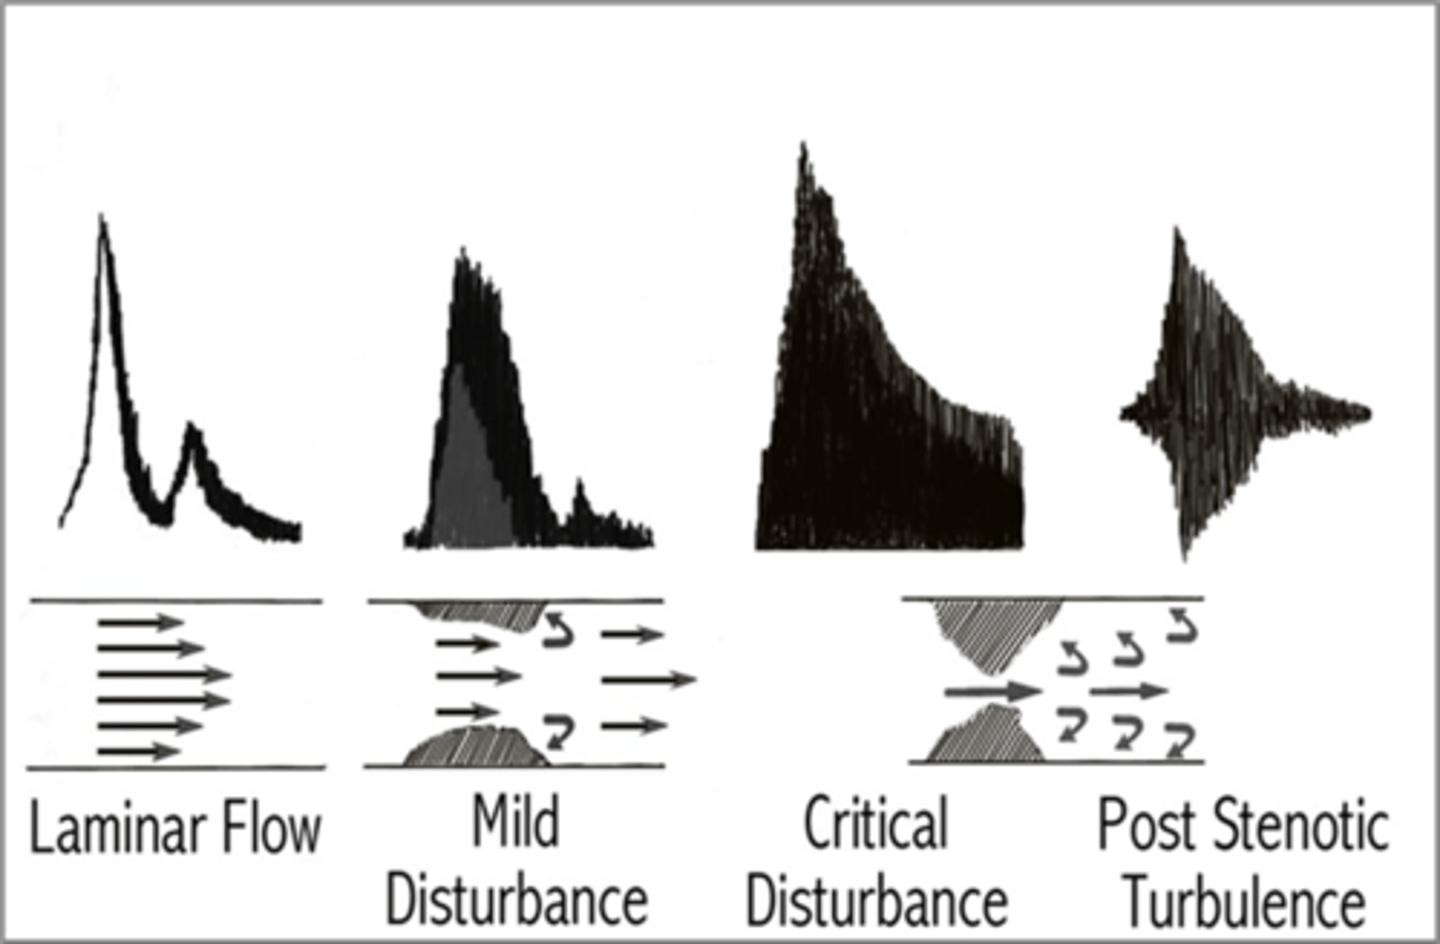
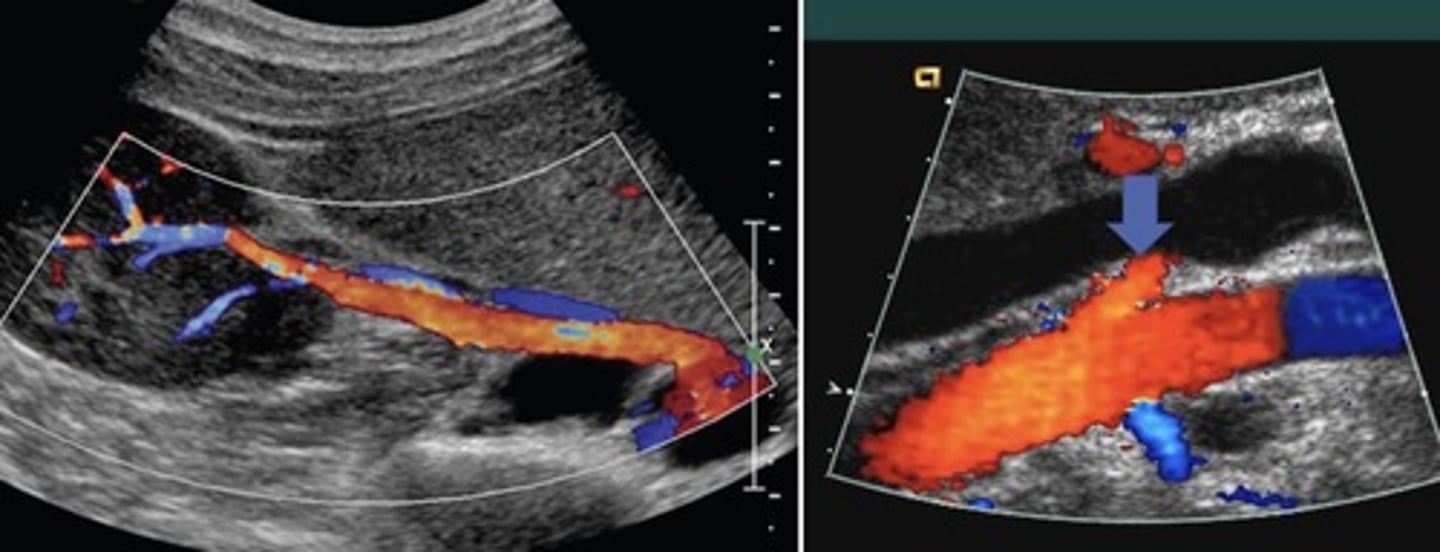
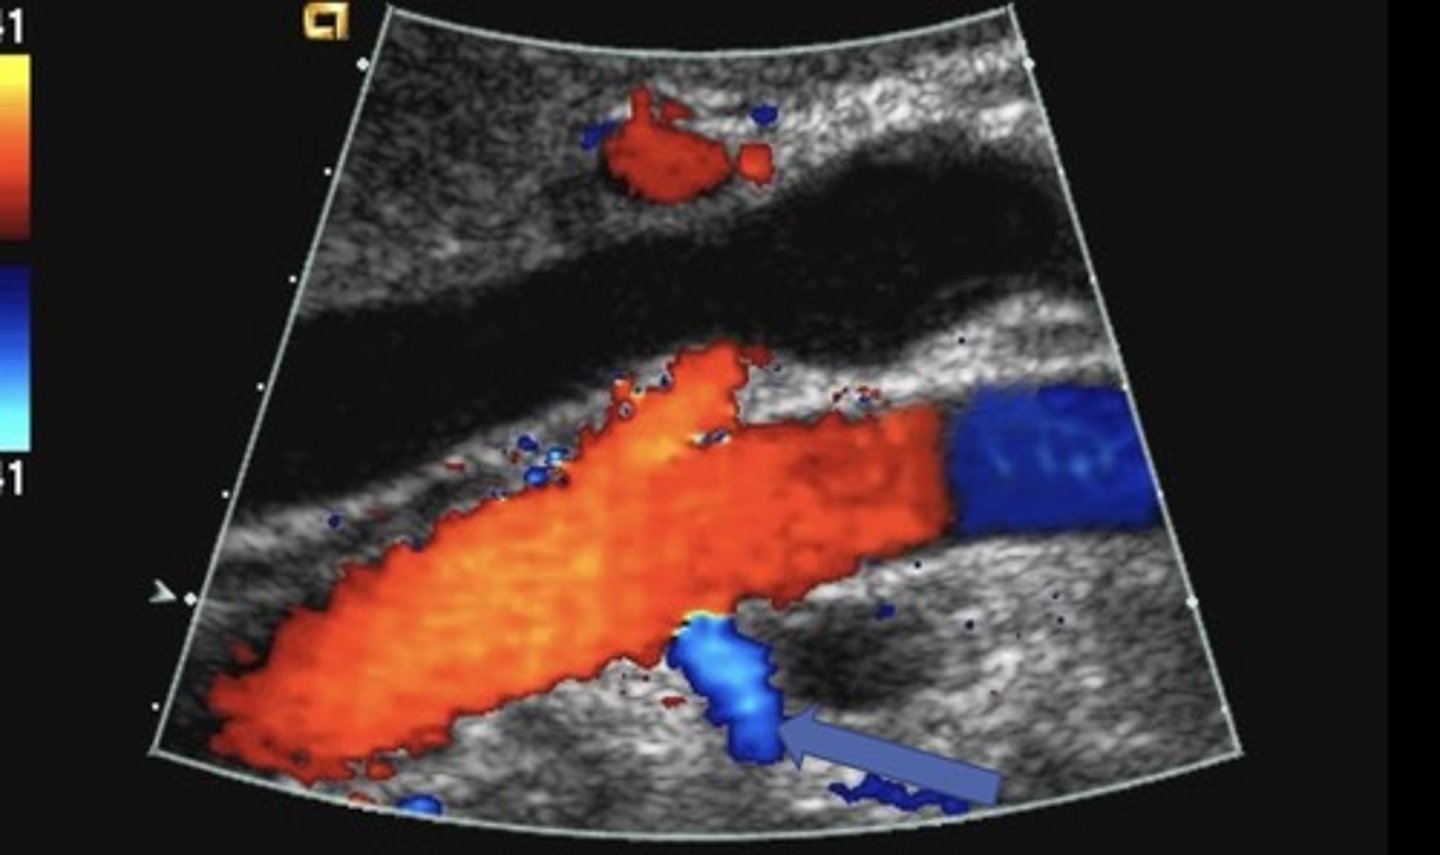
Stenosis
Stenotic profile
Treated with stents
Right Renal Artery
Posterior to IVC and RRV
Left Renal Artery
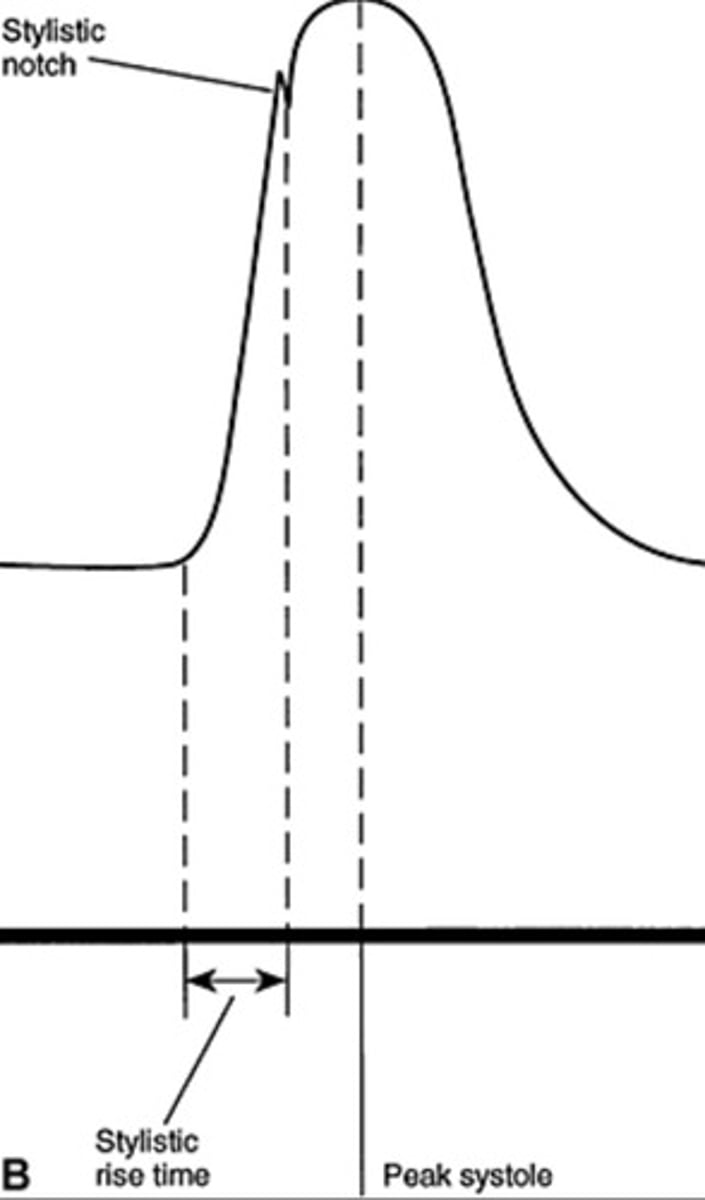
Normal Renal Artery Spectral Waveform
Rapid upstroke
Early systolic peak
Renal A. Origin PSV
74-127 cm/sec
Distal Renal A. PSV
70-90 cm/sec
Renal A. Sinus PSV
30-50 cm/sec
Renal A. Cortex PSV
10-20 cm/sec
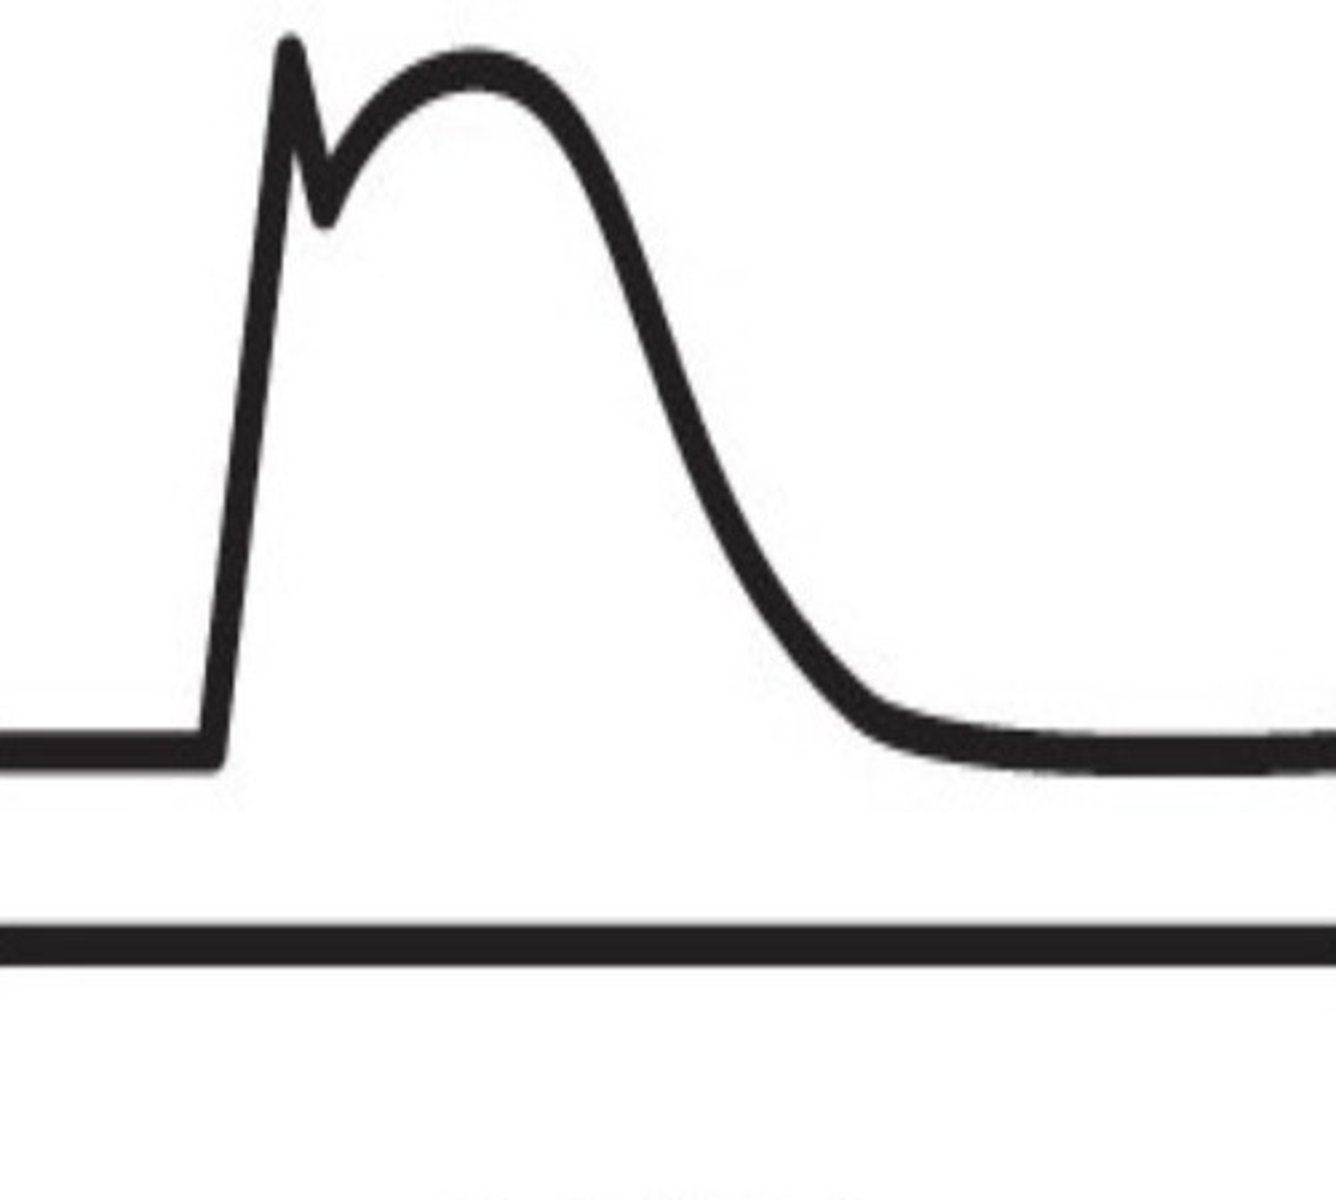
0-59% Stenosis Waveform
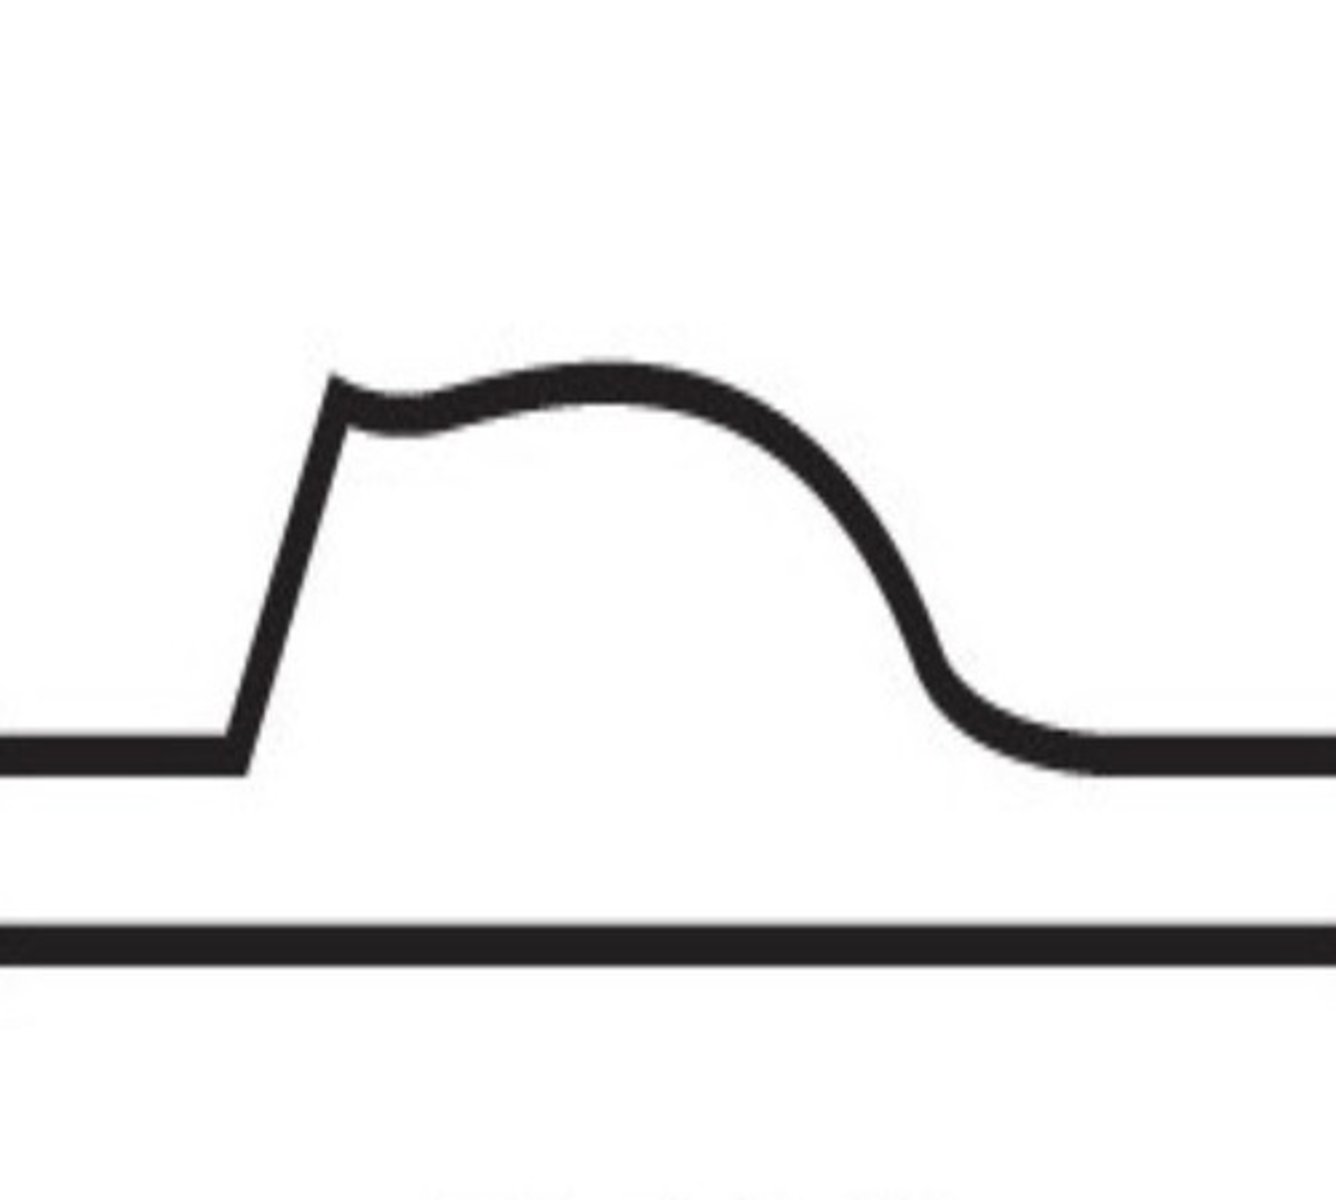
60-70% Stenosis Waveform
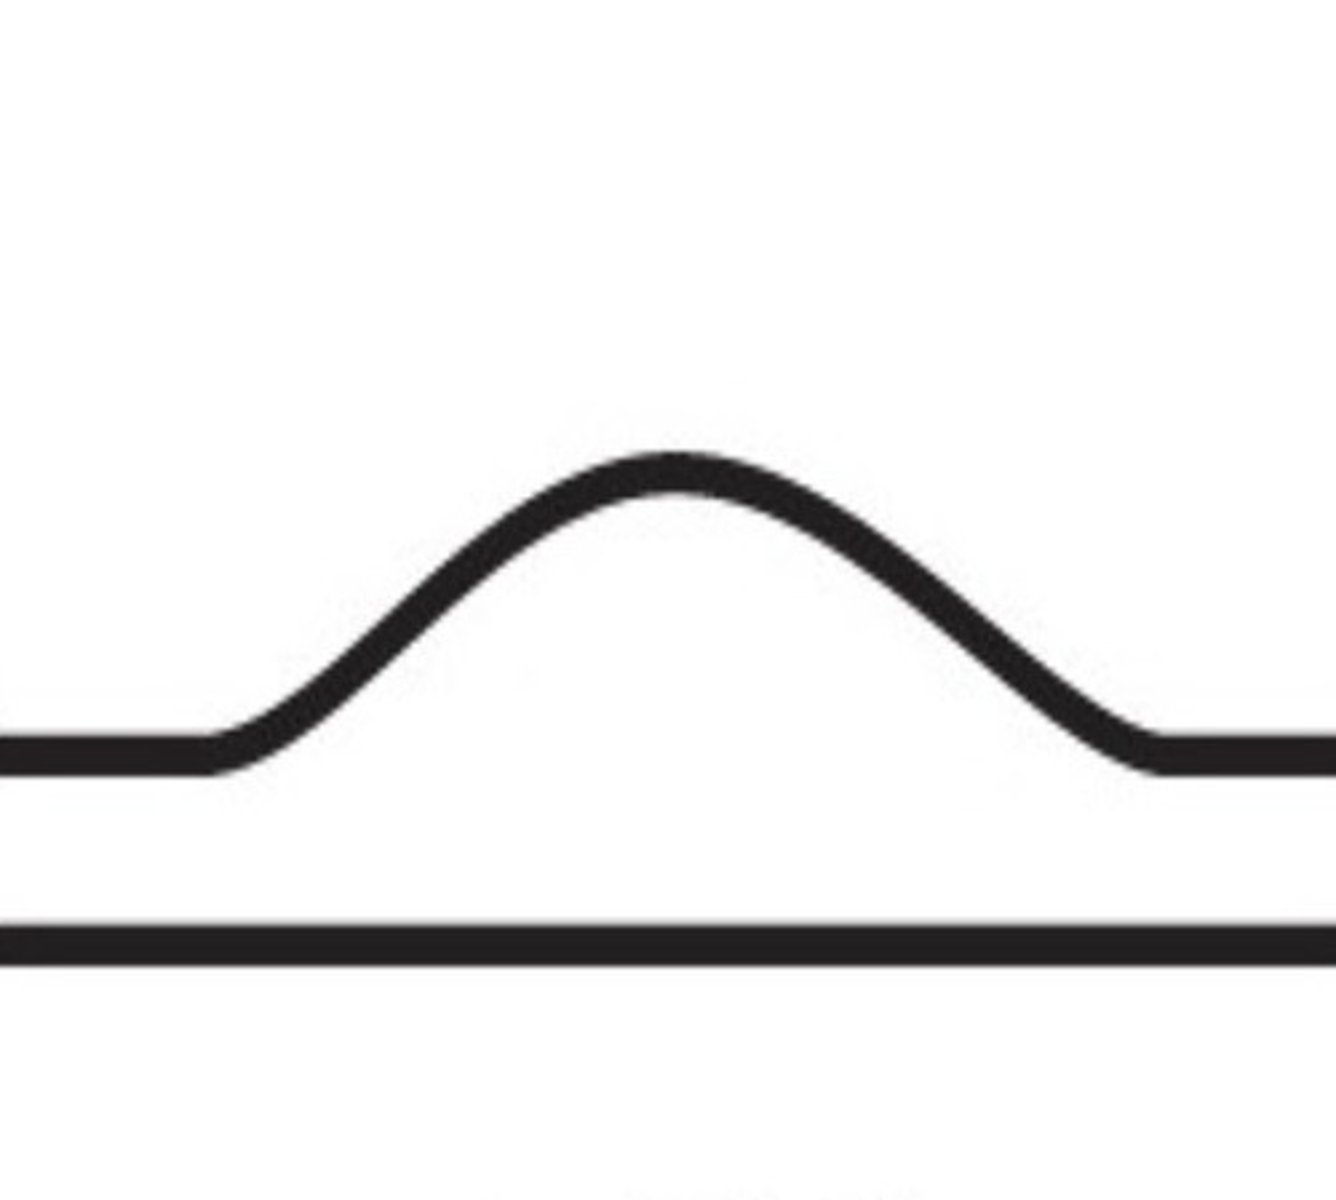
> 80% Stenosis Waveform
PSV Criteria for ≥ 60% Stenosis
> 180 cm/sec (without angle correct)
> 150 cm/sec (with angle correct & turbulence)
Direct Renal Artery Exam
Uses velocities & RAR
Normal RAR
< 3.5
Indirect Renal Artery Exam
Uses acceleration time, acceleration index, and waveform assessments
Acceleration Time (AT)
Time it takes for the to reach early systolic peak
Normal Acceleration Time
< 0.1 seconds
Normal Acceleration
> 291 cm/sec^2
Normal Renal Vein Doppler
Continuous pattern with mild respiratory variations
Sonographic Appearance of Renal Vein Thrombosis
Enlarged kidney
Enlarged vein with internal echoes
Lack of color fill
Biphasic/high resistant arterial signal
Acute Tubular Necrosis (ATN)
Due to ischemia that develops between recipient removal to donor transplant
Common with cadaver donor kidneys
Occurs early post-op
Appearance of Acute Tubular Necrosis (ATN)
Enlarged kidney
Loss of corticomedullary boarders
Parenchymal Graft Failure Causes
Acute tubular necrosis (ATN)
Rejection
Cyclosporin toxicity
Vascular Transplant Failure Causes
Thrombosis
Stenosis
Urological Transplant Failure Causes
Obstruction
Extrinsic compression
Fluid collections
Symptoms of Renal Transplant Rejection
Sudden cessation of urine output (anuria)
Decreased urine output (oliguria)
Increased serum creatinine, protein, or lymphocytes in urine
Hypertension
Swelling or tenderness of the graft
Hyperacute Transplant Rejection
Minutes to hours
Rare
Due to faulty crossmatching tests
Completely destroys graft
Removed immediately
Acute Transplant Rejection
2 weeks - 3 months
Common in cadaver donor kidneys
Appearance of Acute Transplant Rejection
Enlarged kidney
Loss of corticomedullary boarder
Decrease in diastolic flow or flow reversal
RI > 0.8
Chronic Transplant Rejection
3 months - years