Chapter 3 - Assessment, Effect Size, and Ethics - The Personality Puzzle (8th Edition) - PSY 2530
1/26
There's no tags or description
Looks like no tags are added yet.
Name | Mastery | Learn | Test | Matching | Spaced | Call with Kai |
|---|
No analytics yet
Send a link to your students to track their progress
27 Terms
personality assessment
Tests that measure personality traits (enduring tendencies to feel, think, and act in certain ways).
These patterns include motives, intentions, goals, strategies, and subjective representations (the ways in which people perceive and construct their worlds).
They indicate the degree to which a person desires one goal over another, or thinks the world is changeable as opposed to fixed, or is generally happy, or is optimistic as opposed to pessimistic, or is sexually attracted to members of the same or the opposite sex.
projective tests
Tests designed to reveal inner aspects of individuals' personalities by analysis of their responses to a standard series of ambiguous stimuli.

Rorschach tests
A projective test that asks subjects to interpret blots of ink.
Often called "the inkblot test"

TAT
Thematic Apperception Test
A projective test in which subjects look at and tell a story about ambiguous pictures.

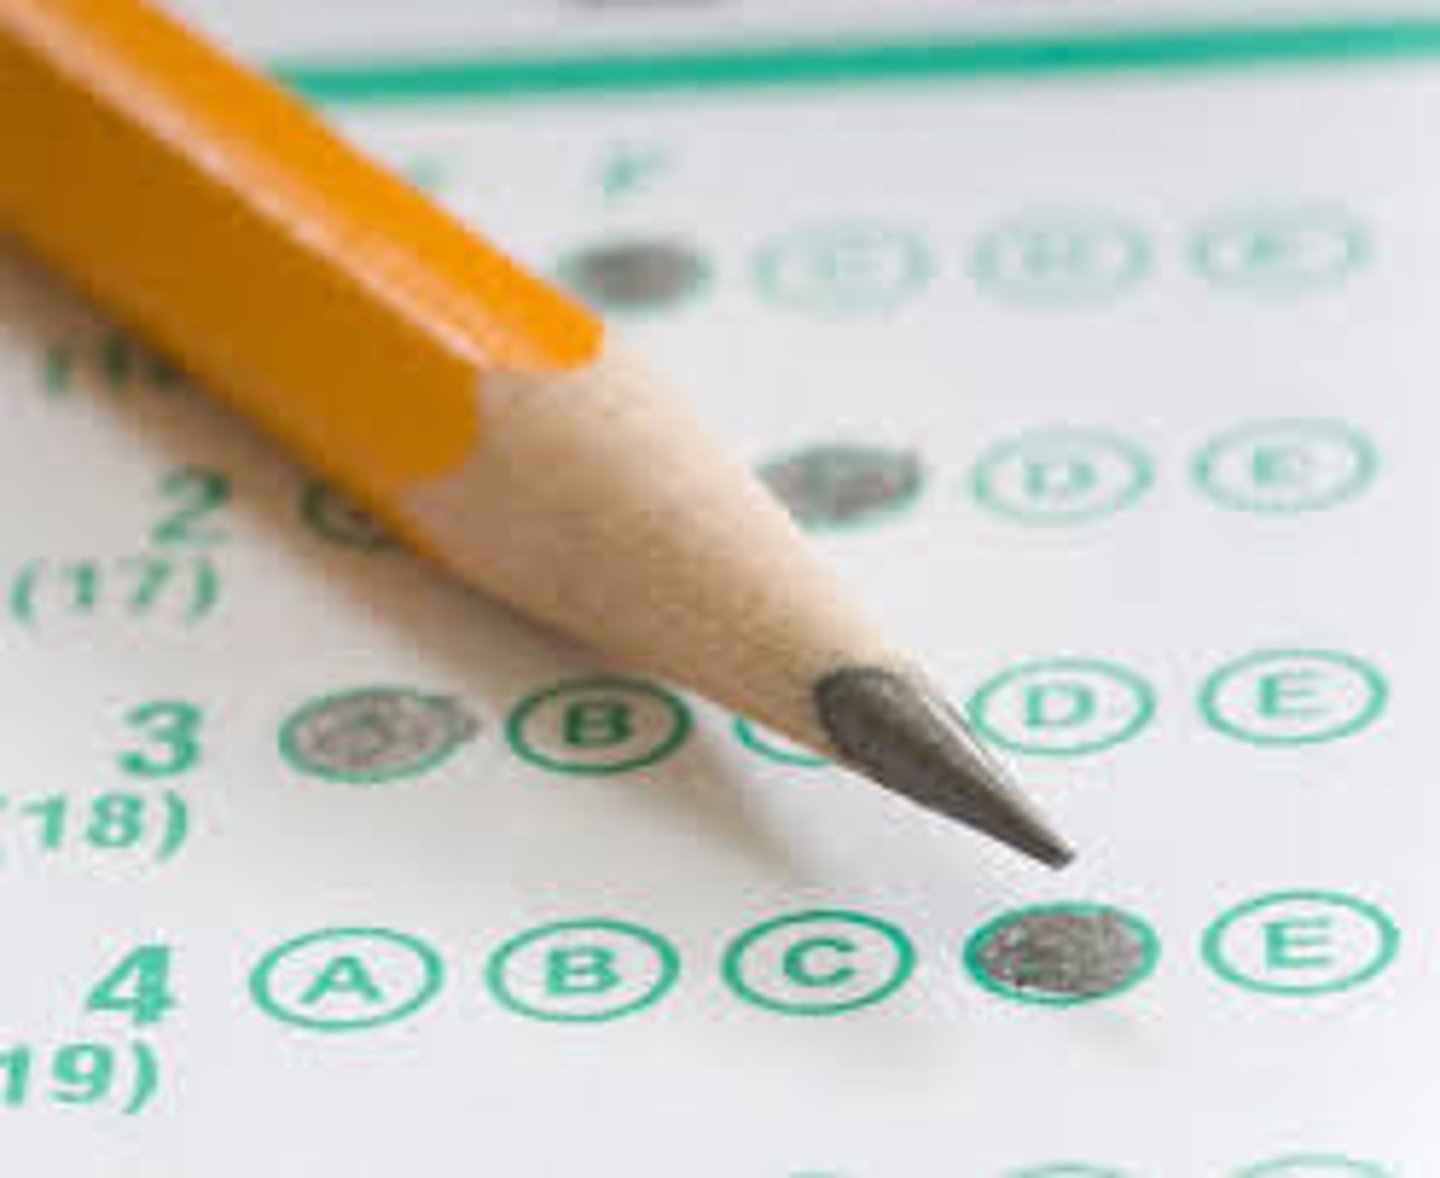
objective tests
Tests of personality that can be scored objectively and that are based on a research foundation.
These tests can be scored easily by machine, such as multiple-choice tests and selected-response tests.
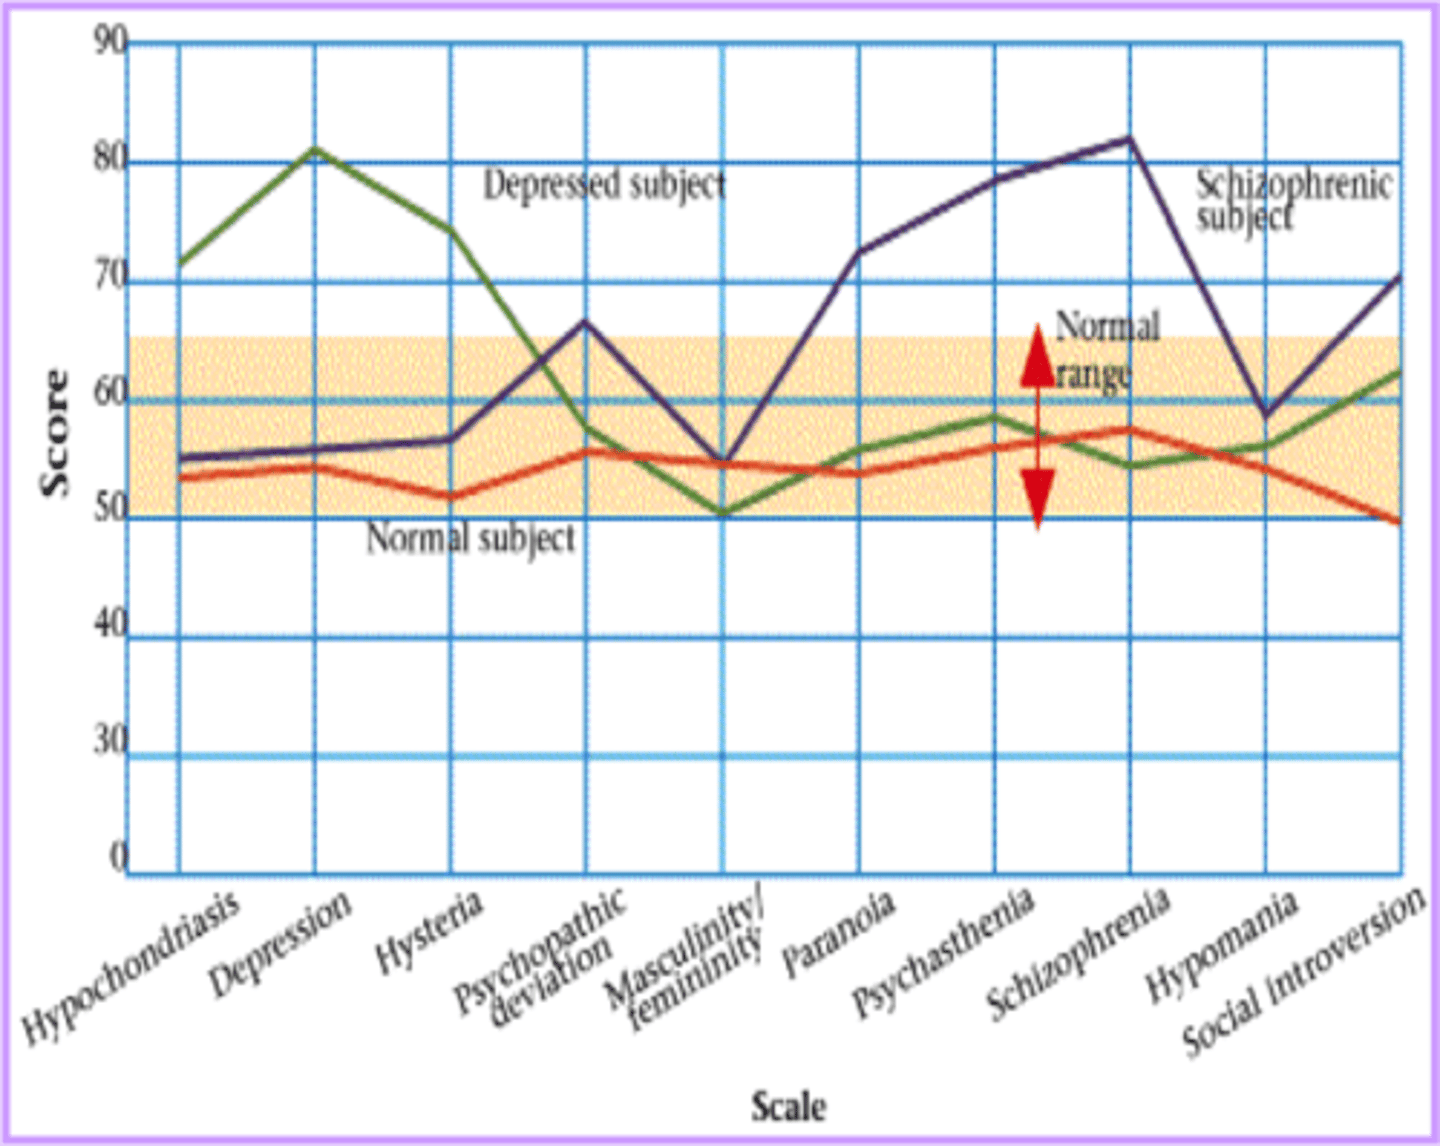
The MMPI
Minnesota Multiphasic Personality Inventory
An objective test which is the most widely researched and clinically used of all personality tests.
Originally developed to identify emotional disorders (still considered its most appropriate use), this test is now used for many other screening purposes such as employment screening.
omnibus inventories
Assessments designed to measure a wide range of personality traits.
For example, The NEO Personality for instance, measures five broad traits along with 30 subscales or "facets."
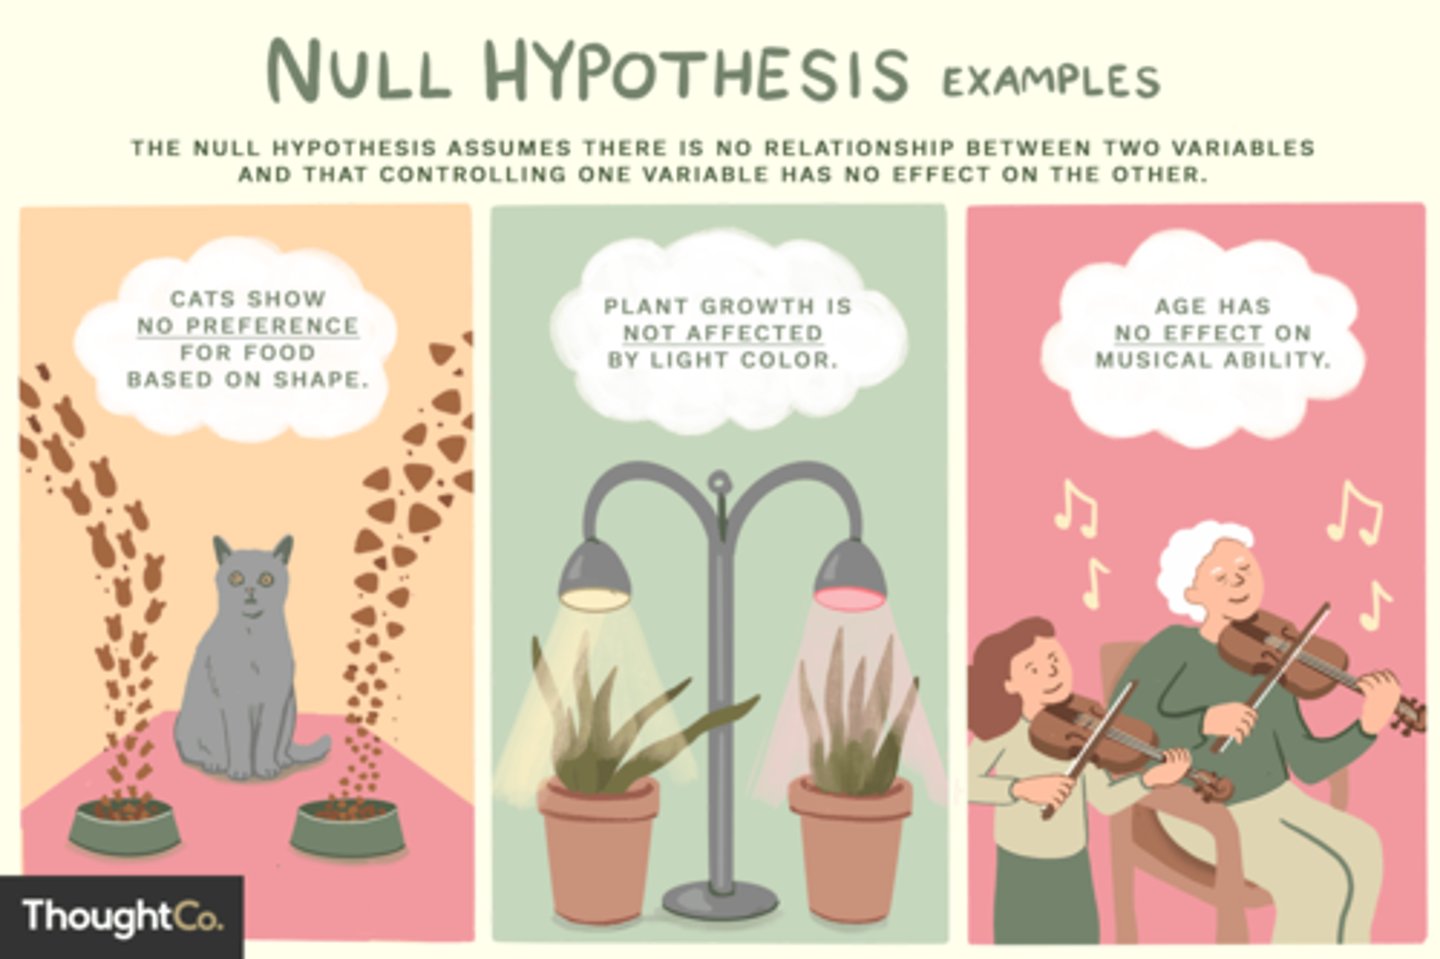
null hypothesis
States that there is no relationship between the two variables being studied (one variable does not affect the other). It states results are due to chance and are not significant in terms of supporting the idea being investigated.
This is done because it is much easier to disprove something than to prove something in science.
statistical significance
The condition that exists when the probability that the observed findings are due to chance is very low (5% or less / a confidence level of 95%).
factor analysis
A statistical technique for finding clusters of related traits, tests, or items.
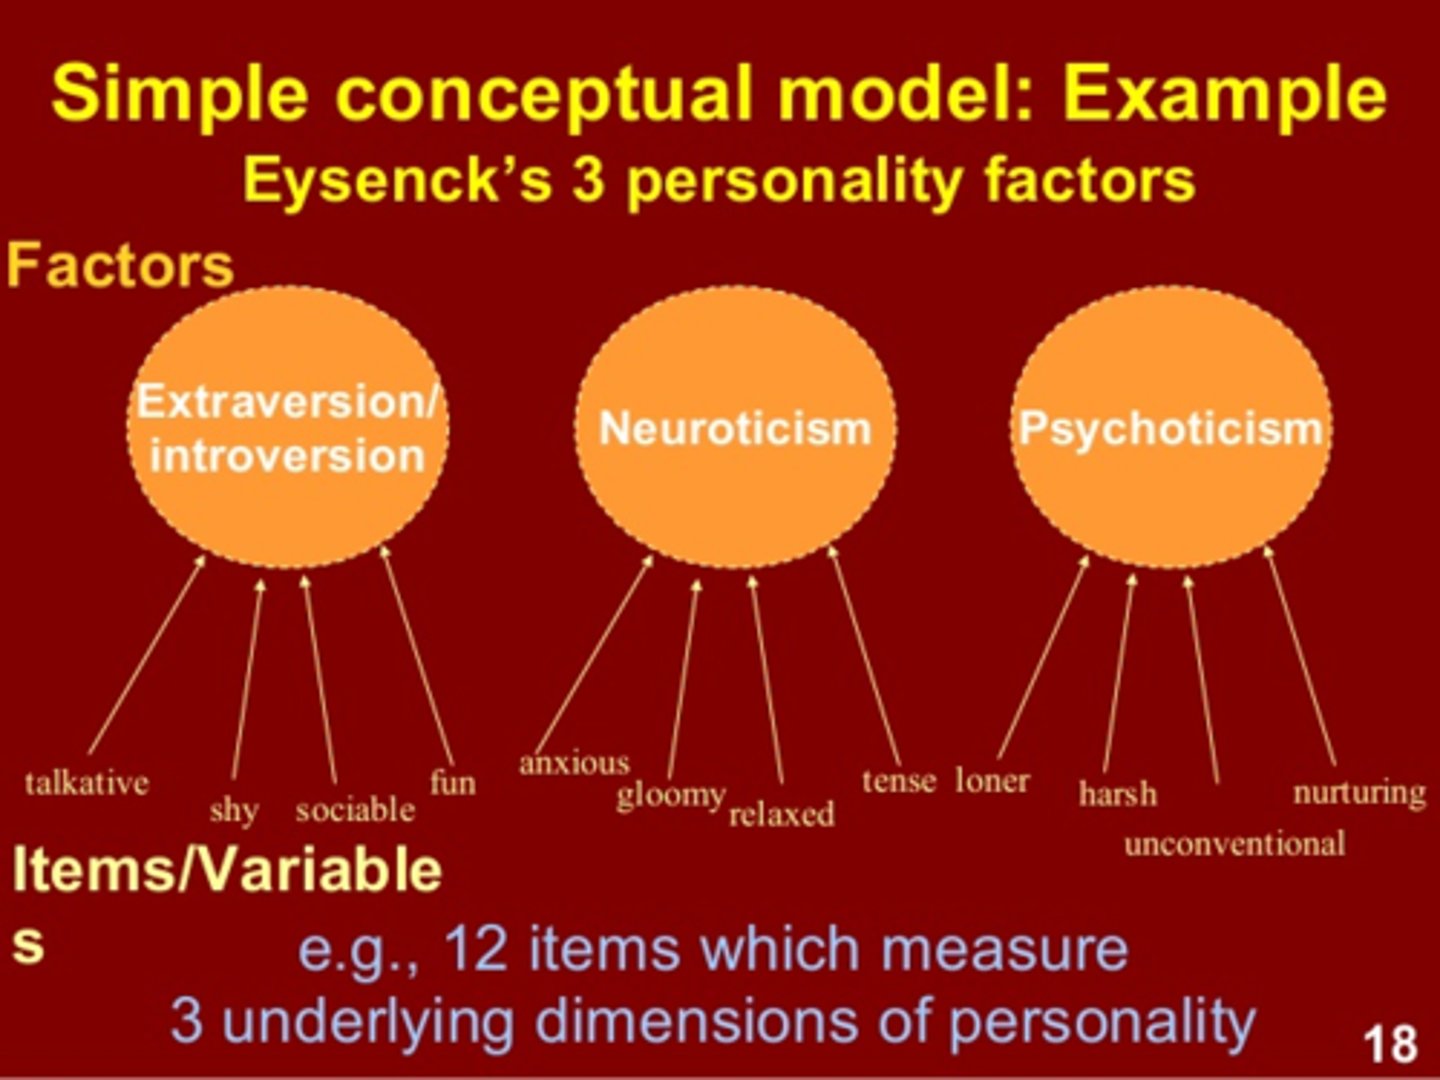
How is factor analysis used to calculate the "Big Five?"
The analysis is based on calculating correlation coefficients between each item and each of the other items. The items that correlate most highly with each other can be assembled into groups.
For example, if a person answers True to the item "I trust strangers," you will find that he is also likely to answer True to "I am careful to turn up when someone expects me" and answer False to "I could stand being a hermit."
Such a pattern of likelihood, or co-occurrence, means that these three items are correlated. The next steps are to consider what the items have in common, and then name the factor.
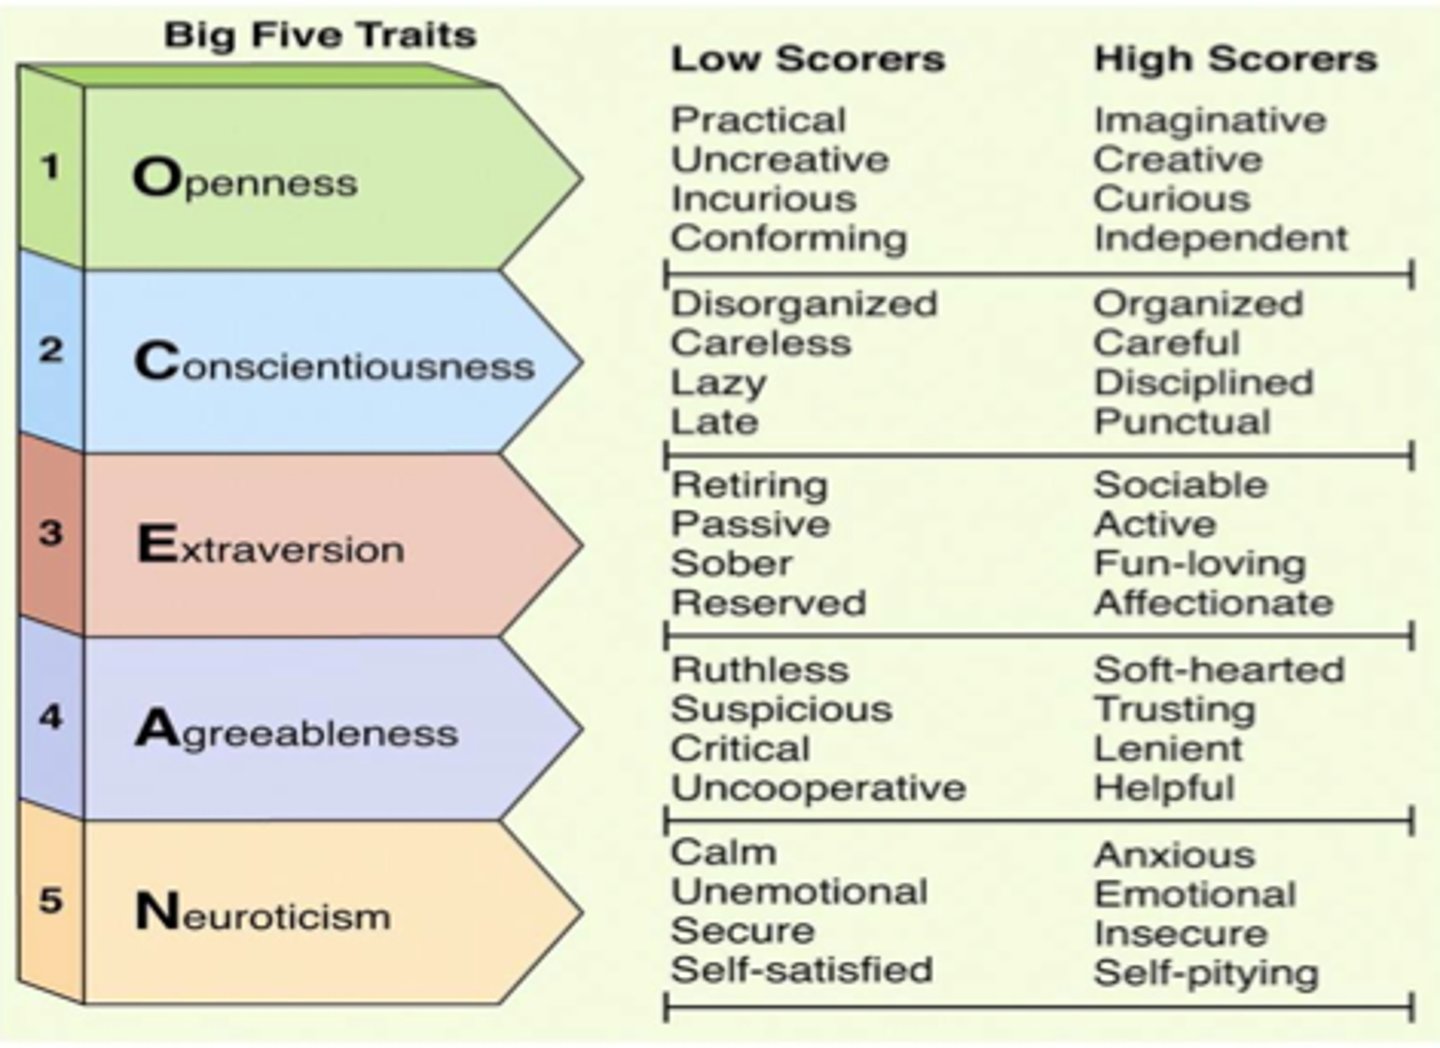
What are the "Big Five" personality traits?
openness, conscientiousness, extraversion, agreeableness, neuroticism
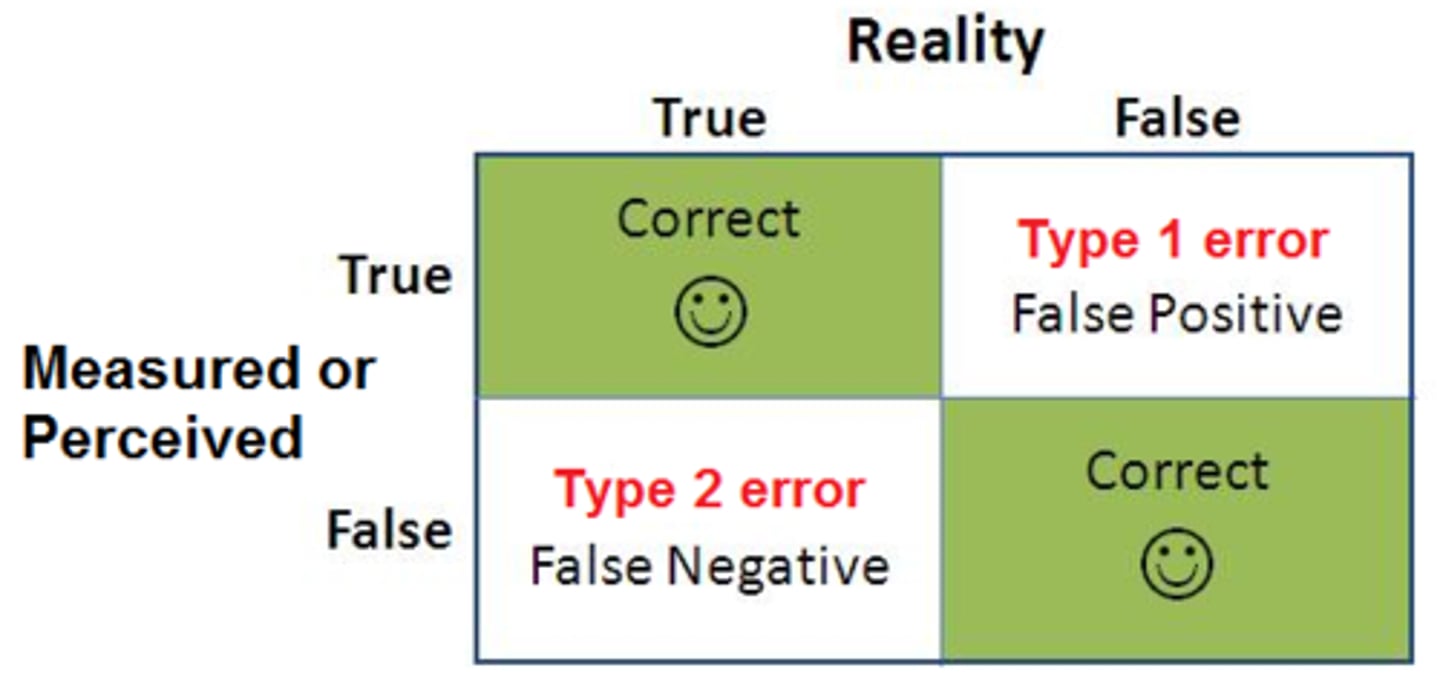
Type I Error
In research, the mistake of thinking that one variable has an effect on, or relationship with, another variable, when really it does not.
A "false positive."
Rejecting a true null hypothesis.
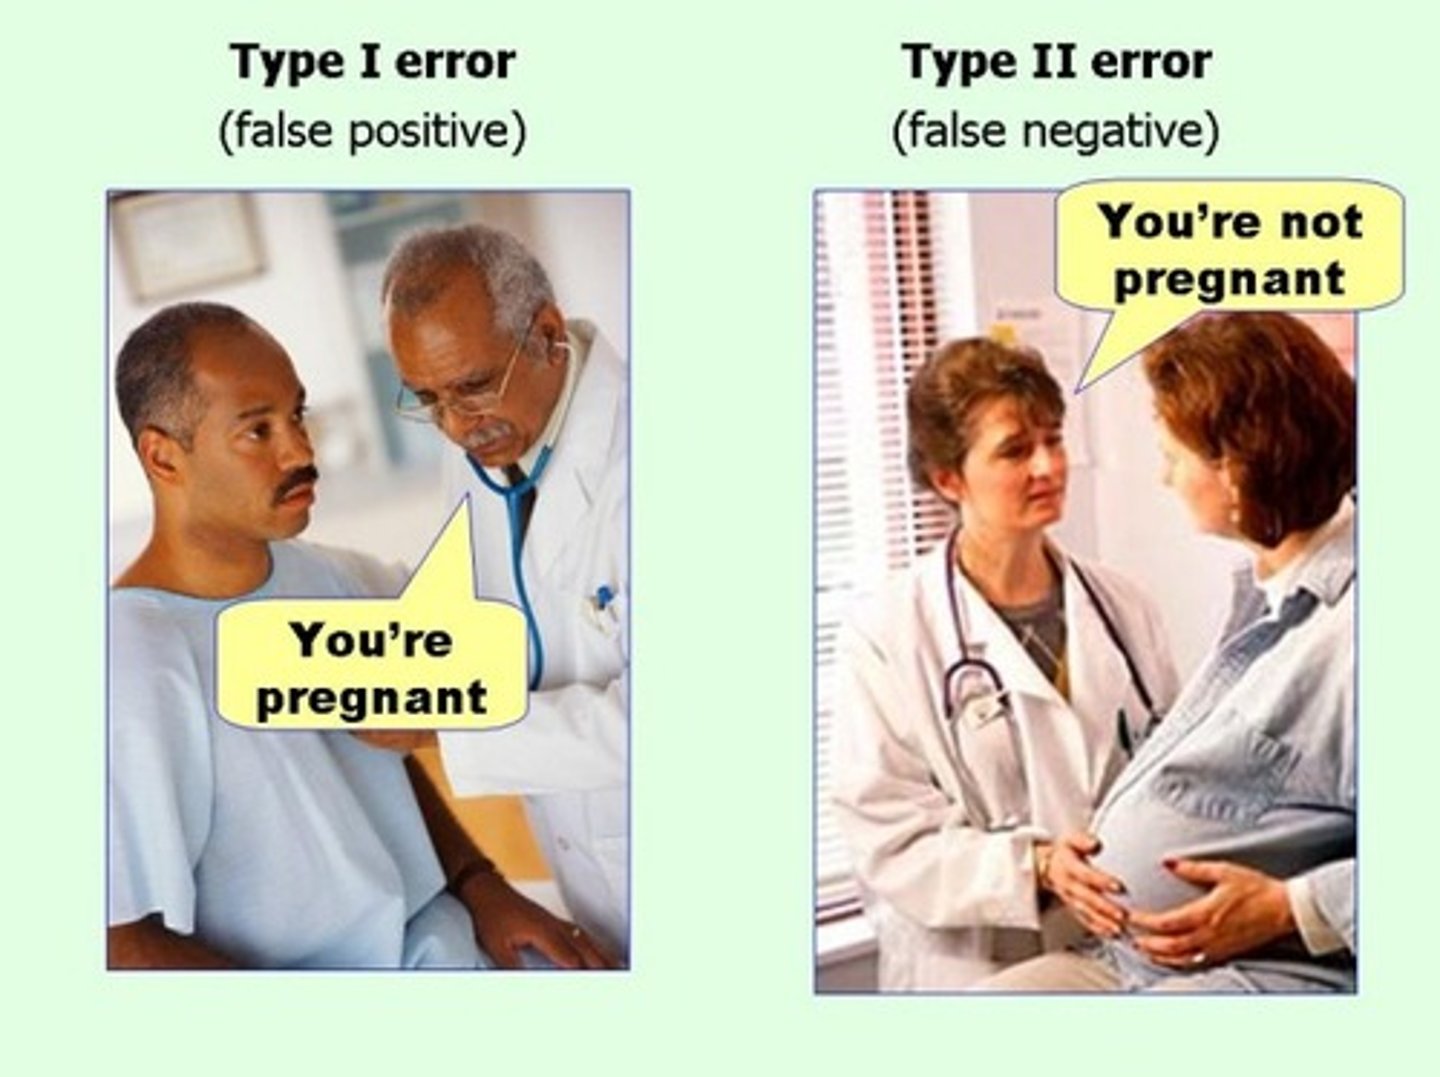
Type II Error
In research, the mistake of thinking that one variable does not have an effect on or relationship with another, when really it does.
A "false negative."
Failing to reject a false null hypothesis.
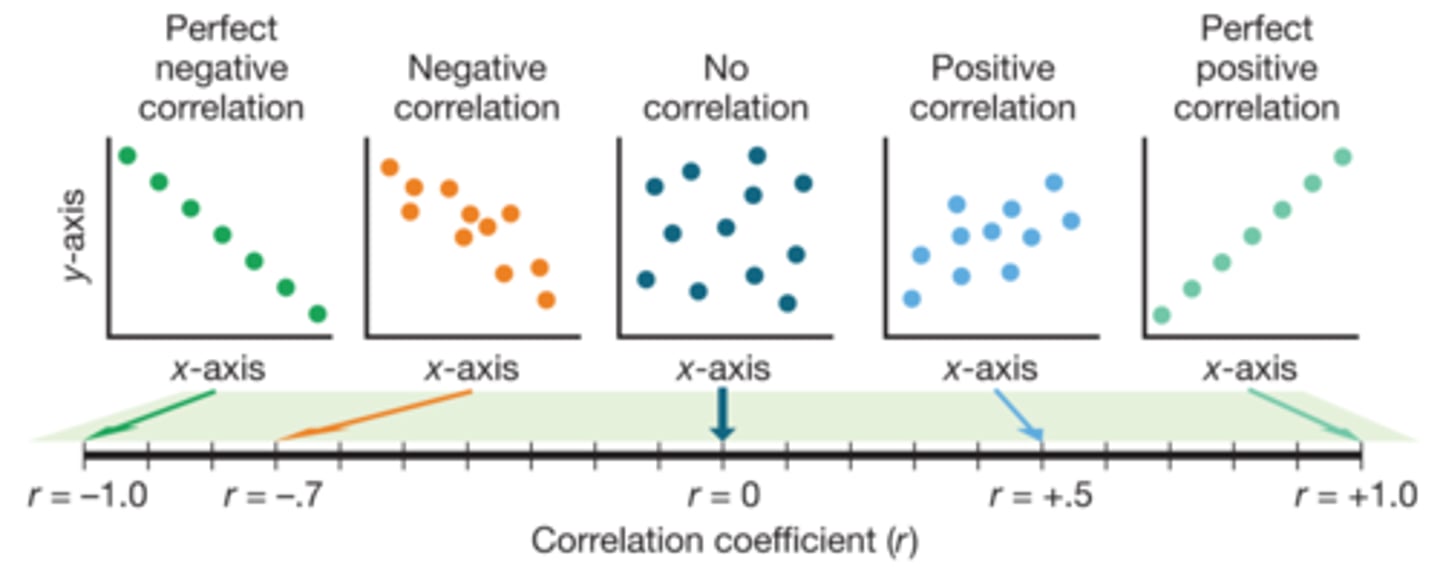
correlation coefficient
A number between -1 and +1 that reflects the degree to which one variable traditionally called y, is a linear function of another, traditionally called x.
A negative correlation means that as x goes up, y goes down; a positive correlation means that as x goes up, so does y; a zero correlation means that x and y are unrelated.
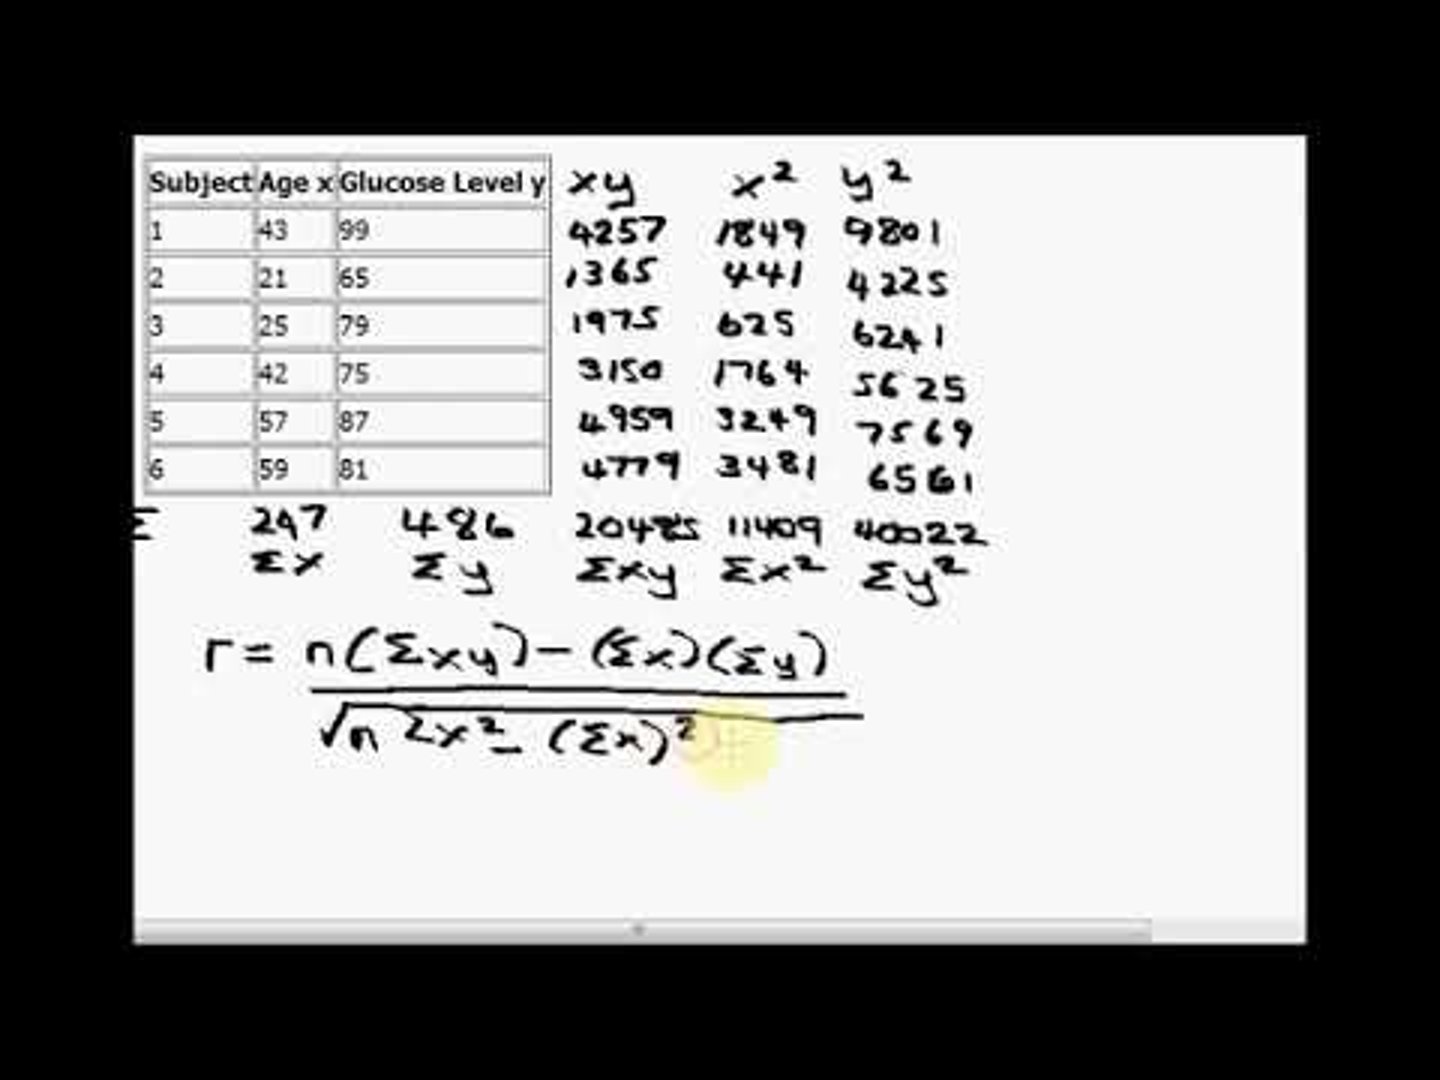
calculating correlation
Start with two variables, and arrange all of the scores on the two variables into two columns, with each row containing the scores for one participant. These columns are labeled x and y. Traditionally, the variable you think is the cause is put in the x column and the variable you think is the effect is put in the y column.
Then you apply a common statistical formula (found in any statistics textbook) to these numbers or, more commonly, you punch the numbers into a computer or maybe even a handheld calculator.
The result is a correlation coefficient (the most common is the Pearson r). This is a number that—if you did the calculations right—is somewhere between +1 and -1 (Figure 3.5).
If two variables are unrelated, the correlation between them will be near zero. If the variables are positively associated—as one goes up, the other tends to go up too, like height and weight—then the correlation coefficient will be greater than zero (i.e., a positive number). If the variables are negatively associated—as one goes up, the other tends to go down, like "anxiety"
scatterplot
A diagram that shows the relationship b/w two variables by displaying points on a two-dimensional plot.
Usually the two variables are denoted x and y, each point represents a pair of scores and the x variable is plotted on the horizontal axis while y variable is plotted on the vertical axis.
It is most often used to plot correlations.
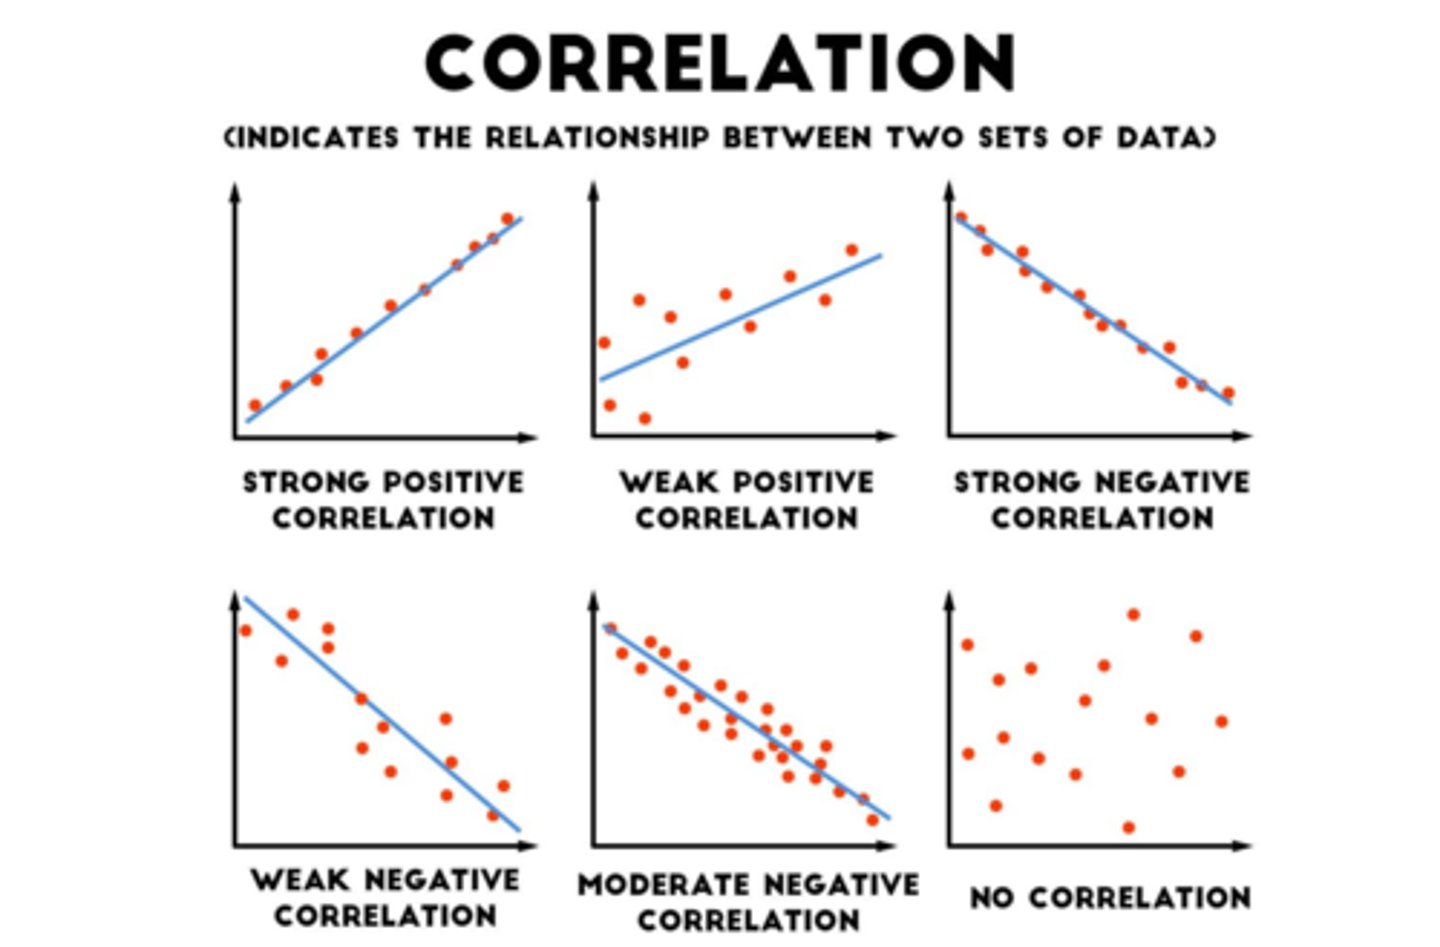
How do we read a scatterplot
You interpret a scatterplot by looking for trends in the data as you go from left to right:
If the data show an uphill pattern as you move from left to right, this indicates a positive relationship between X and Y. As the X-values increase (move right), the Y-values tend to increase (move up).

What is the typical arguments used to justify deception in psychological research?
- Participants have given informed consent and can withdraw their data if they are upset.
- The deception typically does not harm participants.
- Some topics can only be studied using deception.
effect size
A number that reflects the degree to which one variable affects, or is related to, another variable.
replication
Doing a study again to see if the results hold up.
Replications are especially persuasive when done by different researchers in different labs than the original study.
Questionable Research Practices (QRP's)
Research practices that, while not exactly deceptive, can increase the chances of obtaining the result the researcher desires.
Such practices including deleting unusual responses, adjusting results to remove the influence of seemingly extraneous factors, and neglecting to report variables or experimental conditions that fail to yield expected results.
Such practices are not always wrong, but they should always be questioned.
Also known as p hacking
p level
In statistical data analysis, the probability that the obtained correlation or difference between experimental conditions would be expected by chance. (p. 86)
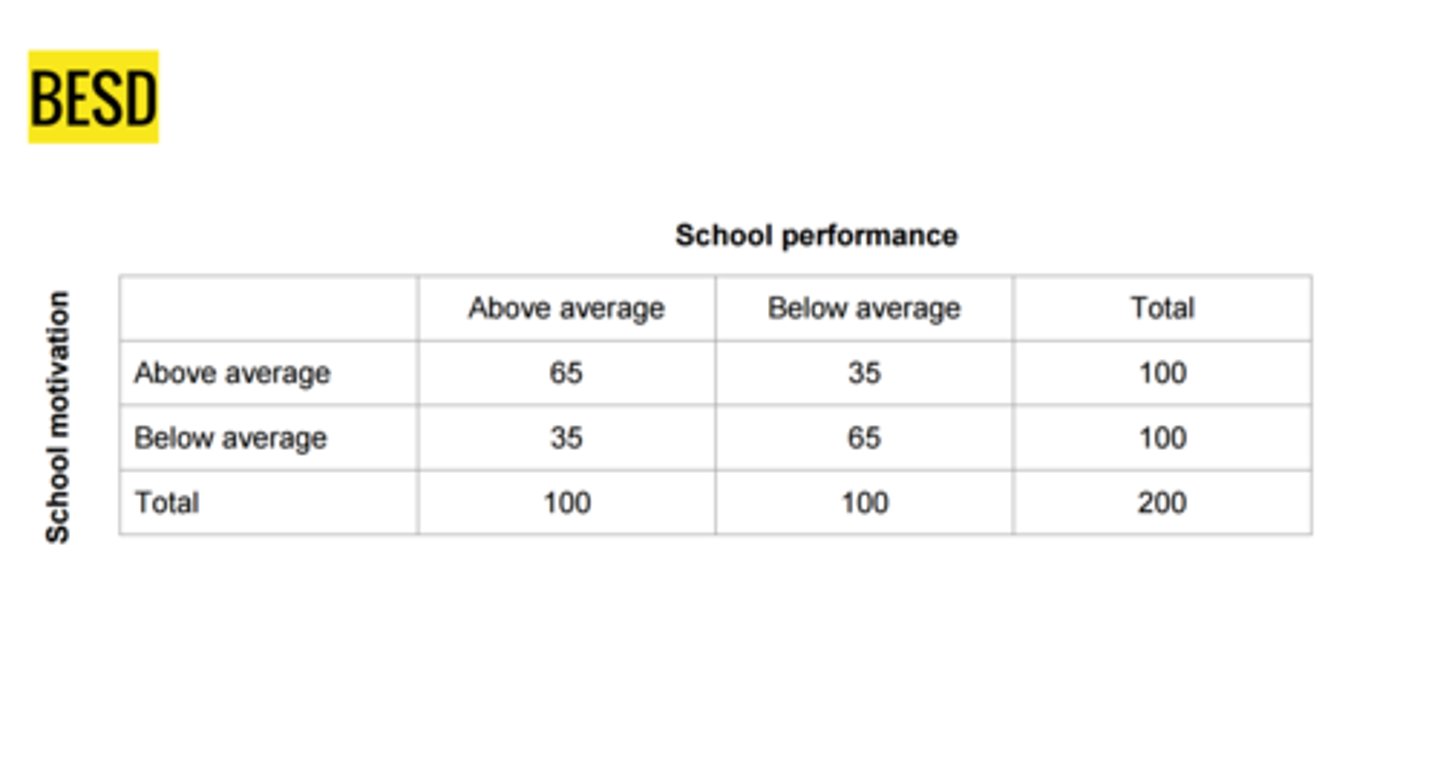
Binomial Effect Size Display (BESD)
A method for displaying and understanding more clearly the magnitude of an effect reported as a correlation, by translating the value of r into a 2x2 table comparing predicted with obtained results.
publication bias
The tendency of scientific journals preferentially to publish studies with strong results.
p-hacking
Analyzing data in various ways until one finds the desired result.
This is done in order to obtain a p value of just under .05, which can lead to nonreplicable results.
open science
A set of emerging principles intended to improve the transparency of scientific research and that encourage fully reporting all methods and variables used in a study, reporting studies that failed as well as succeeded, and sharing data among scientists.