Psyc stats final
0.0(0)
Card Sorting
1/132
There's no tags or description
Looks like no tags are added yet.
Last updated 12:01 PM on 4/20/23
Name | Mastery | Learn | Test | Matching | Spaced | Call with Kai |
|---|
No analytics yet
Send a link to your students to track their progress
133 Terms
1
New cards
Systematic observational research
* The viewing and recording of a predetermined set of behaviours
* Does not incorporate interventions
* Does not incorporate interventions
2
New cards
External validity
The extend to which study findings can be generalized outside the data collection setting to other persons, in other places, at other times
3
New cards
Ecological validity
* Degree to which the research situation re-creates the psychological experiences that participants would have in real life
* Laboratory vs. classroom setting
* Laboratory vs. classroom setting
4
New cards
Coding system
Set of rules to help guide how the researcher classifies and records the behaviours under observation
5
New cards
Duration recording
Recording the elapsed time during which a particular behaviour occurs
6
New cards
Frequency-count Recording
* Recording each time a target behaviour occurs
* Usefulness? Short-lived target behaviour
* Behaviour duration: Not a research focus
* Usefulness? Short-lived target behaviour
* Behaviour duration: Not a research focus
7
New cards
Observation schedule
* A hard-copy document, or electronic form, on which observers note the particulars of the behaviour or phenomenon they are observing
* Observing specified types of behaviour
* Anticipating different possible outcome
* Observing specified types of behaviour
* Anticipating different possible outcome
8
New cards
Inter-observer reliability
* The level of agreement between two observers coding the same phenomenon, also known as inter-rater reliability
* 2 different therapists evaluating 1 patient/client
* 2 different therapists evaluating 1 patient/client
9
New cards
Intra-observer reliability
* The extend to which a SINGLE observer consistently codes a phenomenon
* One therapist evaluating 1 patient/client 2 or more times
* One therapist evaluating 1 patient/client 2 or more times
10
New cards
Reliability goal
Acceptable agreement
11
New cards
Pilot testing
* A trial run used to test and refine the design, methods, and instruments of a study prior to carrying out the actual research
* Opportunity to make adjustments (data collection, methods, design)
* Opportunity to make adjustments (data collection, methods, design)
12
New cards
Continuous Recording
* A procedural method for recording observations that involves recording all the behaviour of a target individual during a specified observation period
13
New cards
Interval Recording
* Procedural method
* Observation time: Equal-sized, smaller time periods
* Identifying when a target behaviour has occurred
* Observation time: Equal-sized, smaller time periods
* Identifying when a target behaviour has occurred
14
New cards
Contrived observation
* Artificially introducing a variable of interest and unobtrusively observing the outcome
* Intervention (drugs, therapy)
* Intervention (drugs, therapy)
15
New cards
Descriptive statistics
* Statistics that describe or summarize quantitative information
* Central tendency
* Mean, median, mode
* Central tendency
* Mean, median, mode
16
New cards
Categorical variable
* A way to classify data into distinct grouping
17
New cards
Continuous variable
* A variable with an infinite number of different values between two given point
18
New cards
Frequency distribution
* Graphical depiction of how scores distribute across a range of values
* Calculating “… one number that summarizes everyone’s score”
* Indication of the “location” of one person’s score relative to the sample (or population)
* Calculating “… one number that summarizes everyone’s score”
* Indication of the “location” of one person’s score relative to the sample (or population)
19
New cards
Measure of central tendency
* “… is a score that summarizes the location of a distribution on a variable”
* Eliminates the need to examine every single score
* Mode
* Median
* Mean
* Eliminates the need to examine every single score
* Mode
* Median
* Mean
20
New cards
Types of frequency distributions
* Normal distribution
* Kurtosis
* Skewed distributions
* Kurtosis
* Skewed distributions
21
New cards
Normal Distribution
* Represents the ideal distribution of scores in a population
* Symmetrical
* Basis of statistical testing
* Symmetrical
* Basis of statistical testing
22
New cards
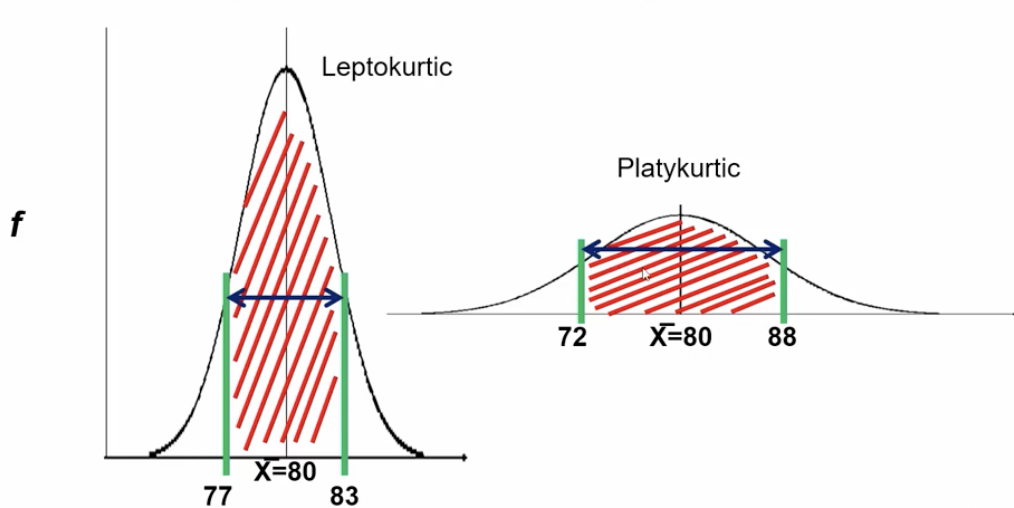
Kurtosis
* Still symmetrical, refers to the distribution of scores relative to the middle
* Leptrokurtic
* Mesokurtic
* Platykurtic
* Leptrokurtic
* Mesokurtic
* Platykurtic
23
New cards
Leptokurtic
* Positive value
* Scores closer to mean
* Scores closer to mean
24
New cards
Mesokurtic
* Normal distribution
* Value = 0
* Value = 0
25
New cards
Platykurtic
* Negative value
* Scores further from mean
* Scores further from mean
26
New cards
Negatively skewed
* Only one pronounced tail
* Measure the degree of asymmetry
* Relatively low number of extreme LOW scores
* EX: Running speed, 800m olympic games
* Majority of runners having similar speeds
* Measure the degree of asymmetry
* Relatively low number of extreme LOW scores
* EX: Running speed, 800m olympic games
* Majority of runners having similar speeds
27
New cards
Positively skewed
* Only one pronounced tail
* Measure the degree of asymmetry
* Relatively low number of extreme HIGH scores
* EX: Household income
* Measure the degree of asymmetry
* Relatively low number of extreme HIGH scores
* EX: Household income
28
New cards
The mode
* Used in: Nominal/ordinal scales of measurement
* Mode limitations
* If more than 2 modes, difficult to describe the data
* Rectangular-type distributions: Many mods
* Skewed distributions
* Most frequently occurring score in a distribution
* “Highest” point in a frequency distribution
* Mode limitations
* If more than 2 modes, difficult to describe the data
* Rectangular-type distributions: Many mods
* Skewed distributions
* Most frequently occurring score in a distribution
* “Highest” point in a frequency distribution
29
New cards
Bimodal
A graph with two humps
30
New cards
The median
* the score of the 50th percentile (50% of the scores at or below the median)
* Advantages
* Can only have one median (compared to the mode)
* Median will usually be around where most of the scores are distributed
* Not affected by extreme “outliers”
* Uses: Nominal and ordinal scores, and skewed distributions
* Advantages
* Can only have one median (compared to the mode)
* Median will usually be around where most of the scores are distributed
* Not affected by extreme “outliers”
* Uses: Nominal and ordinal scores, and skewed distributions
31
New cards
Calculating the median
* Small N, discrete data (i.e., non-continuous data)
* Odd number of scores (arranged in rank order)
* Median is middle score
* Even number of scores (arranged in rank order)
* Median is the halfway point between the 2 middle scores
* Odd number of scores (arranged in rank order)
* Median is middle score
* Even number of scores (arranged in rank order)
* Median is the halfway point between the 2 middle scores
32
New cards
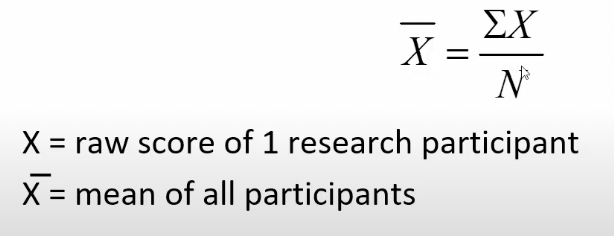
The mean
* Most commonly used measure of central tendency
* Refers to score located at the mathematical centre of the distribution
* Average
* Considers all scores in a distribution
* Refers to score located at the mathematical centre of the distribution
* Average
* Considers all scores in a distribution
33
New cards
Measures of variability
* Describes the extend to which scores in a distribution differs from each other
* 3 aspects
* 1) Indication of consistency in the scores
* Greater the variability, lower the consistency
* 2) Describes accuracy of the central tendency measures
* Greater the variability, the less accurate the mean describes the distribution
* 3) Measures the “spread” of outcome scores among a sample (or population
34
New cards
The range
* Distance between the 2 most extreme scores in the distribution
* Communicates the full “spread” of the data
* Range = Xmax - Xmin
* Most crude measure of variability
* Only measure of variability that is for nominal and ordinal data
* Communicates the full “spread” of the data
* Range = Xmax - Xmin
* Most crude measure of variability
* Only measure of variability that is for nominal and ordinal data
35
New cards
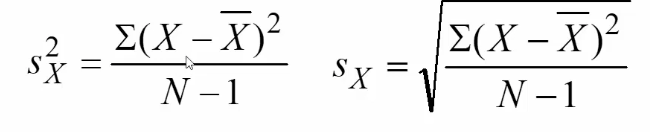
Variance and standard deviation
* Interval/ratio data
* Measures to describe differences between scores
* Based on the normal distribution (with respect to the mean)
* Deviation = X (single score) - X̄ _(average)
* Score deviation
* Refers to the “distance” between an individual score and a sample mean
* The magnitude of a score’s deviation is referred to as an ERROR
* Adding up all the deviation scores, it will = 0
36
New cards
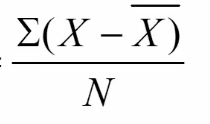
Average deviation
* Presents an overall “picture” of how a score deviates from the mean
* N = Total number of participants
* Problem
* Average deviation will always sum to ZERO
* Scores are balanced around the mean
* N = Total number of participants
* Problem
* Average deviation will always sum to ZERO
* Scores are balanced around the mean
37
New cards
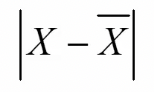
Absolute deviation
* Sire Arthur Eddington
* Astrophysicist and mathematician
* Each deviation score would be taken at the absolute value
* Astrophysicist and mathematician
* Each deviation score would be taken at the absolute value
38
New cards
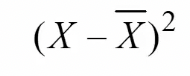
Squared deviation
* Sir Ronal Fisher
* Statistician and biologist
* Square the deviation, having the same effect as the absolute deviation, but without the negative sign, and the zero sum problem is solved
* Statistician and biologist
* Square the deviation, having the same effect as the absolute deviation, but without the negative sign, and the zero sum problem is solved
39
New cards
Absolute deviation vs squared deviation
* Squared deviation is better
* More “efficient” than absolute measure, produces a smaller error under IDEAL conditions
* Easier to manipulate algebraically
* Inferential statistics based on squared deviation
* More “efficient” than absolute measure, produces a smaller error under IDEAL conditions
* Easier to manipulate algebraically
* Inferential statistics based on squared deviation
40
New cards
Population variability
* To get unbiased estimate of population variability, use:
\
* N-1 = degrees of freedom
* For N=20 samples, only 19 of the samples are free to vary from the population mean
\
* N-1 = degrees of freedom
* For N=20 samples, only 19 of the samples are free to vary from the population mean
41
New cards
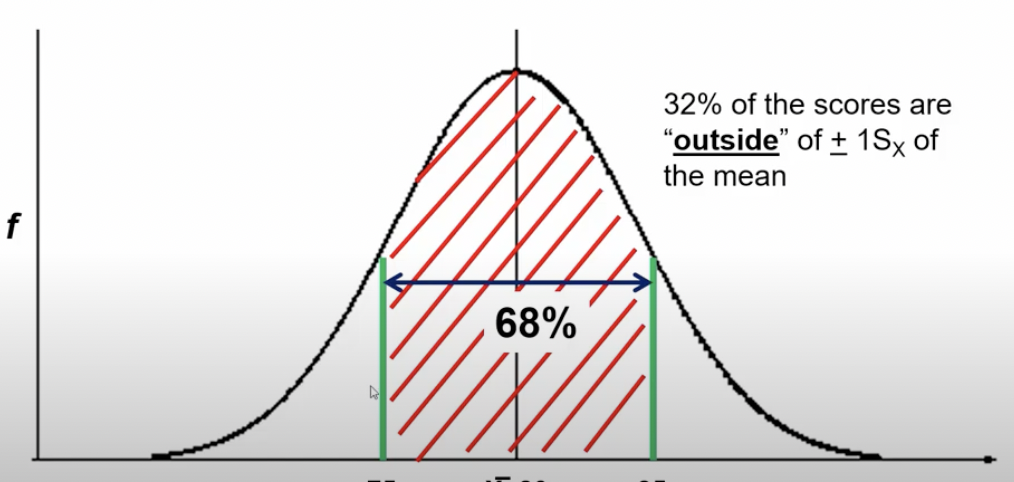
Normal distribution
* Standard deviation is based on this
* 68% of the scores in a distribution are within of a +- 15x of the mean
* Mean = 80 years, Sx = +- 5
* 32% of the scores “outside” of the +- 1Sx of the mean
* 68% of the scores in a distribution are within of a +- 15x of the mean
* Mean = 80 years, Sx = +- 5
* 32% of the scores “outside” of the +- 1Sx of the mean
42
New cards
Differently shaped distributions
* 68% of the scores in a distribution are within of +- 1Sx of the mean
* Same rules apply. 68% of the scores still +- 1Sx, just closer to the mean
* Same rules apply. 68% of the scores still +- 1Sx, just closer to the mean
43
New cards
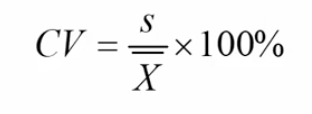
Coefficient of variation
* Used for interval or ratio data
* Advantages
* 1) “Unitless” - independent of the units of measurement
* Able to compare measures with different units
* 2) Variation is a proportion of the mean
* Measure of “relative” variation
* Advantages
* 1) “Unitless” - independent of the units of measurement
* Able to compare measures with different units
* 2) Variation is a proportion of the mean
* Measure of “relative” variation
44
New cards
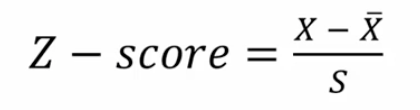
Z-score
* Any known score (X )can be expressed as a z-score by knowing the mean and standard deviation of the distribution
* X = single raw score (from 1 unit or person)
* X- = sample mean (Average)
* S = sample standard deviation
* Advantages
* Assess relative position of each unit in the sample
* Eliminates unit of measurement
* Compare between different dependent variables
* X = single raw score (from 1 unit or person)
* X- = sample mean (Average)
* S = sample standard deviation
* Advantages
* Assess relative position of each unit in the sample
* Eliminates unit of measurement
* Compare between different dependent variables
45
New cards
Correlation/regression steps
1) Correlation
2) Regression
* Examining relationships
* Not establishing cause & effect
2) Regression
* Examining relationships
* Not establishing cause & effect
46
New cards
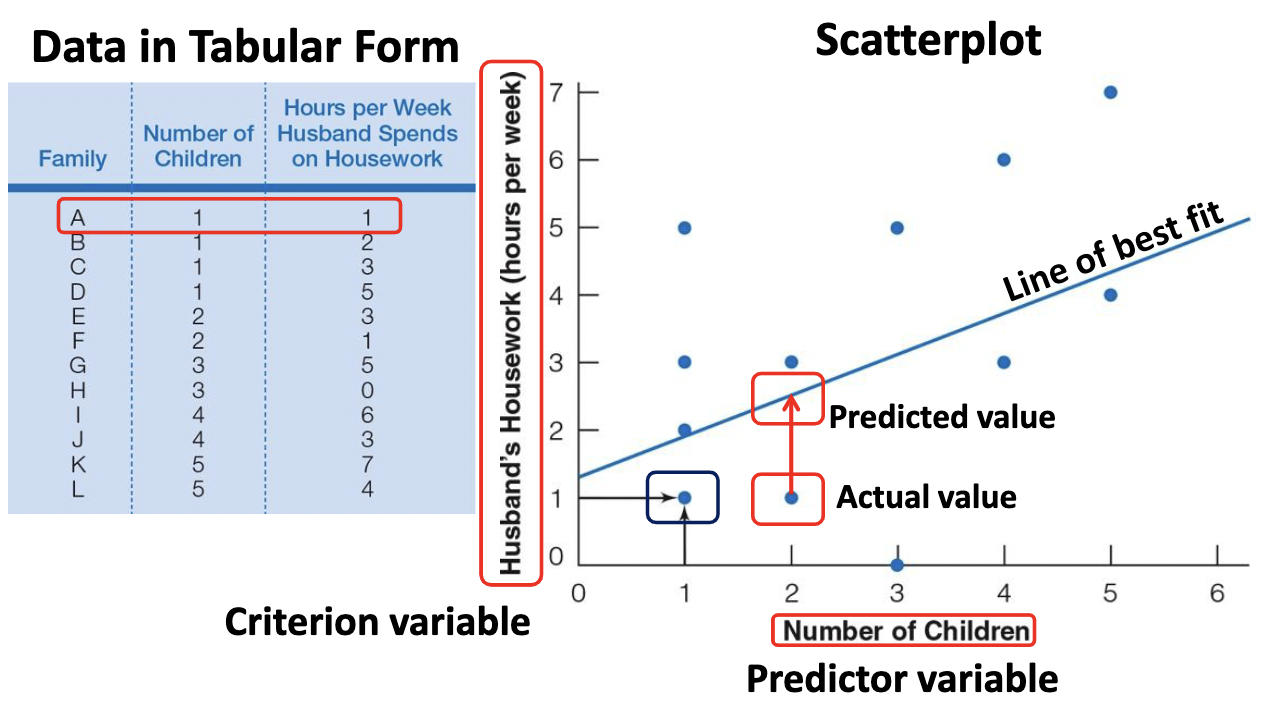
Correlational study key points
* Identify the dependent variable (variable we are trying to predict). Criterion variable
* Identify the independent variable (i.e., the x-axis variable) The Predictor variable
* Make scatterplot of the data
* Perform the “intra-ocular” test (i.e., “look” at the graph you made)
* Identify the independent variable (i.e., the x-axis variable) The Predictor variable
* Make scatterplot of the data
* Perform the “intra-ocular” test (i.e., “look” at the graph you made)
47
New cards
Criterion variable
* Dependent / response variable
* Variable we are trying to predict
* Response
* Variable we are trying to predict
* Response
48
New cards
Predictor variable
* Independent variable
* Independent variables are what we expect will influence dependent variables
* Independent variables are what we expect will influence dependent variables
49
New cards
Correlation analysis
* Describes: direction and strength of relationship between 2 variables
* Indicates:
* 1) Relative degree of consistency
* 2) The variability in Y scores paired with X scores
* Regression analysis
* 3) How closely the scatterplot fits the regression line (line of best fit)
* 4) The relative accuracy of a prediction
* Indicates:
* 1) Relative degree of consistency
* 2) The variability in Y scores paired with X scores
* Regression analysis
* 3) How closely the scatterplot fits the regression line (line of best fit)
* 4) The relative accuracy of a prediction
50
New cards
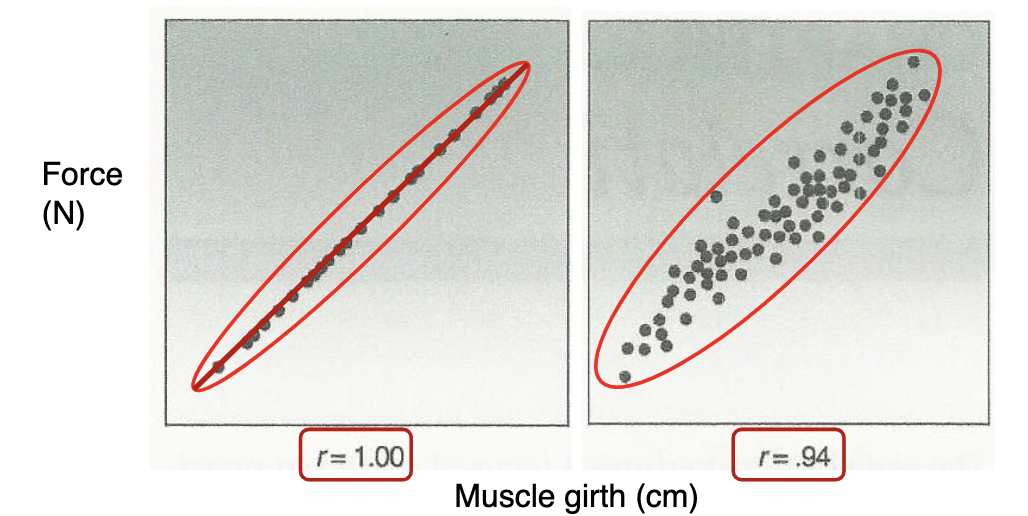
Positive relationship
* What does this graph tell us?
* Predicting Y (force), given X (muscle girth)
* People that have a larger muscle girth are likely to produce more force
* KEY: NOT cause and effect
* Predicting Y (force), given X (muscle girth)
* People that have a larger muscle girth are likely to produce more force
* KEY: NOT cause and effect
51
New cards
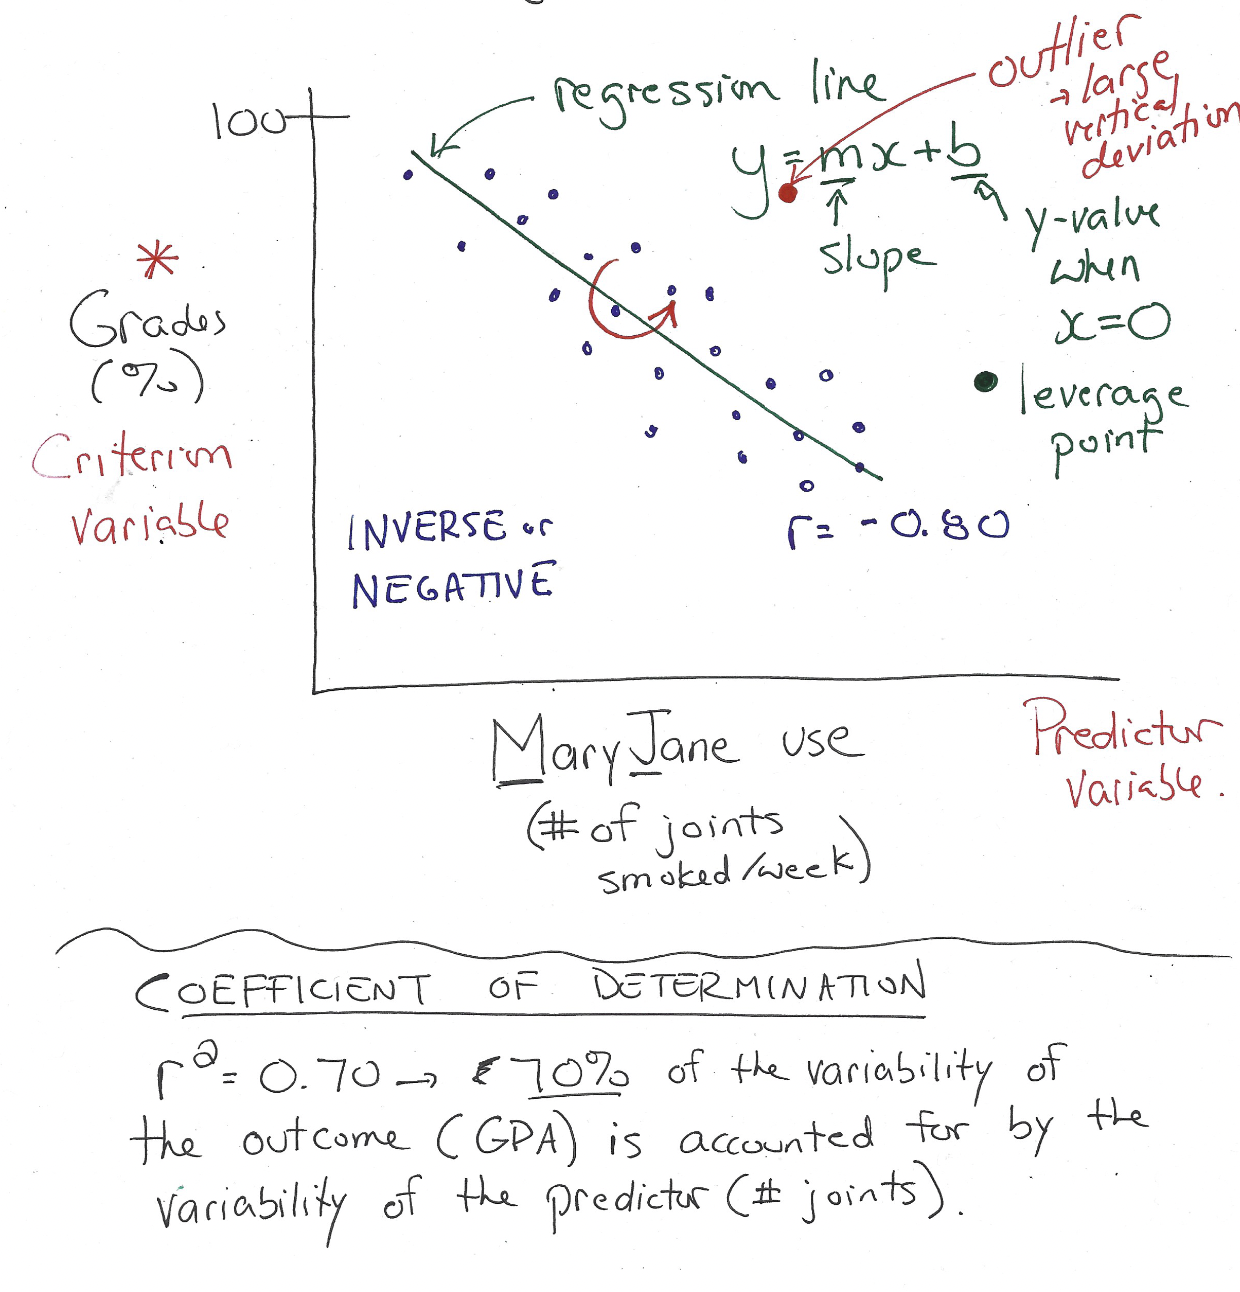
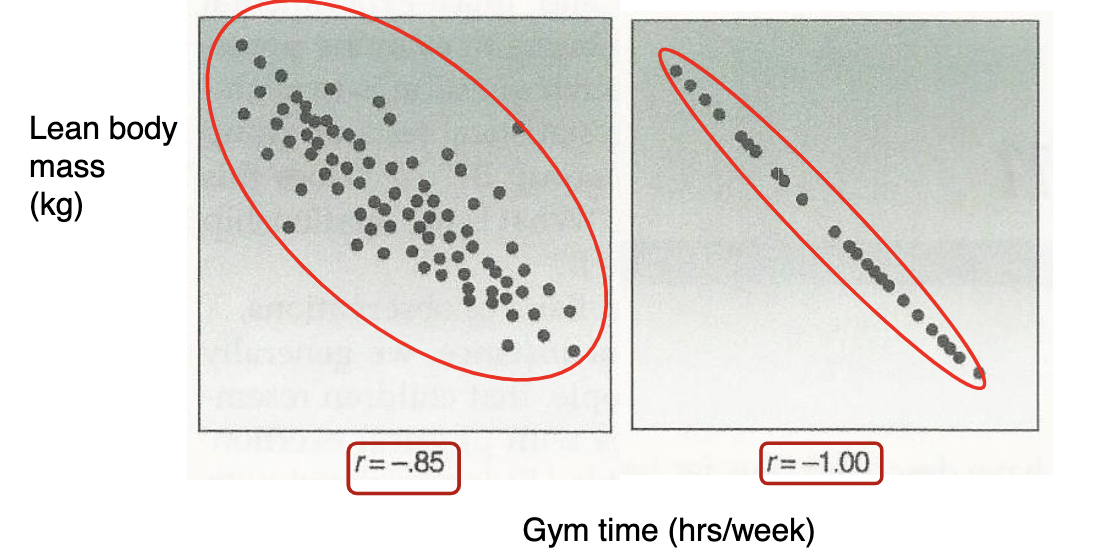
Negative relationship
* What does this graph tell us?
* People who spend more time in the gym (X) are likely to have less body mass (Y)
* KEY: It does NOT mean that spending more time in the gym will DECREASE a person’s body mass
* People who spend more time in the gym (X) are likely to have less body mass (Y)
* KEY: It does NOT mean that spending more time in the gym will DECREASE a person’s body mass
52
New cards
Correlation analysis
\
53
New cards
Pearson product moment correlation (PPMC)
* The “r” value
* Determines strength of linear relationship between 2 variables
* Greater r, the more “predictive” the relationship ranges from -1.0 to 1.0.
* The value indicates both the direction and strength of the relationship
* Negative or positive value for r.
* A high correlation does not \n prove causation
* Nor a low correlation \n eliminate causation.
* PPMC relies on the concept of co-variance
* How the X and Y scores vary together.
54
New cards
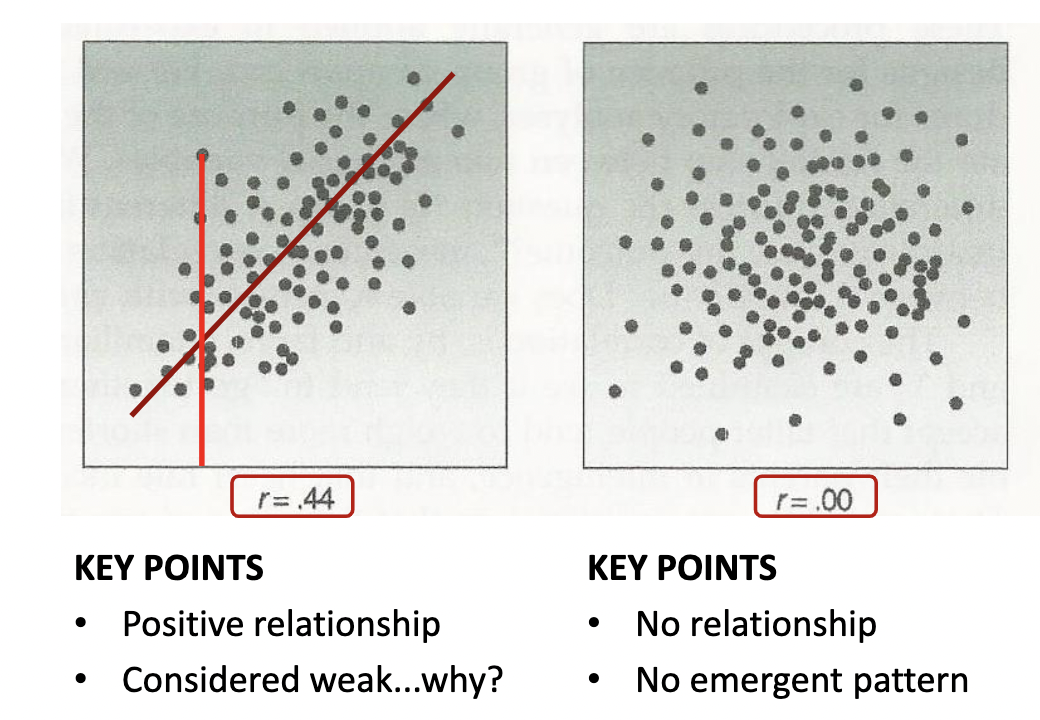
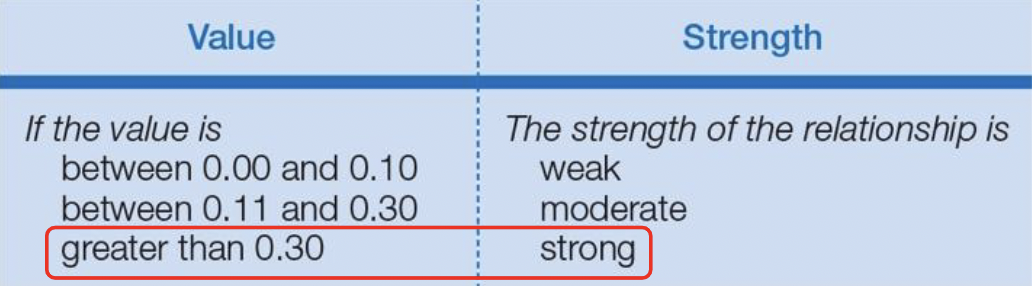
Correlation relationship strength
* 0.00 to 0.25 Little to no relationship
* 0.25 to 0.50 Fair relationship
* 0.50 to 0.75 Moderate to good relationship
* Above 0.75 Good to excellent relationship
\
* Depends on the field of study
* General guideline in research
* The ideal r-value?
* r2 > 0.49
* 0.25 to 0.50 Fair relationship
* 0.50 to 0.75 Moderate to good relationship
* Above 0.75 Good to excellent relationship
\
* Depends on the field of study
* General guideline in research
* The ideal r-value?
* r2 > 0.49
55
New cards
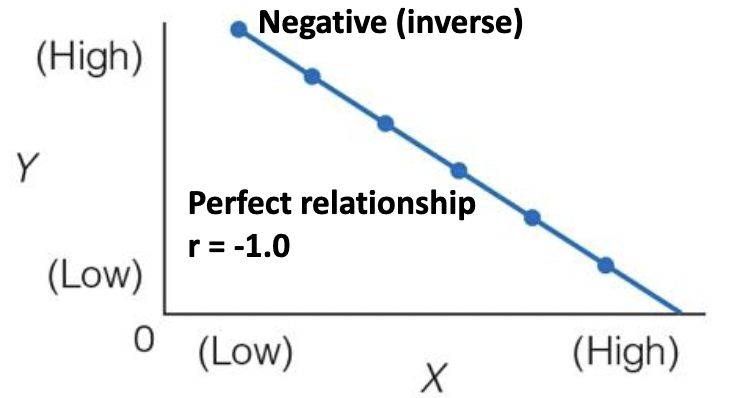
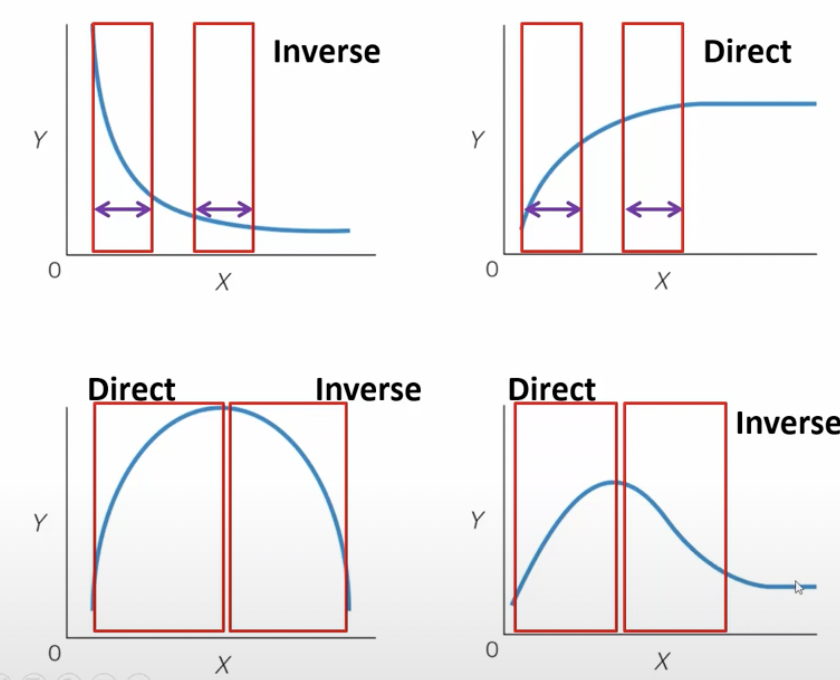
Non-linear relationships
* Situation where there is not a straight-line or direct relationship between an independent variable and a dependent variable
* Inverse
* Relationship where Y decreases while X increases
* Direct (positive)
* Y increases and X increases
\
* Steep slopes = more variability
* Inverse
* Relationship where Y decreases while X increases
* Direct (positive)
* Y increases and X increases
\
* Steep slopes = more variability
56
New cards
Non-liner relationships graph
* Linear function
* r = 0.18
* r = 0.18
57
New cards
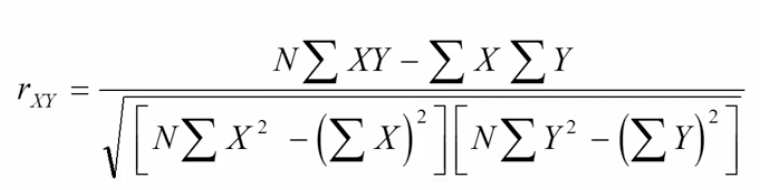
Pearson product moment correlation calculation
* X = predictor variable (independent variable)
* Y = criterion variable (dependent variable)
* N = total number of participants (or scores) XY pairs
* Y = criterion variable (dependent variable)
* N = total number of participants (or scores) XY pairs
58
New cards
Limitations of PPMC
1. Influence of data range
1. If range is low (i.e., low variability) hard to detect a relationship
2. Two groups with no relationship - together produce a strong correlation
1. Not cause and effect. coincidental occurrence of scores
3. Extreme data points can exert large effect
1. “Outliers” will reduce the strength of a correlation
4. Relationship could be present but not evident from PPMC since not linear relationship
1. PPMC assumes a linear relationship between 2 variables
59
New cards
Coefficient of determination
* Measures the proportion of variability in one variable that can be determined from the relationship with the other variable
* Based on magnitude of r(xy)
* (r(xy))2 is the coefficient of determination
* Represents explained or common variance
* Note:
* The raw scores will deviate vertically (i.e., on the scatterplot) from the regression line
* Based on magnitude of r(xy)
* (r(xy))2 is the coefficient of determination
* Represents explained or common variance
* Note:
* The raw scores will deviate vertically (i.e., on the scatterplot) from the regression line
60
New cards
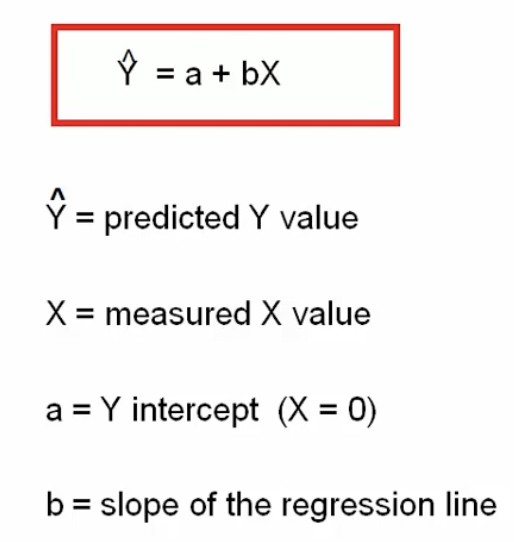
Linear regression
* Equation of a straight line
61
New cards
Linear regression slope
* Positive or negative
* r = PPMC value
* Sy = standard deviation of Y
* Sx = standard deviation of X (predictor)
* Y (bar) = mean of Y
* X (bar) = mean of X
* r = PPMC value
* Sy = standard deviation of Y
* Sx = standard deviation of X (predictor)
* Y (bar) = mean of Y
* X (bar) = mean of X
62
New cards
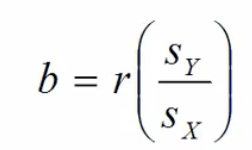
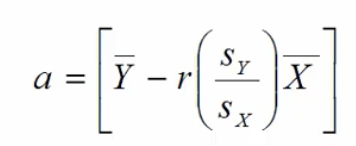
Linear regression Y-intercept
* Value of Y, when X = 0
* r = PPMC value
* Sy = standard deviation of Y
* Sx = standard deviation of X (predictor)
* Y (bar) = mean of Y
* X (bar) = mean of X
* r = PPMC value
* Sy = standard deviation of Y
* Sx = standard deviation of X (predictor)
* Y (bar) = mean of Y
* X (bar) = mean of X
63
New cards
Residual
Measures magnitude of the error of prediction
64
New cards
COVID-19
* Respiratory disease caused by a virus (SARS CoV-2)
* Severe Acute Respiratory Syndrome Coronavirus-2
* Severe Acute Respiratory Syndrome Coronavirus-2
65
New cards
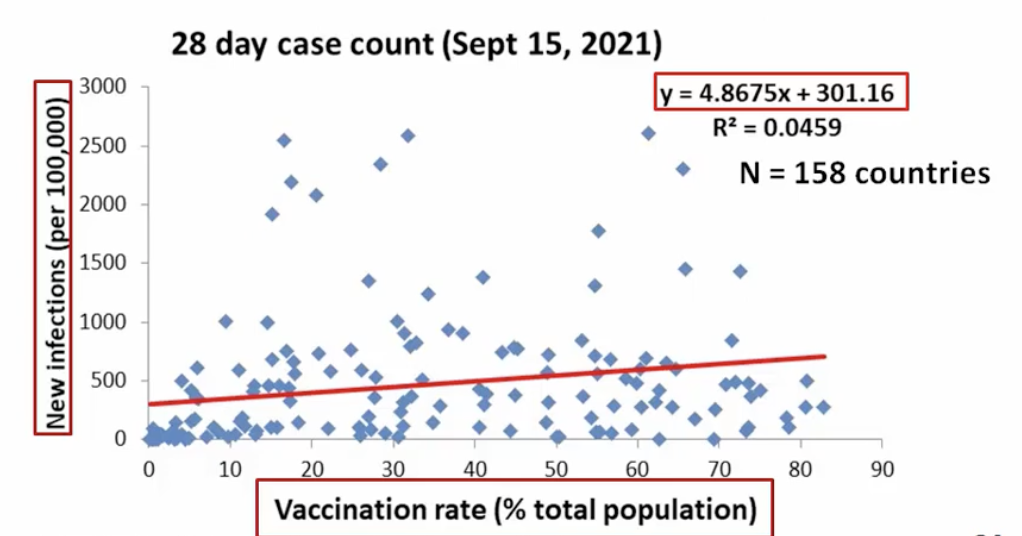
COVID Correlation (Does the vaccine work?)
1. Use the RCT (Randomized control trial)
1. Establishes “cause and effect” (required for drug approvals)
2. Gold standard in research designs
3. Study volunteers randomly assigned to drug vs placebo groups
4. Volunteers followed up for months
5. Outcome variable? Infection and illness
6. Efficacy (are they effective??)
2. Examine historical data
1. NOT “cause and effect”
2. Examines effects of previous outcomes
3. Can the past predict the future?
\
* Conclusion
* There is a statistically significant positive relationship between a country’s vaccination rate the 28-day new SARS CoV-2 infection rate. A greater infection rate is related to higher vaccination rates
66
New cards
Calculate “r” for this
* Square root (r2): r = 0.214
* Strength?
* Weak to moderate
* Direction?
* Positive, slope = 4.8675
* Units?
* New infections per vaccination rate
* Higher vaccination rate, greater case count?
* Is the relationship statistically significant?
* Strength?
* Weak to moderate
* Direction?
* Positive, slope = 4.8675
* Units?
* New infections per vaccination rate
* Higher vaccination rate, greater case count?
* Is the relationship statistically significant?
67
New cards
Hypothesis testing
* EX: Is there a statistically significant relationship between country vaccination rate (X) and the 28-day new case count (Y)
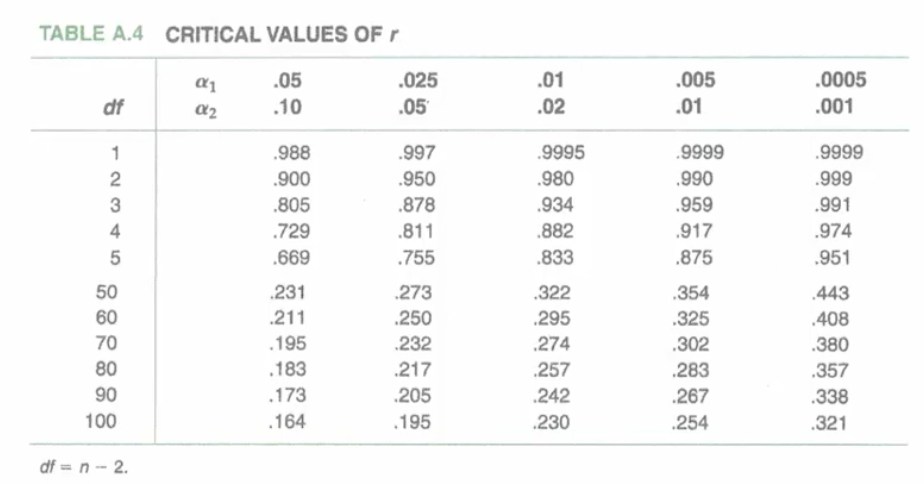
* Sample size: N = 158 countries, r = 0.214
* Statistical (null) hypothesis)
* H0: p = 0
* Alternate hypothesis:
* H1: p =/= 0
* Non-directional hypothesis
* Open to the possibility that the relationship could be positive or negative
* Sample size: N = 158 countries, r = 0.214
* Statistical (null) hypothesis)
* H0: p = 0
* Alternate hypothesis:
* H1: p =/= 0
* Non-directional hypothesis
* Open to the possibility that the relationship could be positive or negative
68
New cards
Significant correlations
* Typically choose 0.05 alpha
* If observed value is greater than or equal to critical value, it is statistically significant
* If observed value is greater than or equal to critical value, it is statistically significant
69
New cards
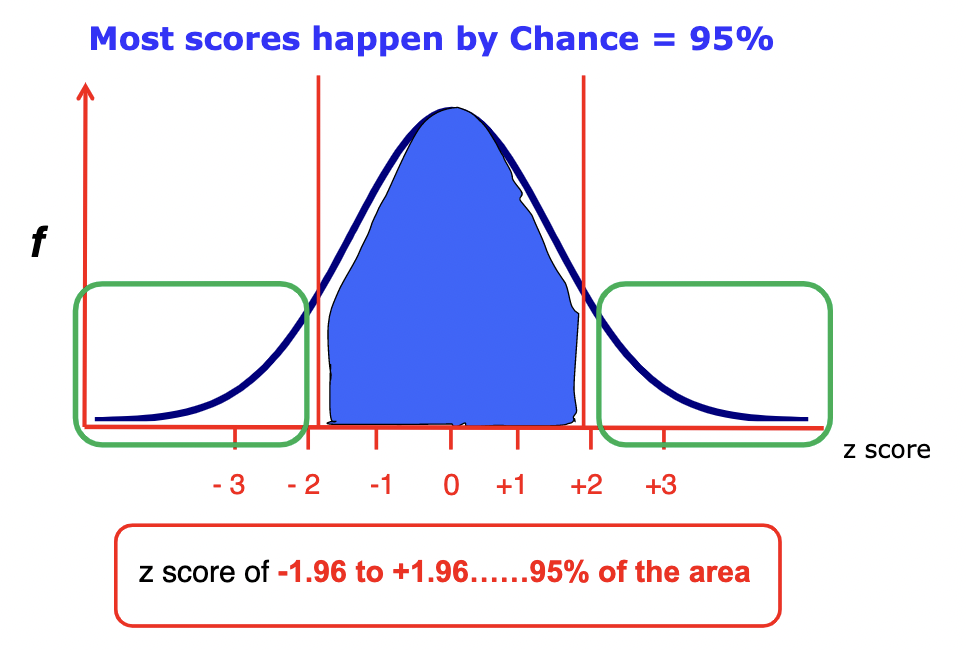
Probability
* “...is the likelihood that any one event will occur, given all the possible outcomes”
* “p” = probability (ratio or decimal)
* Ex. 1: flipping a coin
* 1 head, 1 tail: p=0.50
* Both outcomes are equally likely to occur
* Ex. 2: rolling 1 die
* 6 faces: probability of rolling a 2 is
* P=1/6 or 0.167
* “p” = probability (ratio or decimal)
* Ex. 1: flipping a coin
* 1 head, 1 tail: p=0.50
* Both outcomes are equally likely to occur
* Ex. 2: rolling 1 die
* 6 faces: probability of rolling a 2 is
* P=1/6 or 0.167
70
New cards
Distribution of scores
* Height of adults
* Mean = 69 inches (original units) = 0 (z-score units)
* Standard deviation = +- 3 inches
* 3 standard deviations from mean
* 0.13% of the population
* Mean = 69 inches (original units) = 0 (z-score units)
* Standard deviation = +- 3 inches
* 3 standard deviations from mean
* 0.13% of the population
71
New cards
Probability on graph
* Proportion of the total area under the curve for particular scores equals the probability of those scores.
72
New cards
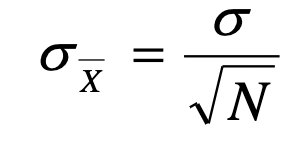
Sampling error
* Sampling distribution of means
* Measure many samples within 100 male university students in each sample
* Assumption: samples are randomly selected and valid representations of the population
* Sampling error: X (bar) - u
* The larger the error, the less accurate the sample represents the population. The sample must be “different”
* As n increases, variability from mean is reduced
* n = sample size
73
New cards
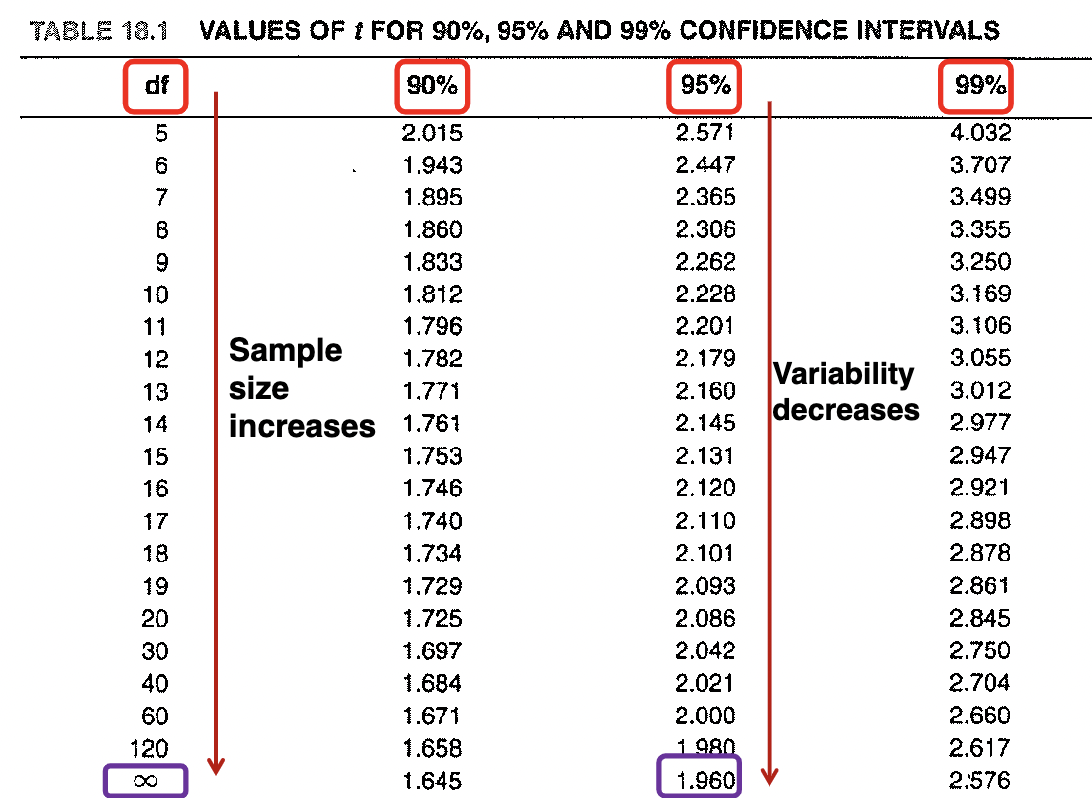
What if sample size is “small”?
* Usually performed with samples smaller than 30.
* Use the t-distribution, not z-distribution......why?
* Variability decreases with larger sample sizes.
* t-distribution curves more platykurtic.
* t-distribution depends on sample size
* Use the t-distribution, not z-distribution......why?
* Variability decreases with larger sample sizes.
* t-distribution curves more platykurtic.
* t-distribution depends on sample size
74
New cards
Confident intervals
75
New cards
Hypothesis
“A declarative statement that predicts the relationship between the independent and dependent variables, specifying the population that will be studied”
76
New cards
Two types of hypothesis testing
* Research hypothesis
* Null hypothesis
* Null hypothesis
77
New cards
Research hypothesis
* “...states the researcher’s true expectation of results guiding the interpretation of outcomes and conclusions”.
* Depends on the field of study
* Depends on the field of study
78
New cards
Null hypothesis (H0)
* Type of statistical hypothesis that proposes that no statistical significance exists in a set of given observations
* Referred to as the “statistical hypothesis”
* Does NOT depend on the field of study
* A test always predicts no effect or no relationship between variables
* EX: school principal claims that students in her school score an average of seven out of 10 in exams. The hypothesis is that the population mean is 7.0.
79
New cards
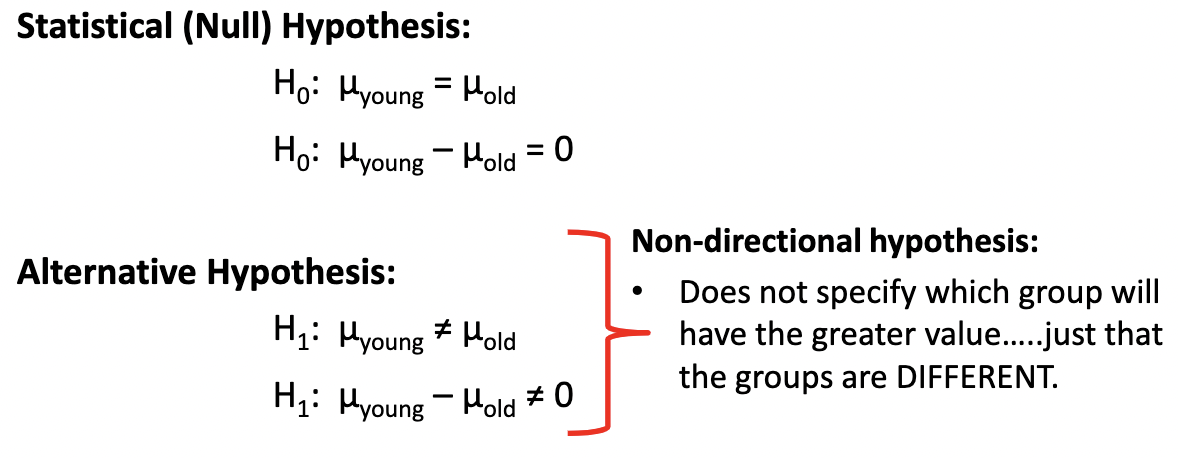
Alternate hypothesis (H1)
* Opposite of the null hypothesis
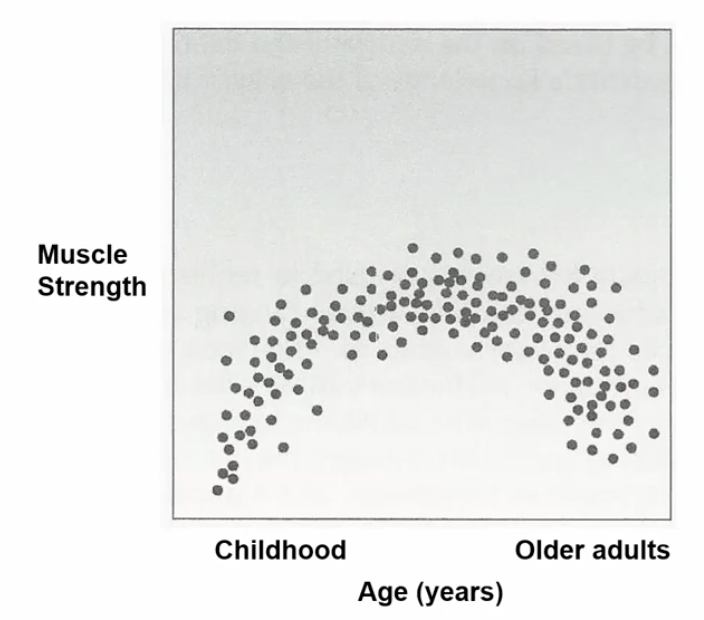
* EX: Comparing intelligence measures between young and older adults.
* 2 groups: Young adults (sample size = 20) vs older adults (sample size = 20)
* Both groups represent their respective populations (i.e., of young and older \n adults).
* EX: Comparing intelligence measures between young and older adults.
* 2 groups: Young adults (sample size = 20) vs older adults (sample size = 20)
* Both groups represent their respective populations (i.e., of young and older \n adults).
80
New cards
Comparing intelligence measures between young and older adults
* 2 groups:
* Young adults (sample size = 20) vs older adults (sample size = \n 20)
* Both groups represent their respective populations (i.e., of young \n and older adults).
* Research hypothesis
* Based on the physiology of aging, intelligence measurements, etc.
* Measures of intelligence will be DIFFERENT between young and older adults.
81
New cards
Directional hypotheses
Hypotheses indicating the expected direction of difference between means
82
New cards
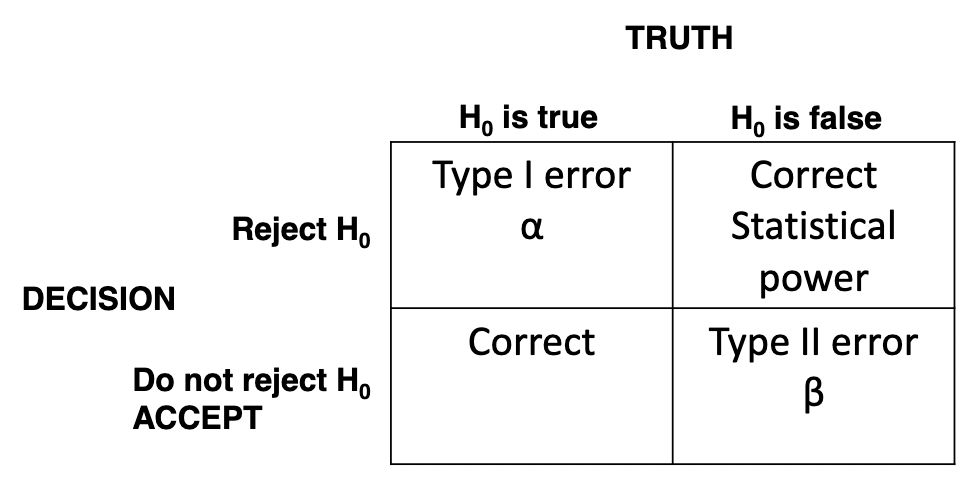
Errors in hypothesis testing
* Must accept OR reject the null hypothesis.
* If ACCEPT the null hypothesis......rejecting the alternative hypothesis.
* If REJECT the null hypothesis......accepting the alternative hypothesis.
* Based on the results of the statistical tests (i.e., calculations).
* If ACCEPT the null hypothesis......rejecting the alternative hypothesis.
* If REJECT the null hypothesis......accepting the alternative hypothesis.
* Based on the results of the statistical tests (i.e., calculations).
83
New cards
Type 1 error (α) (alpha)
* Referred to as the alpha level
* Establishing a level of “significance”
* Basic question: Are the observed differences between groups due to chance?
* EX: Comparing intelligence measures between young and older adults.
* 2 groups: Young adults (sample size = 20) vs older adults (sample size = 20)
* Decision: Accept or reject the null hypothesis......let’s reject the null hypothesis
* Therefore, accept the alternative
* Conclusion: Intelligence measures are DIFFERENT between young and older adults
* BUT, in reality, we don’t TRULY know if they’re different.......we could be making a mistake! How much risk should we be willing to accept? 10%? 5%? 1%?
* The risk depends on the real-life consequences of arriving at a wrong conclusion.
84
New cards
Example: A person on trial for capital murder (death penalty case...not in Canada, of course)
* Statistical (Null) Hypothesis:
* H0: Defendant is NOT guilty
* Alternative Hypothesis:
* H1: Defendant IS guilty.
\
* Type I error (α): 5%
* Consequences: Type I error.....REJECT the null hypothesis.....when it should be ACCEPTED.
* Defendant IS GUILTY!......BUT.....defendant is NOT guilty.
* H0: Defendant is NOT guilty
* Alternative Hypothesis:
* H1: Defendant IS guilty.
\
* Type I error (α): 5%
* Consequences: Type I error.....REJECT the null hypothesis.....when it should be ACCEPTED.
* Defendant IS GUILTY!......BUT.....defendant is NOT guilty.
85
New cards
Type 2 error (β) (beta)
* We accept the null hypothesis when it should be rejected.
* Example: Comparing intelligence measures between young and older adults
* Intelligence measures are not different between young and older adults.....when, in reality, they are different
* Example: Comparing intelligence measures between young and older adults
* Intelligence measures are not different between young and older adults.....when, in reality, they are different
86
New cards
Statistical power
* Is the probability that a test will lead to rejection of the null hypothesis”
* “Probability of attaining statistical significance”.
* Statistical power = 1 – β
* “Probability of attaining statistical significance”.
* Statistical power = 1 – β
87
New cards
Question: Was the new drug more effective at reducing blood cholesterol levels?
* Group 1:
* Change in blood cholesterol: Pre-test – Post-test = 10 mg/dL decrease
* Group 2:
* Change in blood cholesterol: Pre-test – Post-test = 15 mg/dL decrease
* Anything missing in this analysis?.......need to consider the variability among the patients in each group
* CONCLUSION: The new drug is NOT more effective than generic drug.....therefore,ACCEPT the null hypothesis
* Possibility of committing a Type II error......the drug is actually more effective
88
New cards
Factors affecting statistical power
1. α level chosen
1. Selecting 5% vs 1% risk of Type I error will increase statistical power
2. Using one-tailed vs two-tailed approach will increase statistical power
2. Sample size
1. Greater sample size: tighter distribution
1. decrease β, increase \n power.
2. Smaller sample size: wider distribution
1. increase β, decrease \n power.
3. Variability
1. Large σ: wider distribution of scores. Will decrease statistical power
2. Small σ: tighter distribution of scores. Will increase statistical power
4. Magnitude of differences between groups (μ1 – μo)
1. The greater the difference between means – the larger the power.
2. The magnitude is determined by treatment effect.
3. Referred to as the “effect size”
89
New cards
Statistical testing
Using established statistical “tests” (i.e., equations), to determine the acceptance or rejection of a null hypothesis
90
New cards
Statistical tests
* One sample z-test
* One sample t-test
* Two sample t-test
* ANOVA
* One sample t-test
* Two sample t-test
* ANOVA
91
New cards
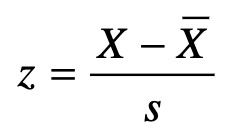
Z-score
* It is the difference between a raw score and the group (sample) mean divided by the standard deviation.
* Unitless
* Standard deviation “units”
* Unitless
* Standard deviation “units”
92
New cards
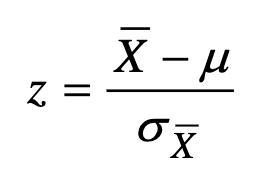
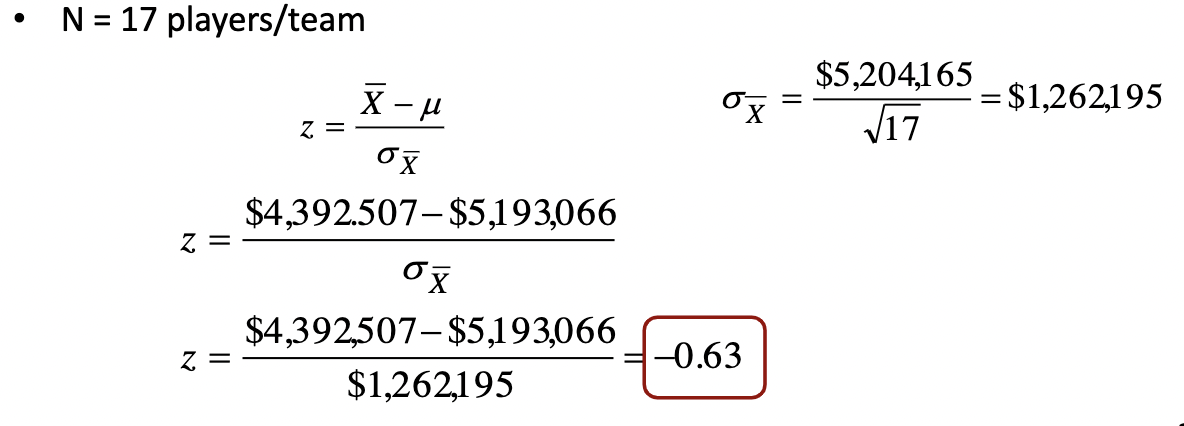
One-sample z-test
* Determining if a sample is representative of the population.
* Example: Is the average salary of Toronto Raptors players different from all NBA players?
* Information needed
* Toronto Raptors avg salary = $4,392,507.06/player
* NBA avg salary (population) = $5,193,066.00/player
* NBA salary standard deviation = $5,204,165.00/player
* N = 17 players/teamNull hypothesis:
* H0: μ = $5,193,066.00/player
* H1: μ ≠ $5,193,066.00/player
93
New cards
Hypothesis testing steps
1. State null hypothesis in symbols and words
2. State alternative hypothesis in symbols and words
3. Choose α level and one or two-tailed
4. State rejection and retain rule
5. Compute appropriate statistic
6. Make decision by applying rejection / retain rule
7. Write conclusion in context of study
94
New cards
Inferential statistics tree (relation/prediction)
Relation/prediction
* Correlation & regression analysis
* NOT cause & effect
* Correlation & regression analysis
* NOT cause & effect
95
New cards
Inferential statistics tree (cause)
Try to establish cause & effect
* Differences in an outcome (D.V.) as a function of groups and conditions
\
→ 1 group
* EX: University students
* One sample z-test or t-test
* Standard is pre-conceived value
\
→ 2 groups or 1 group measured twice
* EX: 1st year vs. 4th year students
* 2 sample t-test OR paired samples t-test
\
→ > 2 groups
* EX: 1st, 2nd, 3rd, and 4th students
* Multiple times calculated t-tests
* But, problems
* ANOVA
* S = √s2
\
\
\
* All of these 3 are parametric
* If NOT, then use non-parametric
96
New cards
Inferential statistics (1 group)
* EX: University students
* One sample z-test or t-test (one population)
* Standard is pre-conceived value
* One sample z-test or t-test (one population)
* Standard is pre-conceived value
97
New cards
Inferential statistics (2 groups or 1 group measured twice)
\
* EX: 1st year vs. 4th year students
* 2 sample t-test (2 populations) OR paired samples t-test
* EX: 1st year vs. 4th year students
* 2 sample t-test (2 populations) OR paired samples t-test
98
New cards
Inferential statistics (>2 groups)
* EX: 1st, 2nd, 3rd, and 4th student
* Multiple times calculated t-tests
* But, problems
* ANOVA
* S = √s2
* Multiple times calculated t-tests
* But, problems
* ANOVA
* S = √s2
99
New cards
Statistical procedures, and when should be used?
* Nominal (categorical)
* Ordinal (ranked)
* Ordinal (ranked)
100
New cards
Common parametric procedure assumptions
* Interval or ratio data
* N (0,1)
* Homogeneity of variance
\
* Parametric procedures can tolerate some violations. ROBUST
* N (0,1)
* Homogeneity of variance
\
* Parametric procedures can tolerate some violations. ROBUST