Psychological Statistics Exam 4
1/24
There's no tags or description
Looks like no tags are added yet.
Name | Mastery | Learn | Test | Matching | Spaced |
|---|
No study sessions yet.
25 Terms
Multivariate Analysis Consists of…
-Two or more dependent variables
-No categories
General Purpose of Multivariate Analysis
-To test for relationships between two or more values
-When this number increases, what does that number do?
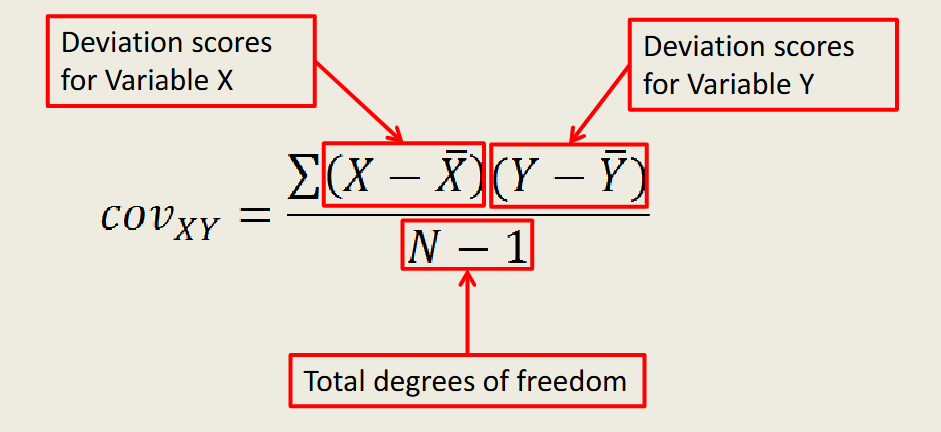
Covariance
The amount of variance shared between two variables
-Each deviation score on Variable X is paired with and multiplied by a deviation score on Variable Y from the same participant
-Positive scores on X & negative scores on Y (or vice versa) will yield a negative number
-Positive or negative scores on both X and Y will yield a positive number
Two different types of Multivariate Test:
1) Correlation
2) Regression
Correlation
comparison of two values to each other
-As values on one variable increase, what do values on the other variable do?
Regression
-comparison between 1 (or more) predictor and 1 outcome variables
-Results framed in terms of cause and effect
-The predictor(s) causes the outcome
-Stronger test than correlation, which tells us nothing about cause
positively correlated
-when a correlation has a positive sign
-the two variables have a positive relationship. Scores on two variables that are_____,trend together in the same direction.
ex: Shoe size and height are likely to be positively correlated because taller than average people are likely to wear larger than average shoes and vice versa
negatively correlated
-when a coefficient has a negative sign
-negative/inverse relationship. Scores on two variables that are ____, trend in opposite directions from each other
ex: stress and happiness
uncorrelated
-a correlation of zero indicates a relationship that is neither positively nor negatively correlated
-there is no predictable relationship between scores on one variable and scores on the other
-social scientists will often refer to variables as ____ if the coefficient is very close to zero without being precisely zero
Relationship of DVs can be described in two factors:
1) Strength
2) Direction
Strength
the amount of variance shared by a given pair of variables
Correlation Coefficient
-Relationship described by one value
-Absolute values range from 0.00 to 1.00
-Measures the amount of variance shared by two variables
-0.00=no relationship
-1.00=perfectly related
Third Variable Problem
an unseen variable influences both the independent and dependent variables in a study. This can lead to a false correlation between the observed variables. For example, an apparent link between ice cream sales and drowning incidents could be attributed to a third variable, such as the warmer weather, which causes both to increase.
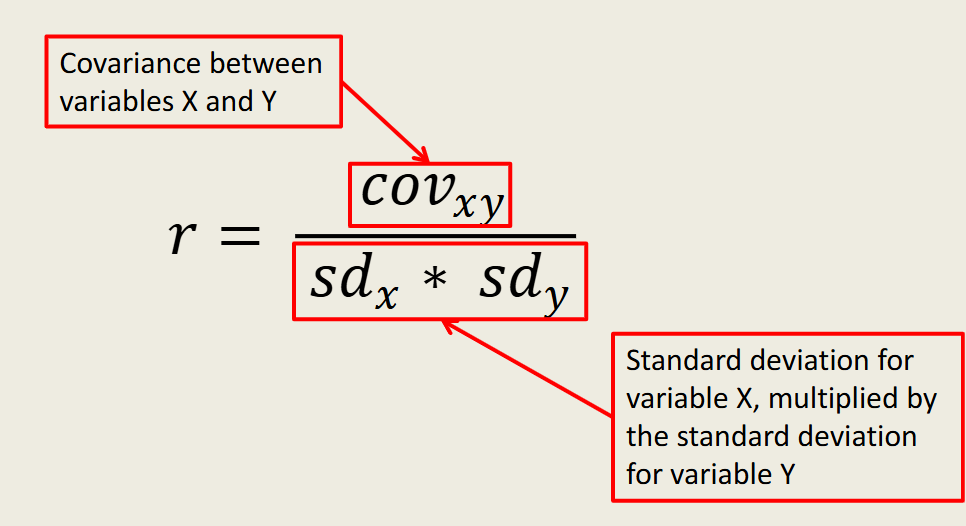
Pearson’s r
-test statistic for covariance
-the value you get for covariance is going to be affected by the size of the related standard deviations and the original scale values
-not easily interpreted as an absolute value, so we standardize it into r
-divide covariance by the deviations to control for standard deviation size
Heterogeneous Samples
are samples that consist of individuals with varied characteristics, which can lead to a broader representation of the population and varied results in statistical analyses.
Scatterplots
-special kind of graph that is used to display the relationship between two continuous variables
-each participant or case shows up as a dot in the graph
-displays scores on 2 variables simultaneously: 1 on the X axis and 1 on the Y axis
-the dot is located at the intersection between the score on the X axis and the score on the Y axis
Positive Correlation on a Scatterplot
coefficients trend upward as you move from left to right on the x axis
Negative Correlation on a Scatterplot
coefficients trend downward as you move from left to right on the X axis
Uncorrelated on a Scatterplot
coefficients neither trend upward nor downward
regression line
a mathematically derived straight line in a scatterplot that represents the idealized linear relationship between the two variables
B
-test statistic used for regression
-raw regression weight
-the amount of outcome variability accounted for by a predictor variable
-values vary as a function of the scale used
β (beta)
-test statistic for regression
-standardized regression weight
-Unlike B, does not vary as a function of the scale (like a z-score or correlation coefficient)
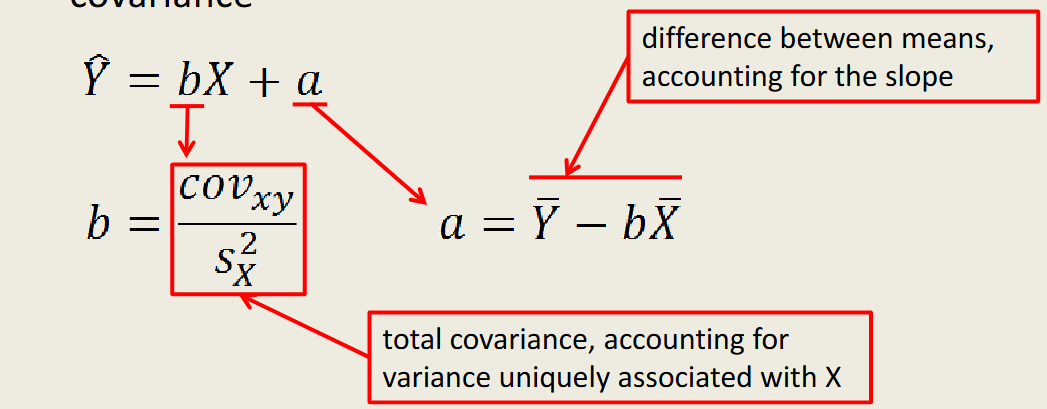
Unlike Correlation, Regression accounts for specific rate of change
-the bigger the slope, the higher the rate of change
-the higher the rate of change, the better a predictor that variable is for outcome variable
-one variable may be a stronger predictor
rho (ρ)
population correlation is abbreviated with___
Correlation Matrix
contains all the correlations among your chosen study variables. It is typically triangle-shaped, with each variable listed down the left side and also across the columns at the top. This arrangement allows room for each possible correlation between any two variables you have included. We identify a correlation by finding the table cell where the two variables meet