Ecology Exam 2
1/62
There's no tags or description
Looks like no tags are added yet.
Name | Mastery | Learn | Test | Matching | Spaced | Call with Kai |
|---|
No analytics yet
Send a link to your students to track their progress
63 Terms
Population
a group of individuals of the same species that vary in size over space and time
Populations are dynamic
variation in distribution and abundance over their geographic range
species are limited in distribution and abundance by
habitat susceptibility, historical factors, and dispersal
distribution
geographical area where individuals of a species occur
abundance
number of individuals in a given area
population ecology
study of how and why population abundance changes in space and time
genet
reproductive units with same genotype
ramets
physiological independent reproductive unit
relative population
number of individuals in one time period or place relative to another
absolute population
actual population abundance
Mark recapture formula
N=(M x C)/R
types of populations estimates
area counts (quadrats, mark recapture, line transects, citizen science, eDNA, etc.)
dispersion
spatial arrangements of individuals in a population
regular distribution
individuals are evenly spaced throughout environement
Random dispersion
individuals are randomly spaced
Clumped dispersion
individuals are clumped together (occurs in natural populations)
Specialist
eats highly specific diet made up of an abundant resource with a high handling time
generalist
eats a highly varied diet with lower
the Wallace line is an example of
Continental drift effect on species diversity
relictual distributions
occurs when the range of a formerly widespread species is constricted or fragmented
dispersal factors
relictual distribution, migration, contineteal drift, dispersal limitations (islands)
metapopulaiton
a set of spatially isolated populations linked to one another through dispersal
blinking lights metaphor in relation to metapopulations
populations will move and go locally extinct, blink lights in a space represent a population’s existence or extinction
Levin’s metapopulation formula
dp/dt=cp(1-p)-ep
Levin’s p represents
proportion of patches occupied
Levin’s c represents
patch colonization rate
Levin’s e represents
patch extinction rate
Assumptions for levin’s model
infinite number of identical patches, all patches have equal chances of colonization and extinction
if e/c<1
the population will persist
if e/c>1
all populations will go extinct
rescue effect
high rates of immigration from a nearby patch can protect small populations from extinction
Case study for e/c
spotted owls are at high risk of extinction due to habitat fragmentation, barred owls have monopolized on this fragmentation
urchin distribution is dependent on
sea otters
Bottom up control
increased nutrients cause eutrophication, leading to mass die-offs
top-down control
top predators control the abundance of populations
trophic species interactions
due to feeding
nontrophic species interactions
competition and facilitative

competition
two or more species overlap in the use of limiting resources

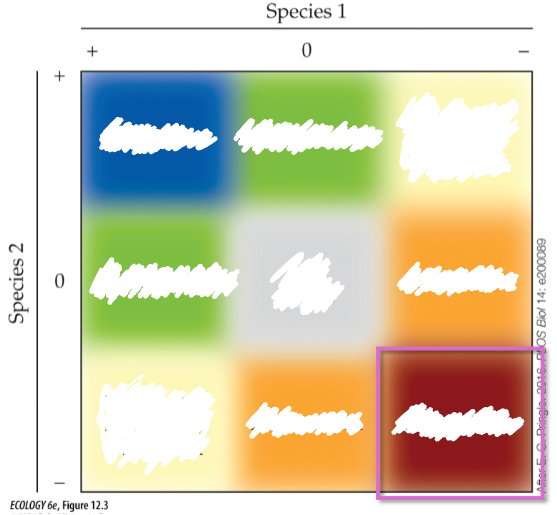
commensalism
one species benefits, another is neither harmed nor benefiting
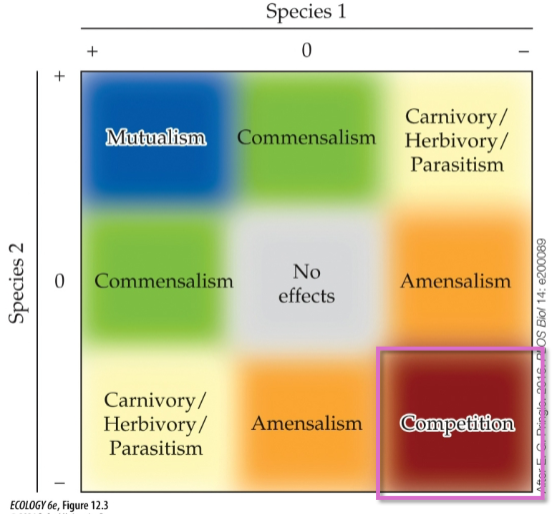

mutualism
both species benefit


amensalism
one species is unaffected and another is harmed ex. elephants walking


Predation
parasitism, carnivory, and herbivory: individuals of one species kill/consume individuals of another species

optimal foraging theory for generalists v. specialists
encounter rate v. handling time balance: carnivores will have a low encounter rate + handling time = eat everything; herbivores have high encounter rate and handling time=specialization (koalas)
mechanisms for predation
finding: search, ambush, trap
capture: poison, burst of speed, mimicry, etc.
animal mechanisms for predator avoidance
physical features (armor), warning features, mimicry, crypsis (camouflage), behavioral adaptation
landscape of fear is an example of behavioral adaptation
deer become afraid of roadways with the release of wolves, leading to safer roadways
plant mechanisms for predation prevention
structural defenses (thorns), chemical defenses, produce a lot of offspring, induced defenses (compensation growth + increasing existing defenses)
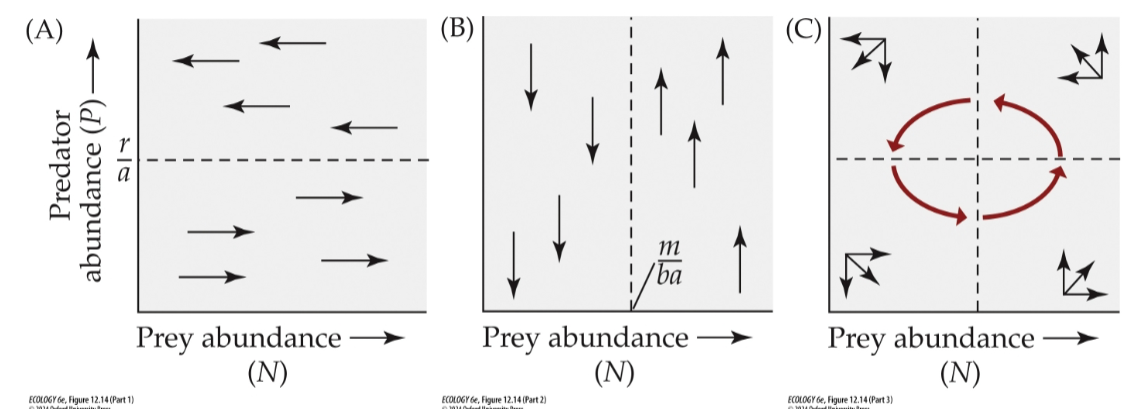
Lotka-Volterra Predator Prey relationship formula for prey
dN/dt=rN-aNP
rN in Lotka-Volterra pred-prey formula
population growth rate x prey population
-aNP
capture efficiency x prey pop x pred pop
Lotka-Volterra Predator Prey relationship formula for pred
dP/dt= baNP-mP
baNP in pred-prey formula
energy gain from prey
-mP in pred-prey
mortality rate x pred pop = starving pred
predator and prey isoclines and subsequent pop cycles
prey isoclines: r/a=P, prey decrease if P>r/a, increase if P<r/a, predator isocline: H=m/ba, pred decrease if N<m/ba
how can removing a predator impact community
removing top pred can decrease community diversity
#of parasitic species on earth
more than 50%
parasites are typically
specialists and feed on one or two host species
microparasite, macroparasite, parasitoid, hyperparasite
small, large, and parasitic as a baby, parasite of a parasite
ectoparasites v. endoparasites
ecto live on surface of host, endo live inside host → ectoparasites and vectors for endos
defenses against parasites
symbiotes (microbiome), vertebrate immune system, use plant biochemical defenses (eat plants or be plant)
red queen hypothesis: evolutionary arms race
species must constantly evolve to maintain fitness against evolving opposing species leads to coevolution
parasites
adapt to the most common host genotype
what stops an arms race
trade offs- parasites that trade virulence for high transmittance,