Lecture 3 - History and Constructions of Charts, trends, breakouts, stops
1/77
There's no tags or description
Looks like no tags are added yet.
Name | Mastery | Learn | Test | Matching | Spaced | Call with Kai |
|---|
No analytics yet
Send a link to your students to track their progress
78 Terms
4 types of charts
Line
bar
Candle
Point and Figure
Line Charts
Uses closing price and time
Used to study long-term trends
Advantage of line charts
Easy to construct and maintain
Disadvantage of line charts
Gives little information, exact time or trend change can be unclear
Bar Charts
Displays high, low, closing prices or HLC
best charts are OHLC
Left tick: open, right tick: close
Bar charts advantages
HLC can give you a better sense of direction
More veratile, volume usually included below
Bar charts disadvantages
Harder to maintain and requires more space if done by hand
Candlestick charts
Useed in Japan in 1600-1700’s
Include HLC, always open price
Real body: rectangular box formed by open and close price
Shadow: price extremes of the session
White: price advance at close
Black: price decline at close
Real Body
Rectangular box formed by open and close price
Shadow
Price extremes of the session
Most important chart in trading
Candlestick Charts
Candlestick chart advantages
More visual, positive and negative easily seen
Candlestick chart disadvantages
Harder to calculate and maintain by hand, patterns must be studied
Point & Figure
X for colume with rising price
O for declining price
Volume excluded normally
$ amount representing one box
The smaller the box, the more sensitive the chart
Point & Figure advantages
Information is compressed
Resistance and support levels are easier to spot
Better price targets for buy/sell signals
Good charting for continuous market
Point & Figure chart disadvantages
They don’t use time and volume as a consideration
Many unique patterns to P&F charts that must be studied
Arithmetic charts
Chart that uses dollars
Logarithmic charts
Chart that uses percentages
Best used for long term charts and for >20% increases
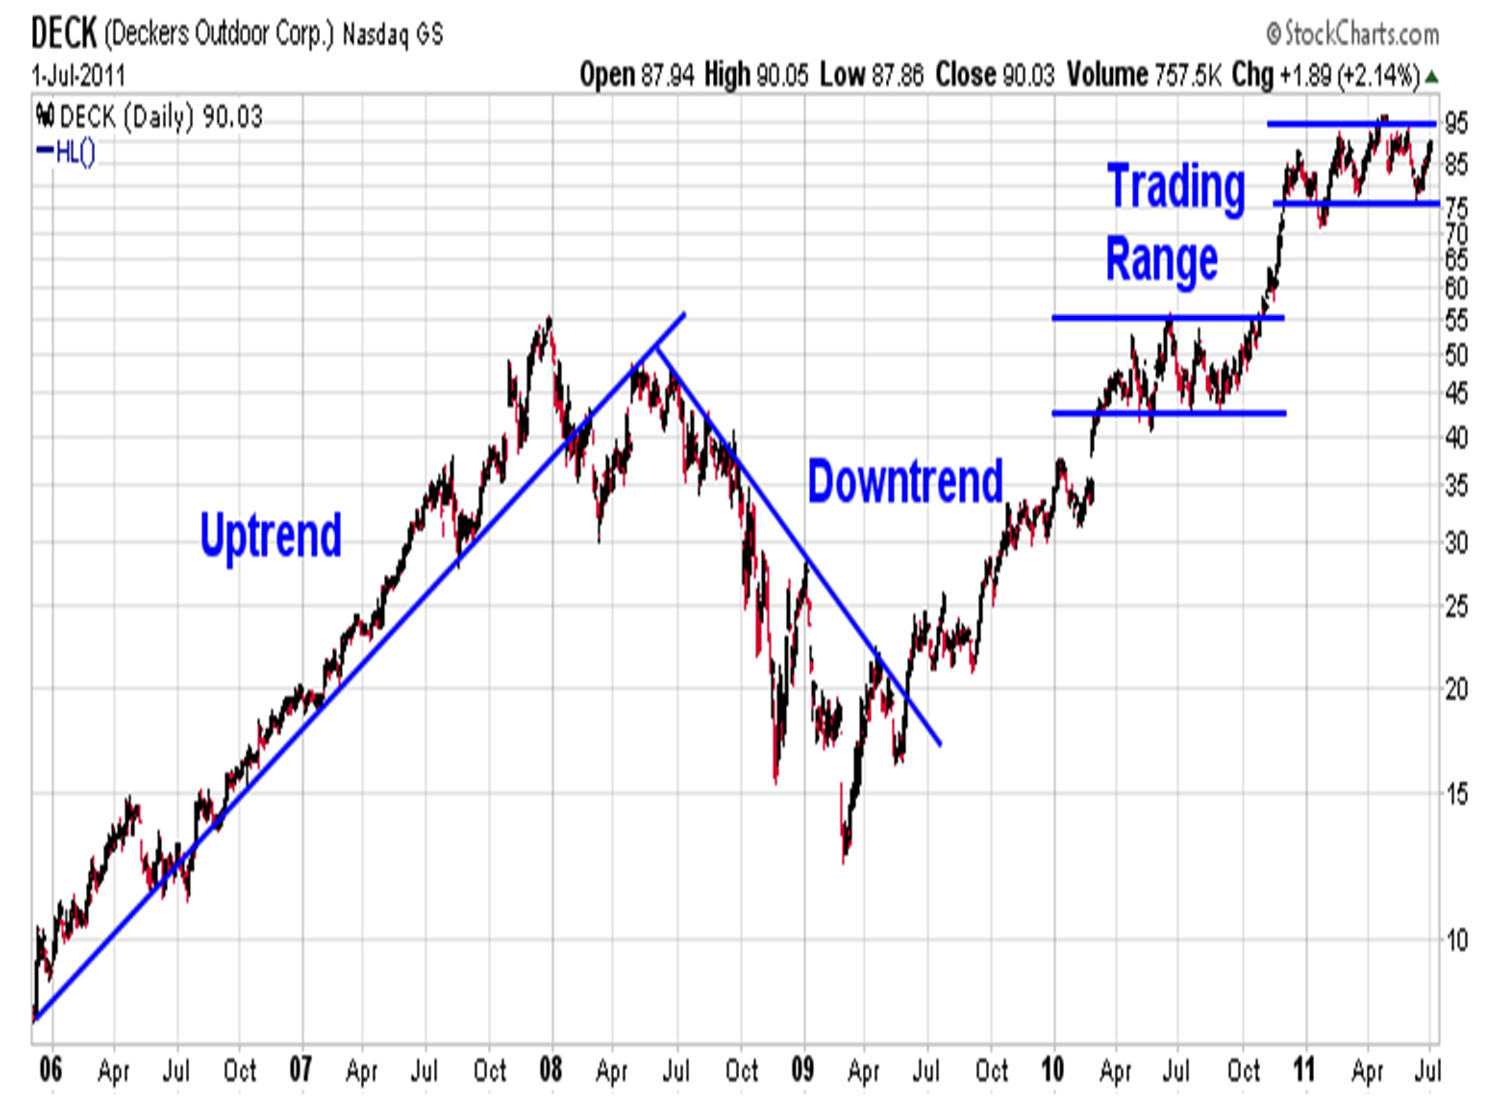
Directional Trend
One of rising or falling prices from which a profit can be generated with a trend following method
Trends tend to continue, rather than reverse
Trends are fractal (same behavior regardless of period)
When prices are trending, they remain headed in one direction and tell us that there is an imbalance of __________
demand and supply
Trading Ranges (sideways trends)
Occur when peaks and troughs appear at roughly similar levels.
Can also be called consolidations or congestion areas or rectangle formations
Graph of uptrend, downtrend, and trading range
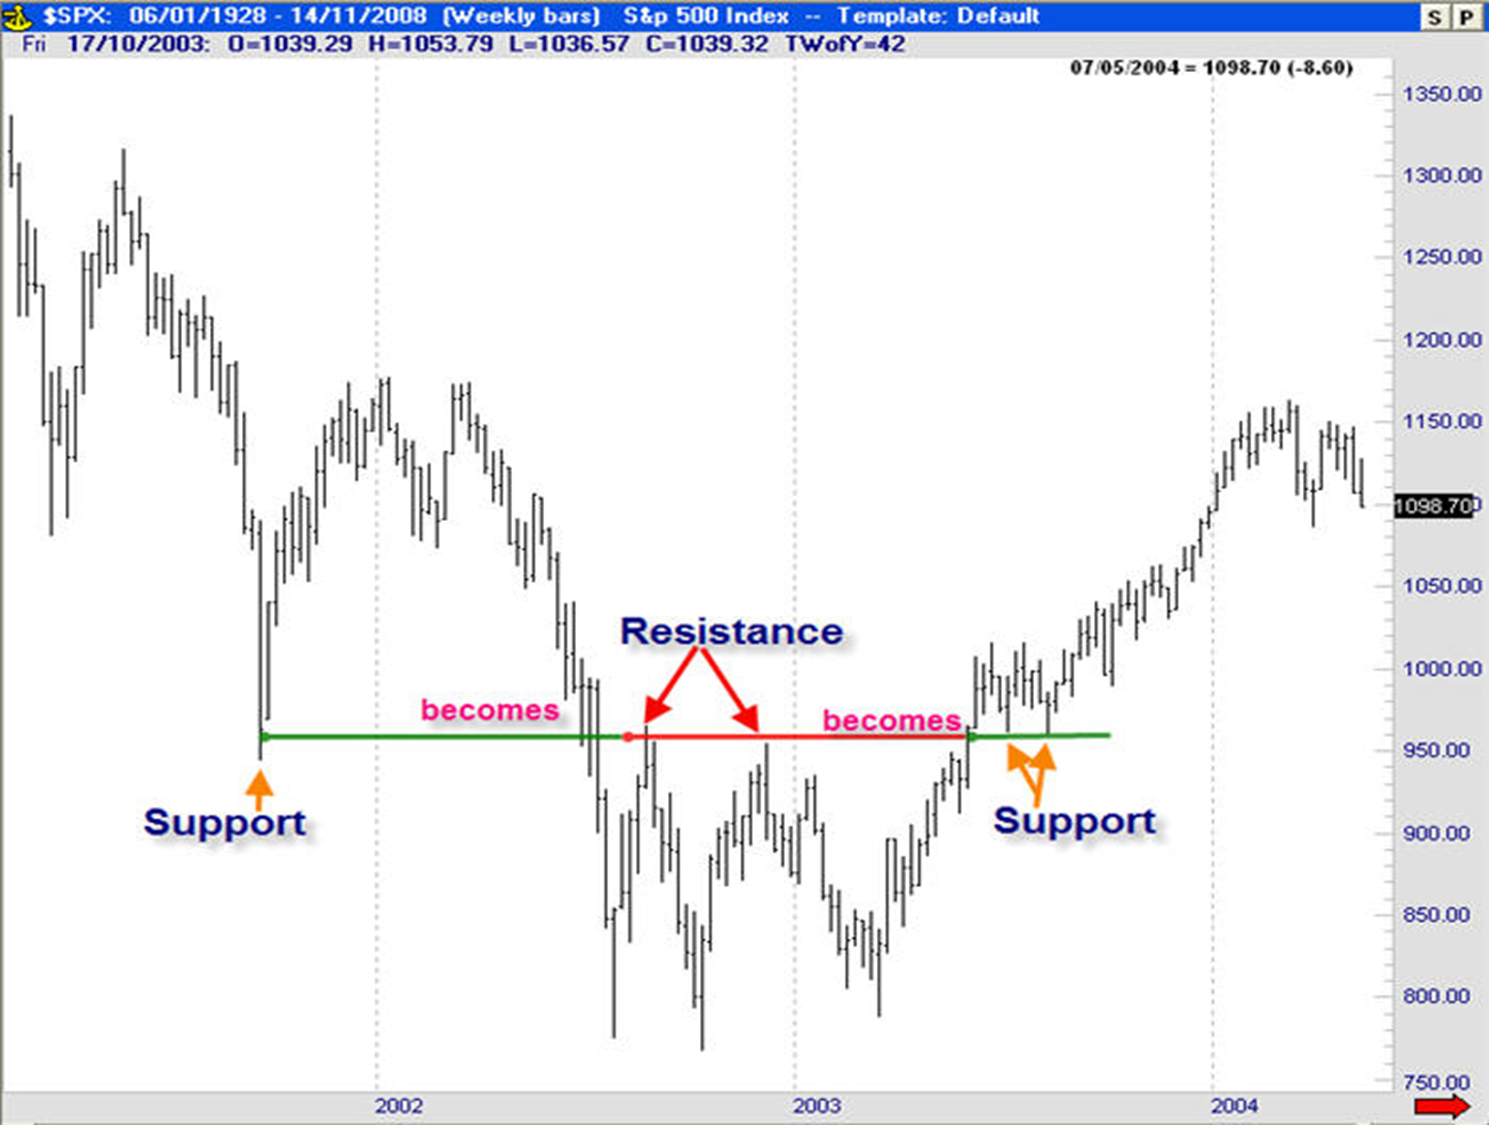
Change of polarity
When previous resistance becomes support
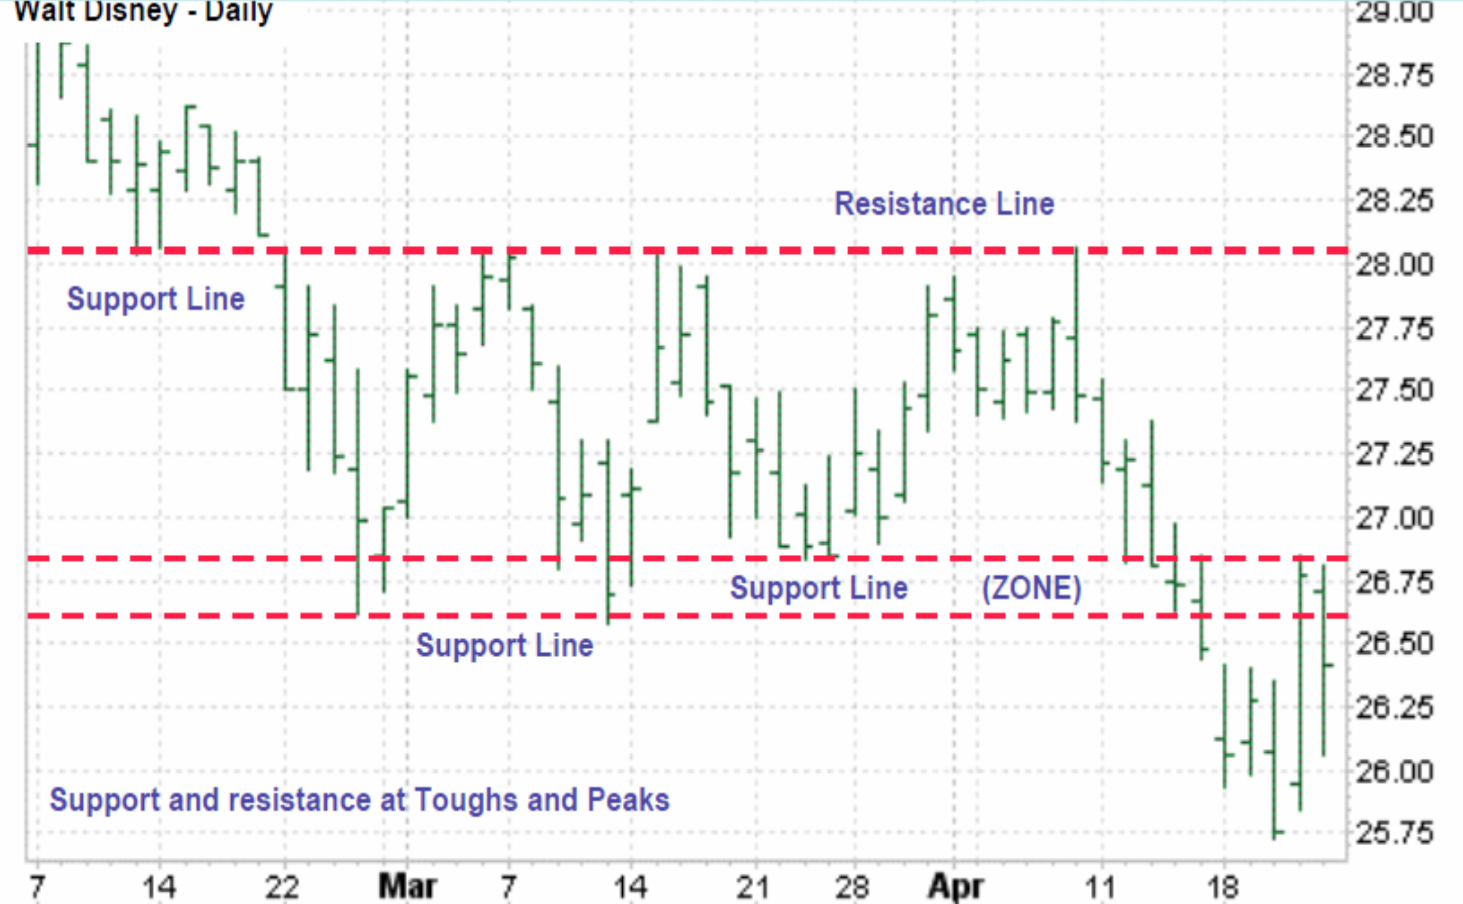
Support zones and resistance line
Support becomes resistance line graph
Breakout
When prices break below a support zone or above a resistance zone
Donchian Rule
Buy when the highest high over the past 4 weeks has been broken, and sell when the lowest low of the past 4 weeks has been broken
Best used with price buy breakouts, sell breakouts
Reversal points
Demark Method
Gann Two-Day Swing Method
High Volume Method
High Volume Method
High volume on reversal day, indicates that larger than usual activity occured on that day - ultimately stopping the rally/sell off. This is a strong confirmation signal that previous trend may come to an end
The steeper the angle of the directional trend, the more ________ the trend is. The problem is that it is not sustainable and we can expect a ________ if it gets too overheated
powerful, reversal
Usually any uptrend steeper than a ___ degree angle is _____ and should expect to _______
45, overheated, correct
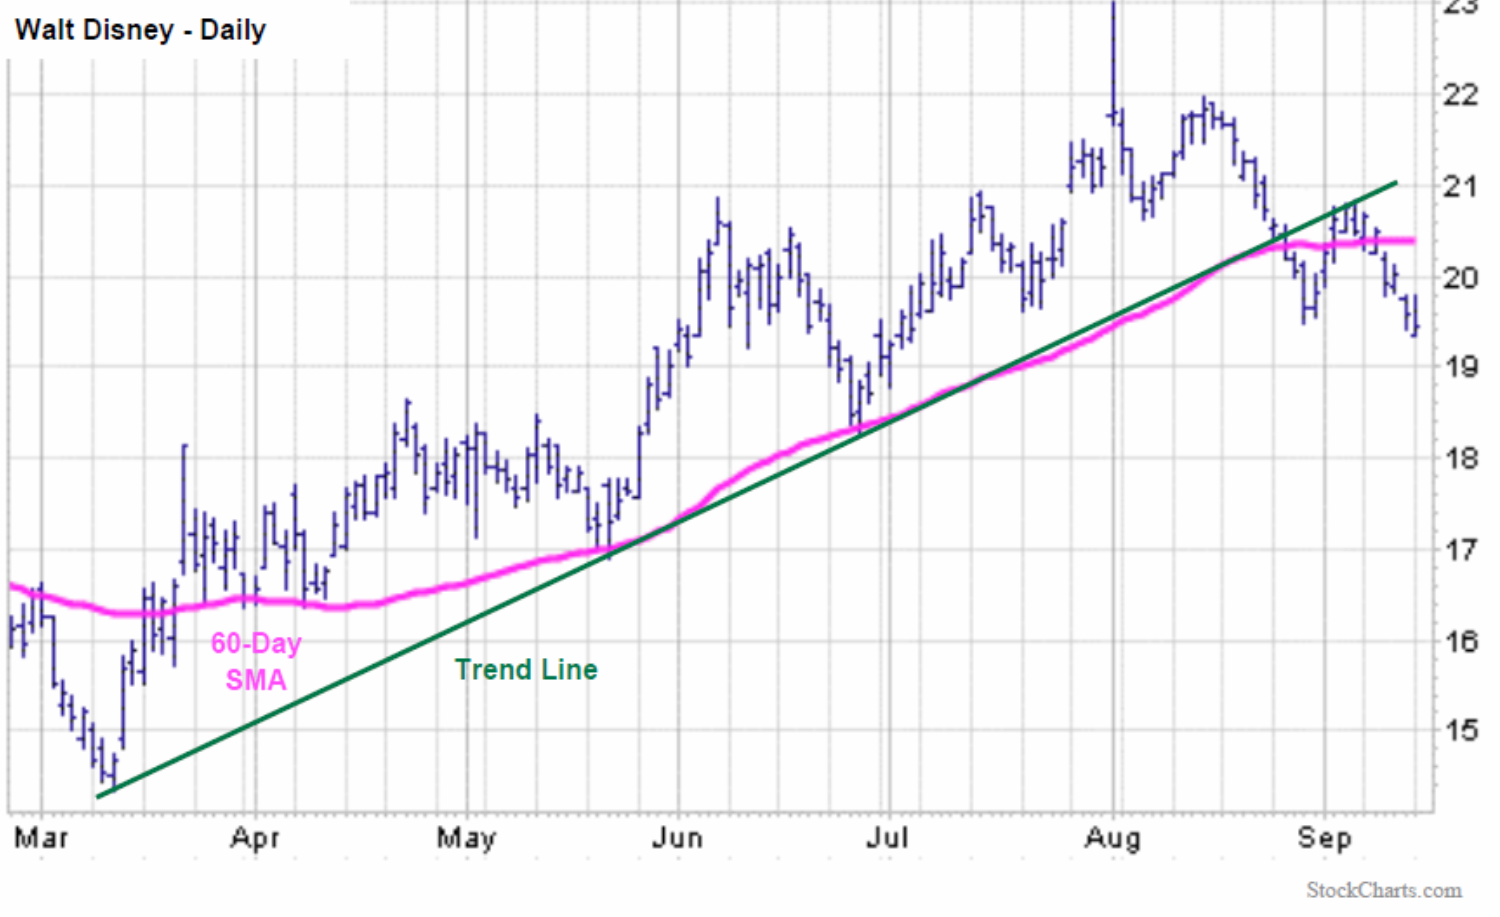
How are trends spotted
Using a regression line
Using trend lines
Spotting trends using trendlines
Lines are drawn between lows (support points), when the line is rising (uptrend), and is drawn between tops (resistance points), when price is declining (downtrend)
Problem with using trendlines when spotting trends
They may not be a straight line. In speculative bubbles or panics, they will accelerate upward/downward and run away from a standard straight trendline
Decelerating Trend Line/Fan Line
Opposite of an accelerating trend line
After __ fan lines are drawn, we should expect a ______ in direction
3, reversal
The ____ and ____ times the drawn line is touched by prices, the more significant it is when the trend line is finally broken
longer, more
The steeper the trend line, the more __________ it is, the more ______ it will be broken
unsustainable, sooner
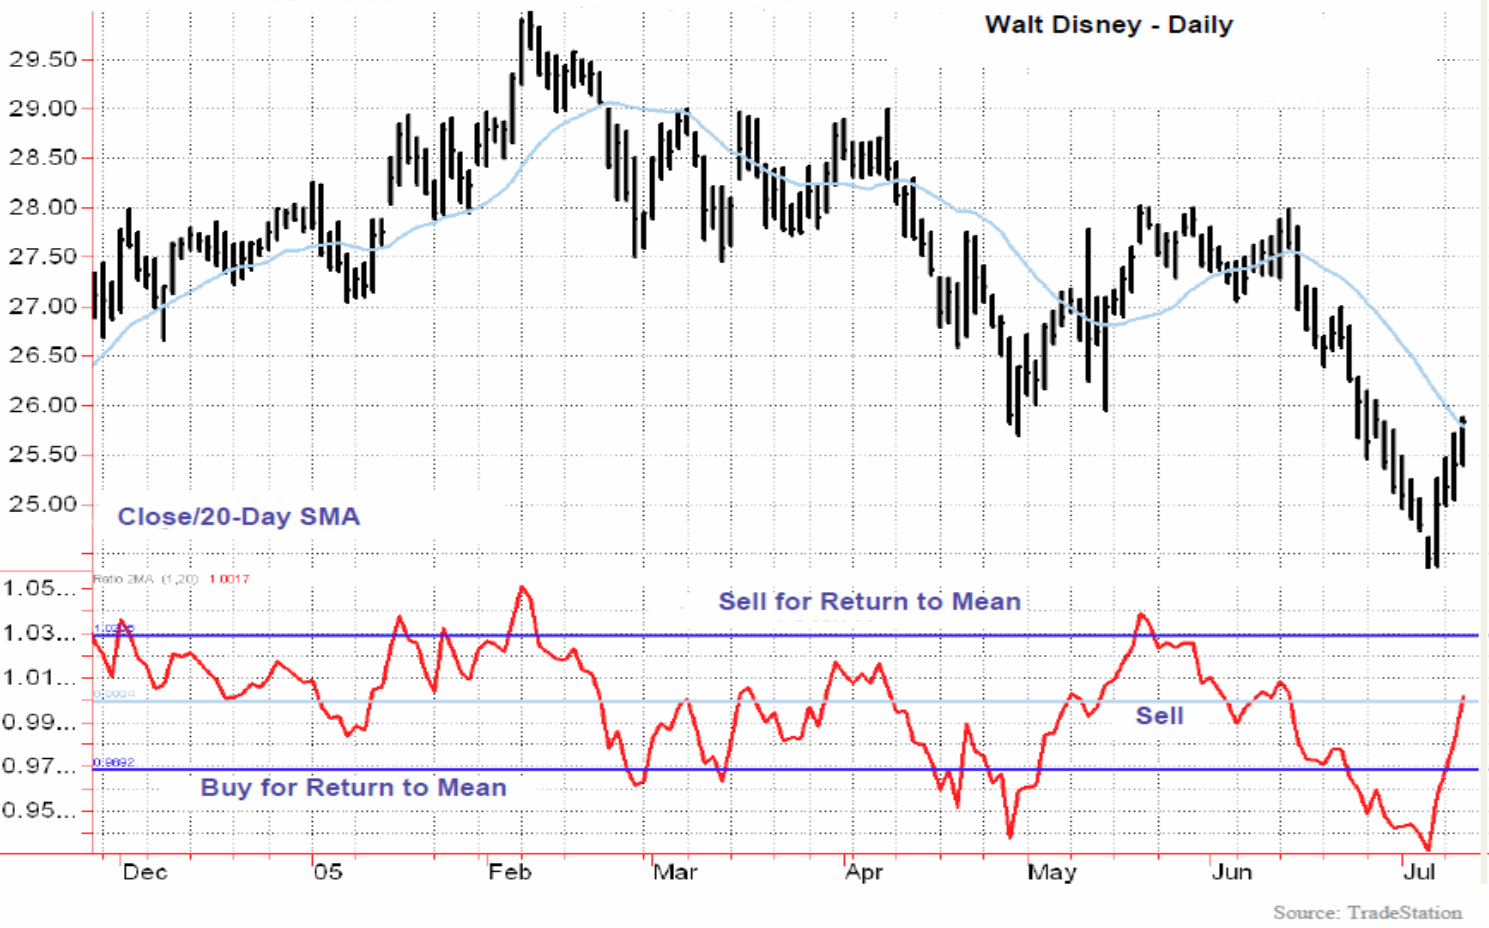
Retracements (secondary trends)
Corrections to principal trend
COunters trend moves, requiring only a 33% retracement of a previous trend
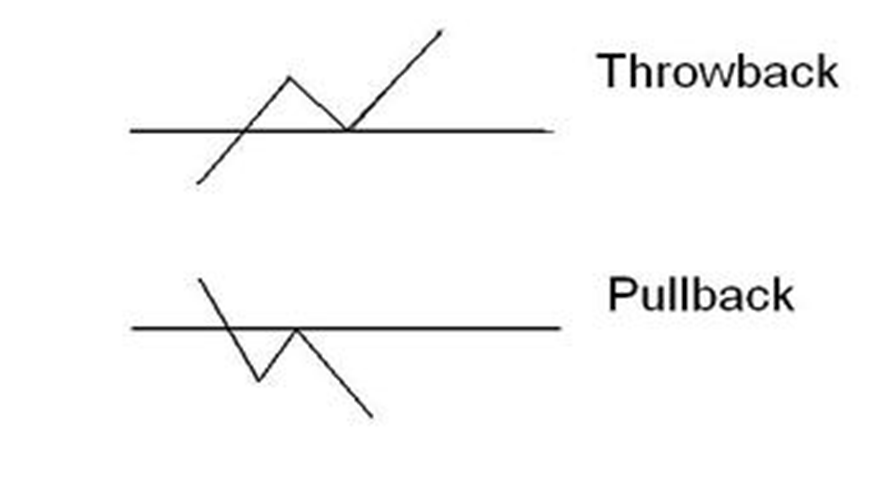
Throwback
Price retracement back to the breakout zone on an upward breakout
Pullback
Price retracement back to the breakout zone on a downside breakout
Pullbacks & throwback graph
Breakouts
Occurs when price breaks through a prior support or resistance level or zone, or a trend line
Signals a change in supply and demand, and that a new trend is beginning
Breakout confirmation methods
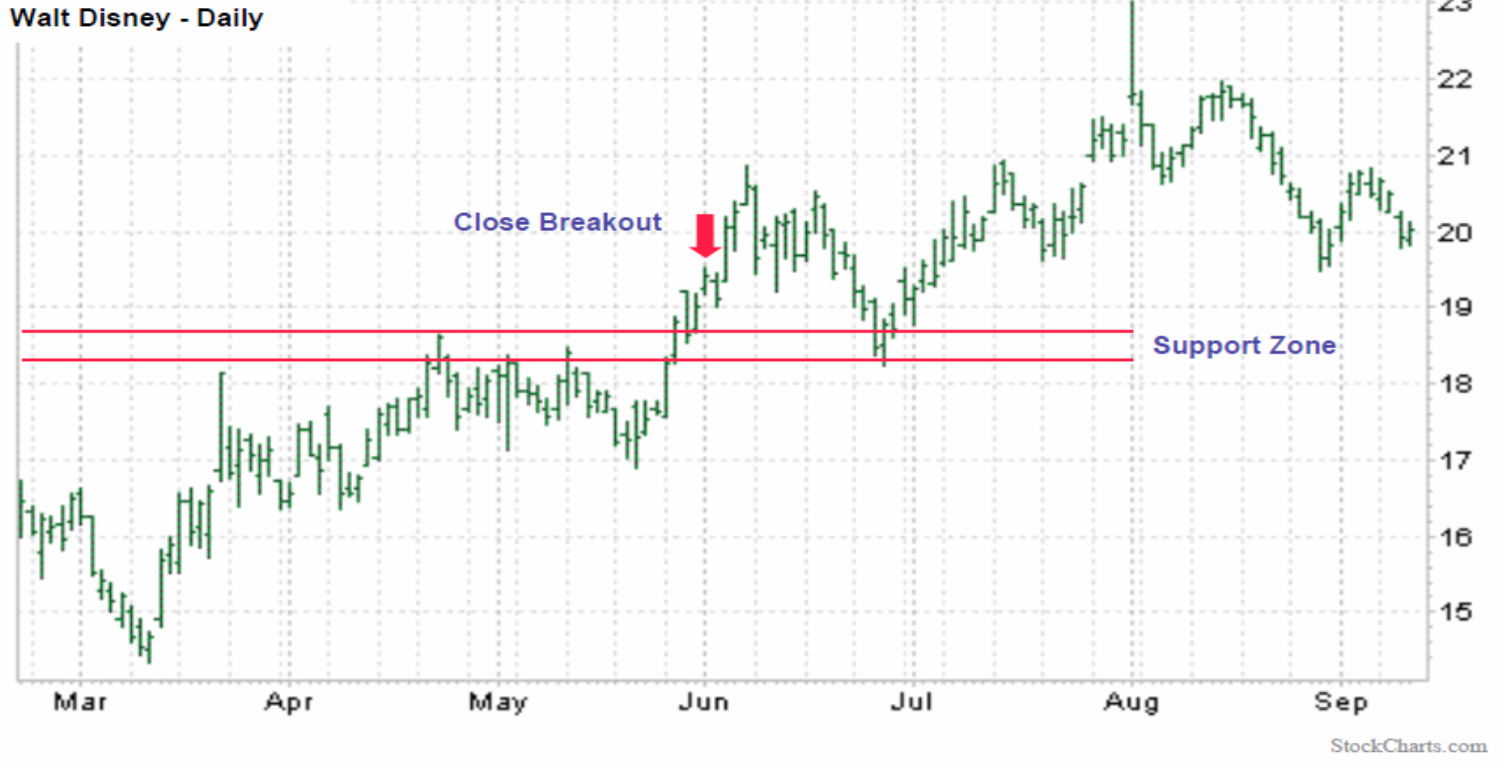
Closing Price (Filter)
Price or percent filters
Time since breaking support/resistance
Volume
Volatility
Closing Price (Filter)
Intraday penetrations likely false
2 days/bars
Tradeoff between probability vs opportunity
Closing Price filter graph
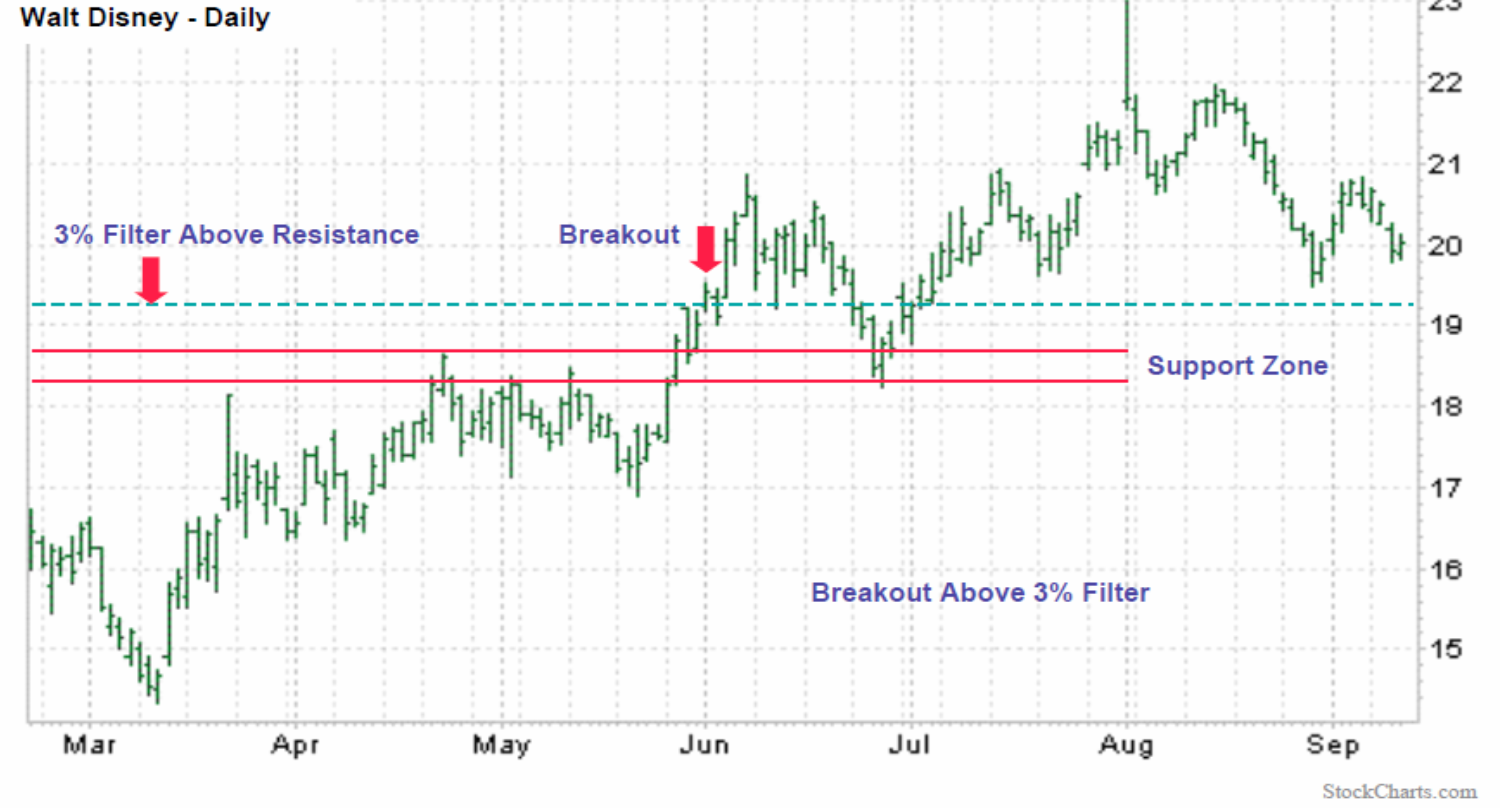
Price or percent filters
Use of a breakout zone
3% rule for breakout
3% filter graph
Time since breaking support/resistance
2 days +
Premise is that if prices remain outside the breakout zone for a certain time, it must be real
Volume
Usually increasing
Average True Range
Highly volatile securities should have a wider filter to accout for false breakouts
Moving average of the True Range (difference between each high and low bar over some past period)
True Range is calculated as the greatest of:
Difference between current bar high and low
Absolute value of the difference of the prior bar close and current bar high
Absolute value of the difference of the prior bar close and current bar lows
As price volatility ______, daily True Ranges will ______ and ATR will be ______. This means that highly volatile securities will have a ______ filter to account for its likelihood of a false breakout because of its higher volatility
increases, expand, larger
wider
Pivot Points
Used for confirmation with day trading to determine support/resistance level and as confirmations of breakouts
Pivot Point equation
P = (H + L + C)/3
Pivot Resistance Equation
R1 = (2 x P) - low previous bar
Pivot Support Equation
S1 = (2 x P) - high previous bar
Reward/Risk Ratio
Usually breakouts from support or resistance run to the next zone of support or resistance, giving the investor a price objective for a breakout
Moving averages are used to _____
smooth erratic data and show trends
The longer the SMA, the ____ influence each data point has on the SMA
less
The longer the SMA, the _____ it is to change but the more ______ it is
slower, reliable
The shorter the SMA, the ___ it changes in direction, but more frequently it errs
faster
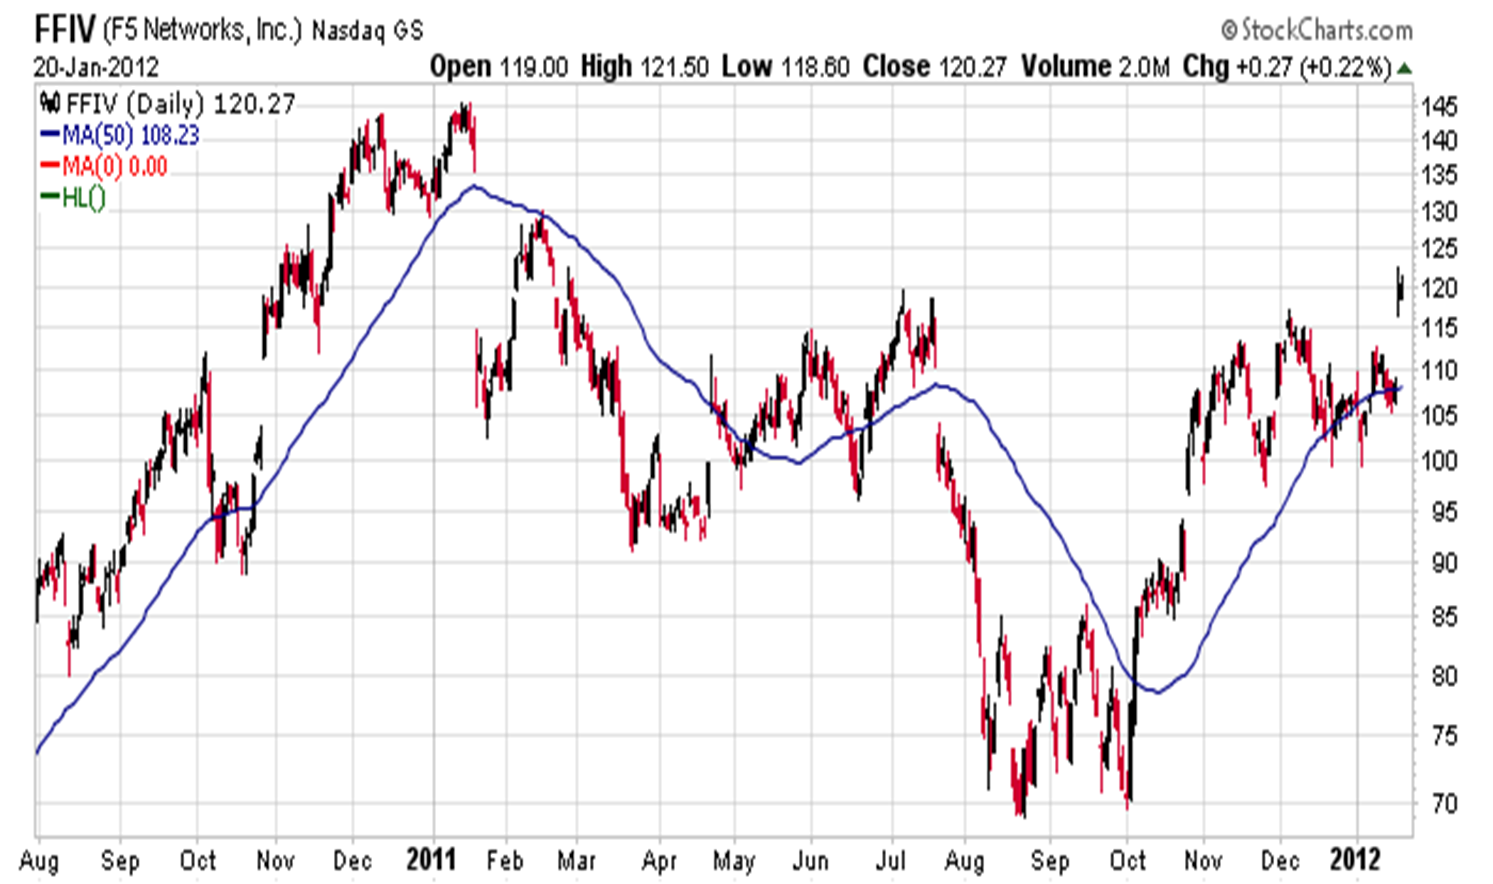
Where moving averages cross is often a _______ and ________ area
support, resistance
Buy and sell indicators based on moving averages
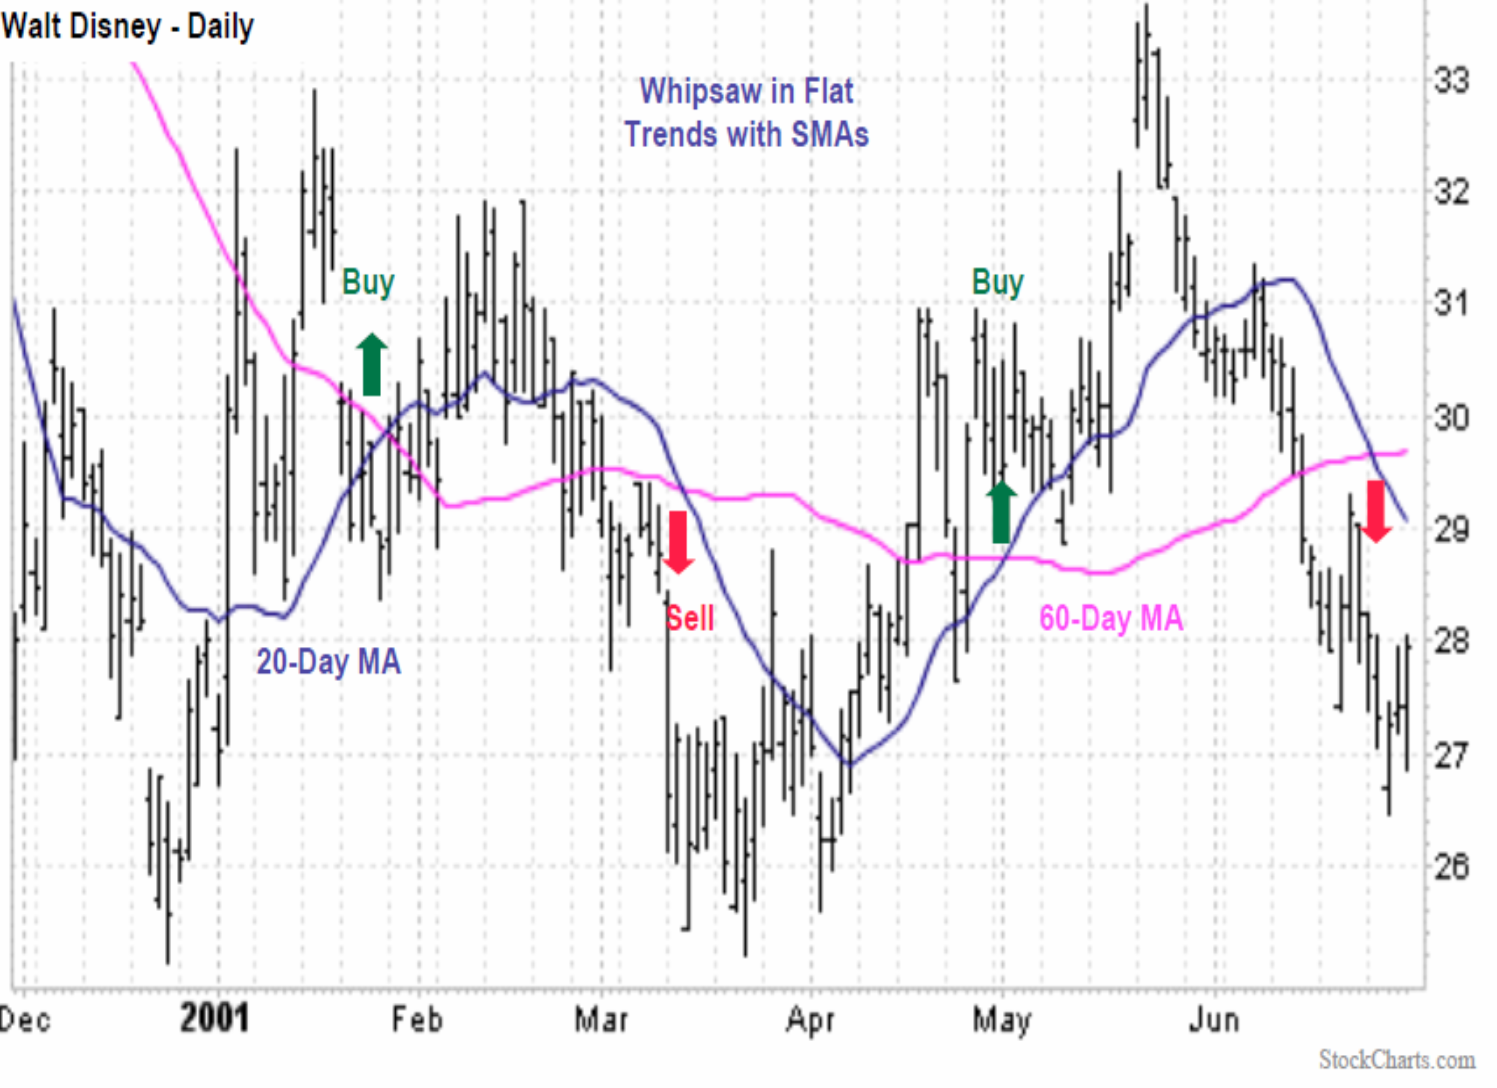
Use of moving averages
Determining trend, direction of and slope of moving average
Support and Resistance
Price extremes
Moving average graph
Support and resistance in a moving average graph
Price extremes in moving averages graph
Envelopes percentage
Calculated as taking percentage of a moving average and creates two symmetrical lines
The percentage is determined by experiment and shouldn’t be too large or small
Crossing the bands becomes a trigger for buy/sell
One of biggest problem is that they do not account for the changing volatility of the underlying
Bands
Same as envelope except adjusted for volatility (standard deviation)
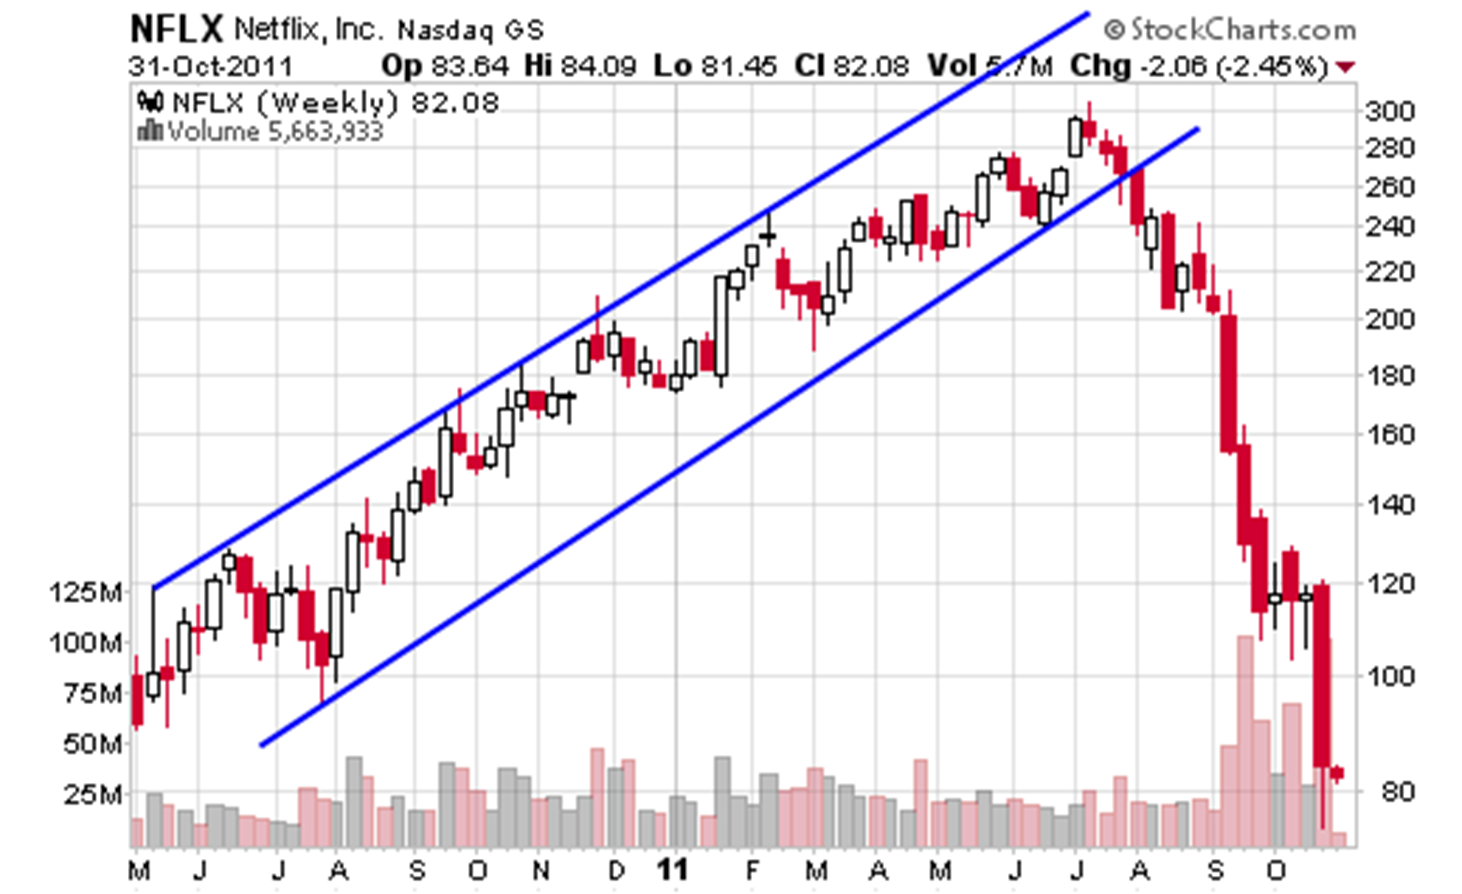
Channel
Trading range tipped at an angle such that it trends up/downwards
Bollinger Bands
Bands used standard deviation to measure volatility
± 2 standard deviations of a 20 period SMA (simple moving average)
Bollinger Bands Graph
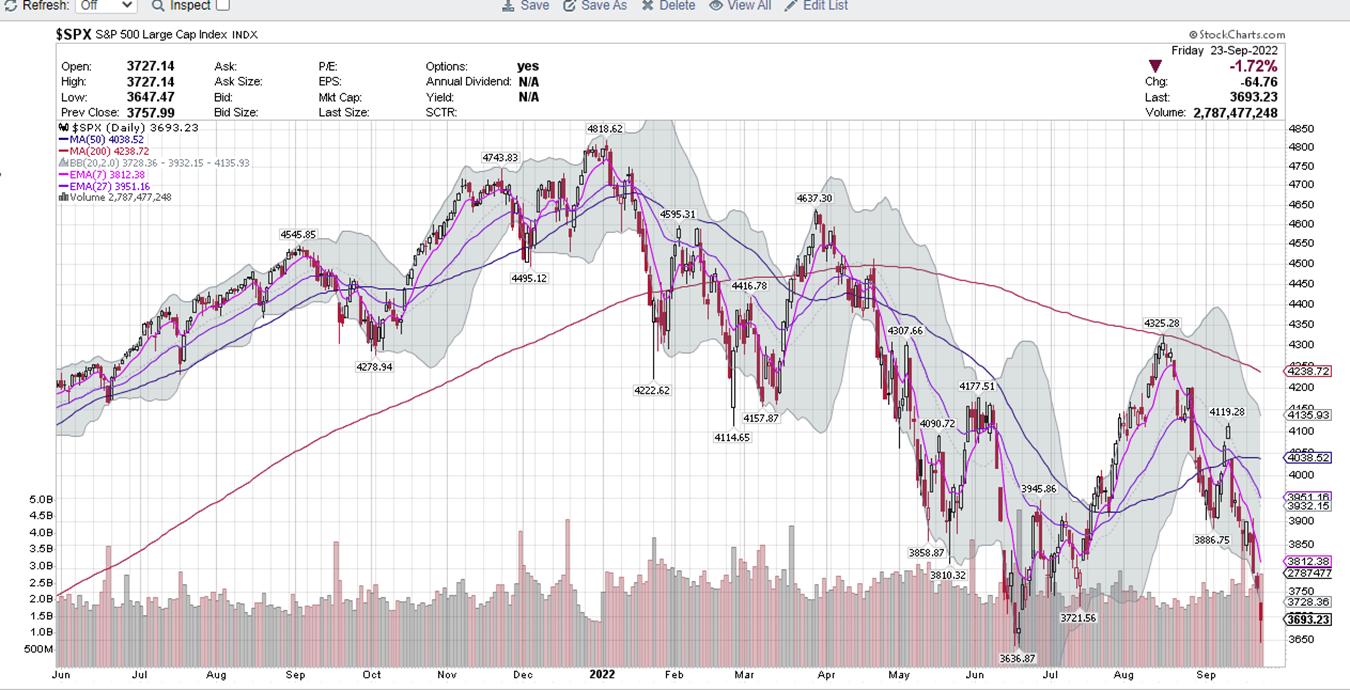
Tightening bands represent ________ volatility, sharp price move expected
shrinking
Broadening bands represent _______ volatility and and potentially strong trend
increasing
Calculate %B (bandwidth indicator)
Difference between high band and low band, which represents increased volatility; breakouts can be confirmed with this, therefore volatility can warn of trend change
Channels
Can make us predict where the price action in the up or downtrend will occur
Channels example