evolution exam 2
1/140
There's no tags or description
Looks like no tags are added yet.
Name | Mastery | Learn | Test | Matching | Spaced | Call with Kai |
|---|
No analytics yet
Send a link to your students to track their progress
141 Terms
evidence of natural selection 3
beautiful design
odd design
good design
natural selection has to explain
every adaptation
- In most cases, this adaptation is step-by-step
Examples
Body form, size, & color
How fishes evolved limbs & whales evolved flippers
Behavior, including altruism & cooperation
Our metabolic system
Our immune system
SEX!
Why we don’t live forever (and probably why we get wrinkles and sore knees as we age)
The human eye (which also includes some bad design)
artificial selection
natural selection definition
A difference, on average, between the survival and reproduction of individuals with certain phenotypes compared to individuals with other phenotypes
not survival of the fittest
It is difficult to define natural selection in a succinct manner, because natural selection is not a “force” like Newtonian
mechanics: it is a multi-step process
natural selection steps? 3
individuals vary in phenotype
some of this phenotype variation is heritable
the variable heritable genetic traits affect an individuals probability of leaving offspring (“selected” by nature)
natural selection - struggle for existence leads to __?
Not all individuals survive to reproduce, or reproduce maximally
There is a struggle for existence, leading to variability in reproductive output
industrial melanism
Before 1850: light form at nearly 100%
Coal pollution darkened the tree trunks and killed the lichens
1848: 1st dark morph in Manchester, England
Within about 50 years, the dark morph increased to nearly 100%
Clear air legislation passed in 1950
today: light form >70%
outcome of natural selection: genetic composition of the population changes across generations
natural selection nuances 12
only impacts …
operates on what
can operate even if …
composed of _
every generation reflects ___
does not lead to ___
what can evolve?
what must each adaptation do?
what determines which genes make it to the next generation?
is it random?
what does it never do?
can only improve what
Traits under natural selection only impact the probability of survival and reproduction
Natural selection operates on the phenotypes of individuals within a population, while populations evolve across generations (the gene pool is changed)
Natural selection can operate even if the characters under selection are not heritable – but in this case, the population will not change in its genetic composition across generations
Natural Selection is a process composed of testable components
Natural Selection cannot predict the future. Every generation reflects the impacts of natural selection on the previous generation. (Avoid teleology)
Natural Selection is not progressive, and does not lead to perfection. It can only filter variation according to fitness in the current population
New traits can evolve by natural seelection
an adaptation must evolve by increasing the reproductive success of its possessor
Reproduction, not survival, determines which genes make it to the next generation
A gene that benefits reproduction at a young age, yet leads to wrinkles, grey hair, stiff joints, beer guts, and disease in old age, can be favored by natural selection
Another definition of natural selection = the non-random survival and reproduction of variants randomly generated with respect to need
Natural Selection is not random: with knowledge about ecology and heritability, evolution by natural selection can be predicted accurately.
Natural selection never favors a trait “for the good of the species,” as it can only act on individuals and proceeds without foresight (no teleology!)
Natural Selection can only improve the mean fitness of a population. It can never operate to lower mean population fitness, even if that is a good idea from a design perspective
An appropriate metaphor, developed by the great French geneticist Francois Jacob, is to think of evolution as a “tinkerer” rather than an engineer
Tinkering proceeds step-by-step, including complex structures such as the vertebrate eye
This imposes important limitations, or “evolutionary constraints,” on evolutionary change
Evolution cannot select on variation that does not exist, and biases in the production of variation can influence the evolutionary path taken by a population
variations of individual phenotypes can be due to 3
could be due to genetic factors, environmental factors, or their interaction
finches
beak depth is hertiable
big drought = 84% finches died, struggle for existence, seed abundance dropped dramatically = struggle for existence of seed eaters
characteristics of the average seed also change
direction of selection depends on ecology (droughts etc)
bad design by evolution
Bad Design: An engineer or biologist could do better, but the oddities are tell-tail marks of evolutionary tinkering by natural selection
fitness
the extent to which an individual contributes genes to future generations.
A good measure of fitness is the number of offspring produced by an individual in its lifetime.
Usually fitness is applied to phenotypes. For example, what is the average fitness of green vs. red beetles?
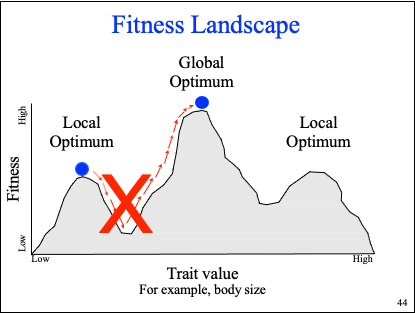
fitness landscape
fitness v trait value
fitness v trait value
can go from a peak to valley, or vice versa, but never straight from peak to peak/valley to valley
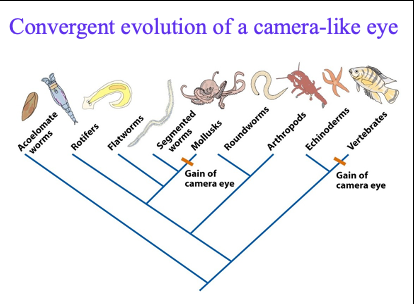
convergent evolution of camera like eye
how does a camera like eye evolve?
vertebrate eye: the axons, nerve fibers, of the retinal cells run over the retina and converge into the optic nerve forming a blind spot
octopus eye: in cephalopods, the axons run directly from the base of the retinal cells into the optic ganglion
hardy weiberg equation
p2+2pq+q2 = 1
AA Aa aa
assumptions for HW principle to be true 8
Diploid organism
Sexual reproduction
Non-overlapping generations
Infinite population size
No migration (no gene flow)
No mutation
No natural selection
Mating is random
bolded in evolution
how HW can change with the assumptions ¾
allele frequencies, genotype frequencies, reestablished by ?
If the allele frequencies in a population are given by p and q, then genotype frequencies will be given by p2, 2pq, and q2 when the population is in Hardy-Weinberg equilibrium
Within a population, allele frequencies will not change from generation to generation unless one of assumptions 4 – 7 is violated. Violation of assumption 8 (random mating) changes genotype frequencies, but not allele frequencies
Only one round of random mating is required to re-establish H-W equilibrium
simplified
allele frequencies are p and q, then genotype frequencies are p2, 2pq, q2
allele frequencies will not change unless assumption(s) 4-7 are violated
genotype frequencies (not allele) will change when 8 is violated
random mating reestablishes HW
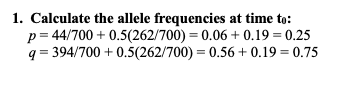
how to calculate frequency of allele A vs a
A = A2 + ½ 2Aa
A = p2 + ½ 2pq
sub q for 1-p
A = p2 + p(1-p)
A = p
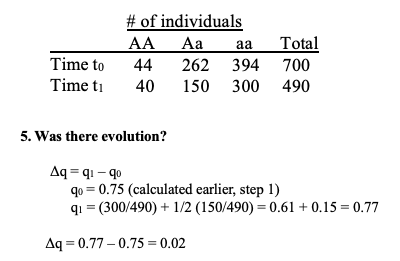
p = AA + ½ Aa / # individuals total = %
q = 1-p = aa + ½ Aa / # individuals total = %
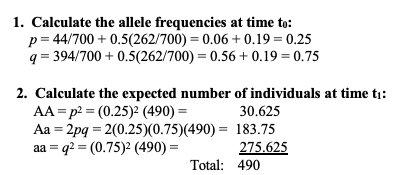
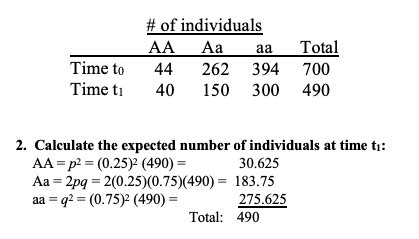
calculate expected number of individuals with a genotype given allele frequencies
p = X allele frequency
q = Y allele frequency
p2 = X2 * total individuals
2pq = 2 * X * Y * total individuals
q2 = Y2 * total individuals
steps to a statistical test 6
1.Have a hypothesis
2.Define the expectation under the null hypothesis of no effect
3.Collect data
4.Compute a test statistic
5.Find the probability of your test statistic under the null hypothesis
6.Interpret your results
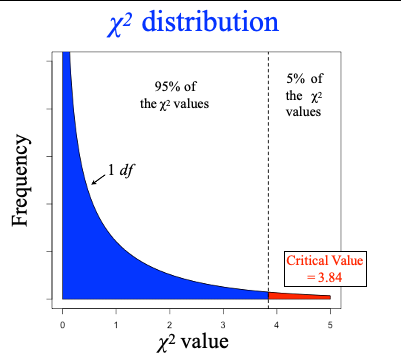
chi-square test
X2 = SUM ( observed - expected )² / expected
draw X2 distribution and what is the critical value
fitness: absolute, relative, component, natural selection,
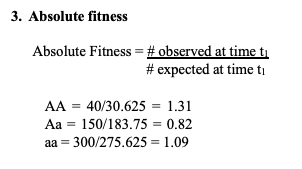
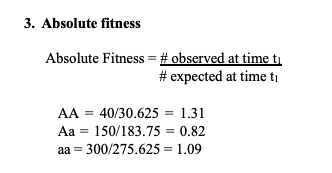
Absolute Fitness: The fitness of a phenotype is the average lifetime reproductive success of individuals with that phenotype (alternatively, the per capita growth rate of a phenotype)
Fitness component: an individual’s score on a measure of performance expected to correlate strongly with the genetic contribution to the next generation (e.g., survival, fecundity, etc.)
Natural Selection: A consequence of differences in fitness between individuals that differ in phenotype
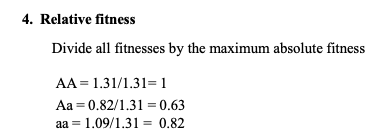
Relative Fitness (W): The fitness of a phenotype compared with others in the population. Usually, the maximum relative fitness = 1. To calculate relative fitness, divide all absolute fitness values by the maximum absolute fitness.
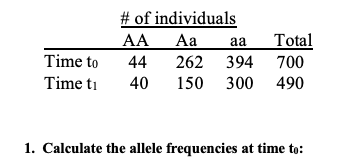
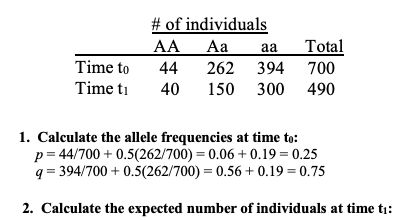
calculate expected number of individuals at time t1
calculate absolute fitness
absolute fitness equation
how to calculate relative + equation
how to solve if there was evolution?
what is fitness 3
description? explanation?
how does a trait contribute to the reproductive success
how is fitness context dependent?
fitness is a description, not an explanation
herbert spenser - survival of the fittest
tautology: who survives? the fittest. who is the fittest? those that survive - explains fitness
an advantageous trait causally contributes to the organisms survival and reproductive success
doesn’t tell us why
may be genetically correlated
the phenotype of an organism in relation to the environment it inhabits determines how fit that organism is
fitness is context dependent
finches - example?
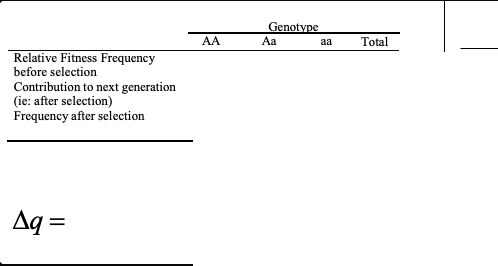
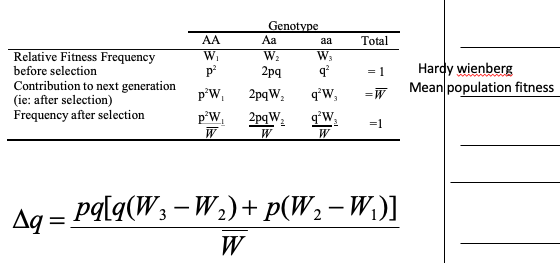
the general selection model
and /\q
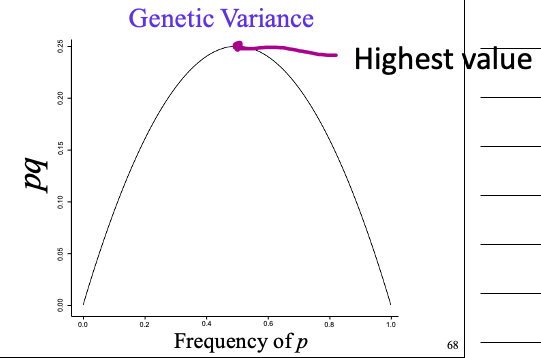
genetic variance pq and frequency of p - graph and location
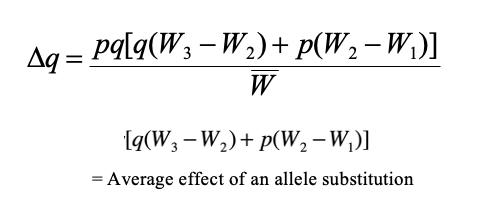
general selection model equation
and what it can solve for
The greater the difference between the relative fitnesses, the …
This quantifies the relationship between allele frequency and fitness. The greater the difference between the relative fitnesses, the greater the rate of evolution
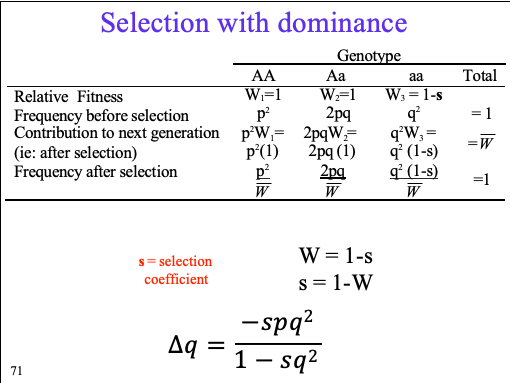
selection with dominance /\q = ?
relative fitness, frequency before selection, contribution to next generation, after selection, frequency after selection
where s = selection coefficient
directional selection
Directional selection will always __ mean population fitness
a mode of natural selection in which a phenotype is consistently favored, causing allele frequencies to shift over time in the direction of that phenotype.
The rate of change in allele frequency is a function of the allele frequencies, the relative fitness values, and the mean population fitness in the population (as reflected in the General Selection Model)
Directional selection will always increase mean population fitness
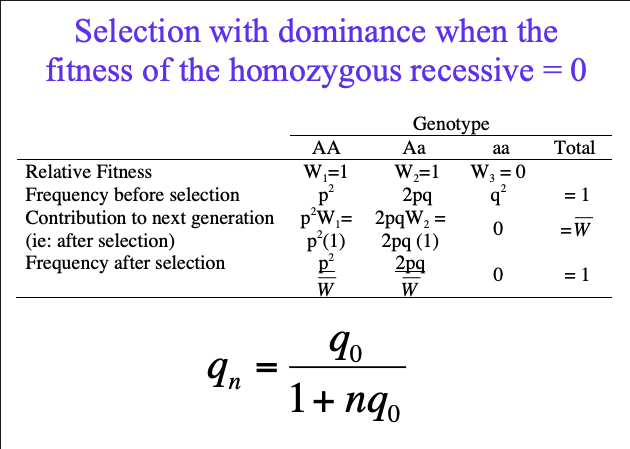
Selection with dominance when the fitness of the homozygous recessive = 0
relative fitness, frequency before selection, contribution to next generation, after selection, frequency after selection
qn =?
eugenics
The study and practice of control over the evolution of human populations in an effort to decrease the frequency of undesirable traits (a largely ugly history)
cystic fibrosis
Cystic fibrosis transmembrane conductance regulator (CFTR)
Cell surface protein
Expressed in the mucus lining of the intestines and lungs
CFTR enables cells to ingest and destroy the bacterium
Pseudomonas aeruginosa
Homozygotes for loss-of-function mutations suffer chronic infections with the bacterium, resulting in cystic fibrosis and severe lung damage
Homozygotes for loss of function mutations suffer chronic infections with severe lung damage (s = 1)
30,000 disease-causing alleles sequenced
500 different loss of function mutations found!
estimated rate, mu = 6.7 × 10^-7
known rate? mu = 0.0004
how does it compare to estimated rate? lower than predicted?? im so lost
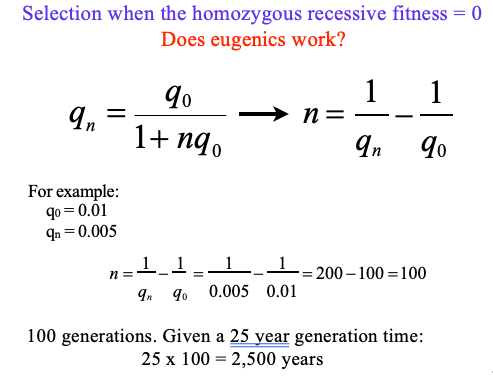
eugenics + cystic fibrosis: selection when the homozygous recessive fitness = 0
given q0 = 0.01, qn = 0.005
does eugenics work? (how long will it take)
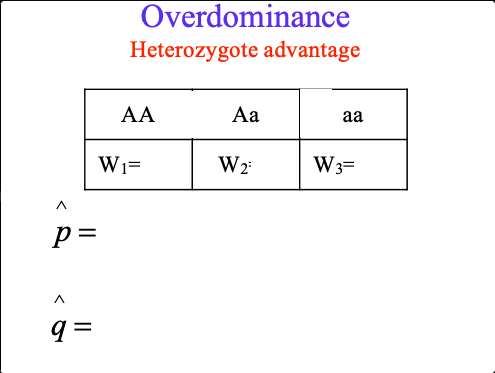
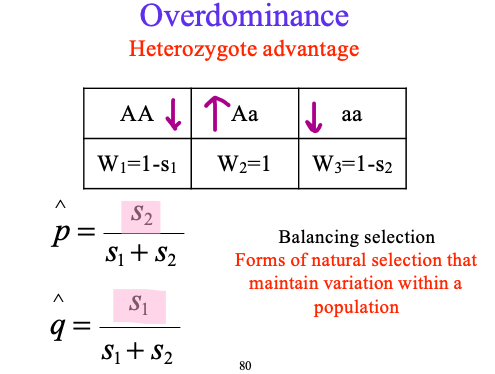
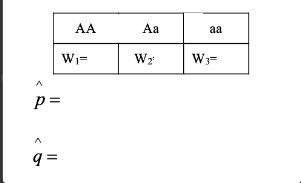
overdominance find p and q
balancing selection
where Aa are dominant
Forms of natural selection that maintain variation within a population
sickle cell anemia
HbA: normal allele in hemoglobin
HbS: sickle cell allele in hemoglobin
Homozygotes for the HbA allele are susceptible to malaria in West Africa
Malaria caused by the protozoan Plasmodium falciparum (Alveolata)
Invades red blood cells and eats the hemoglobin
Maria causes severe fevers
Infected blood cells clump up and cause dangerous clots
Homozygotes for the HbS allele suffer from a severe anemia
The red blood cells do not carry oxygen well and form a sickle shape when they do not have oxygen
This blocks blood vessels and eventually leads to death
When sickled cells pass through the spleen they are detected by white blood cells as defective and destroyed (not good when you are already short on with oxygen!)
overdominance + sickle cell anemia
HbAHbS heterozygotes are resistant to malaria but suffer mild anemia
estimated relative fitness in West Africa
AA: 0.88, Aa: 1.0, aa: 0.14
predicted equilibrium: HbA: 0.88, HbS: 0.12
observed frequency: HbA: 0.89, HbS: 0.11
underdominance
special?**
AA and aa homozygotes are dominant
s is negative
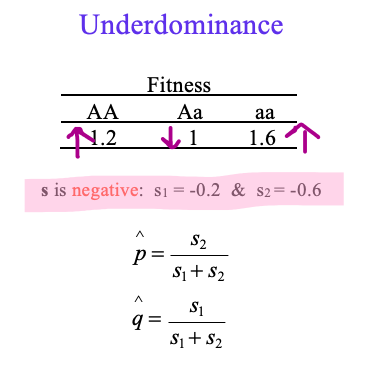
Underdominance
What are the stable equilibria?
Is underdominance an example of balancing selection?
What are the stable equilibria?
0, 1 – 0%, 100%,
Is underdominance an example of balancing selection? NO
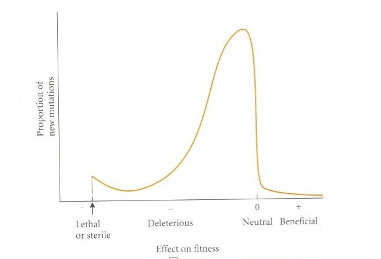
mutation 6
Mutations the “raw material” of the evolutionary process
Mutation = fundamental to evolutionary theory
Mutation includes
point mutations
indels
gene duplication
transposable elements
chromosomal mutations (e.g. inversions, translocations)
genome-level mutations (e.g. polyploidy)
mutations caveats 3
environment, constraints?
Mutation has causes, but is random with respect to adaptive “needs” (avoid teleology!)
The environment does not induce adaptive mutations: no “inheritance of acquired characters”
Lamarck (1744-1829): Philosophie Zoologique (1798)
Epigenetic inheritance is not truly Lamarckian
Developmental constraints prevent many mutations from ever being expressed at the phenotypic level or biases the production of phenotypic variation in particular ways
purifying selection
removing dominant/co-dominant
removing recessive
Purifying selection = selection against deleterious mutations
Removed by selection if dominant or co-dominant
If recessive, mutation/selection balance
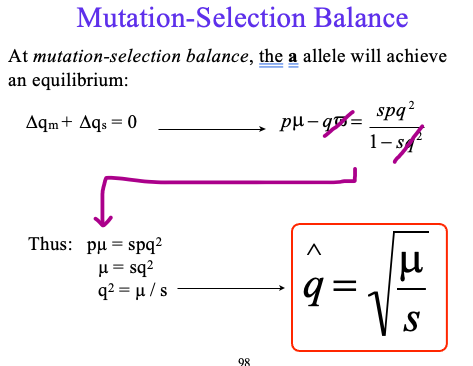
mutation-selection balance
selection w/o mutation
mutation w/o selection
µ = A → a (forward mutation rate)
ν = a → A (backward mutation rate)
How does mutation change the frequency of allele a?
If ∆qm is the per generation change in q due to mutation, then:
∆qm = pµ – qν
If pµ > qν, then ∆qm is positive
Mutation without selection will increase the frequency of the a allele
Selection without mutation will decrease the frequency of the a allele
When there is selection against the aa genotype, the frequency of the a allele declines
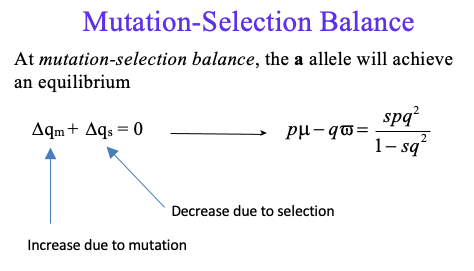
final q of mutation-selection balance
spinal muscular atrophy
Neurodegenerative disease – degeneration of the muscles that control voluntary movement
Deletions at one locus cause the disease
One of the most common lethal autosomal recessive diseases in Caucasians
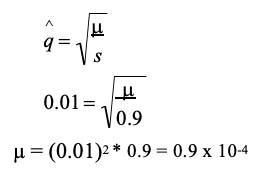
Frequency of loss-of-function alleles = 0.01
Fitness of homozygotes for loss of function alleles = 0.1 (s = 0.9)
Direct Estimate of mutation rate: Sequenced 340 patients with SMA, as well as their parents
Estimated mutation rate: 1.1 x 10
Mutation/Selection Balance may maintain the disease
genetic drift definition
leads to the loss of __?
amount of possible change in allele frequency is proportional to __?
the probability of fixation of an allele =
what does it create
how does genetic drift affect mean allele frequency?=
how does it affect heterozygosity
can produce what? (special name)
A change in allele frequencies across generations due to random error in the sampling of gametes
populations are not infinite
genetic drift leads to the loss of genetic variation within a population
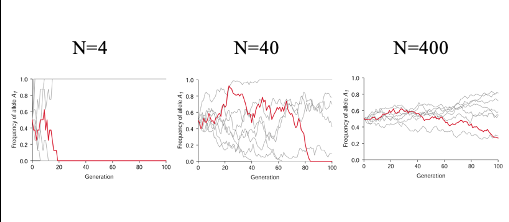
The amount of possible change in allele frequency per generation is proportional to the population size
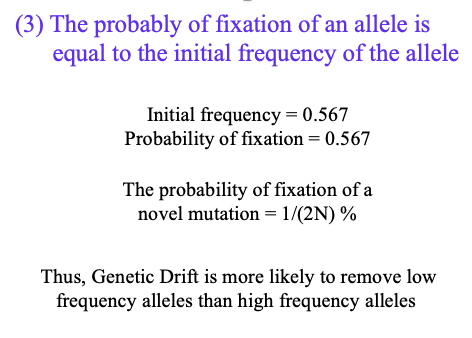
The probably of fixation of an allele is equal to the initial frequency of the allele
Genetic drift creates differences among populations
Genetic does not change the mean allele frequency among populations
Genetic drift lowers heterozygosity
Genetic Drift can produce “Founder Effects”
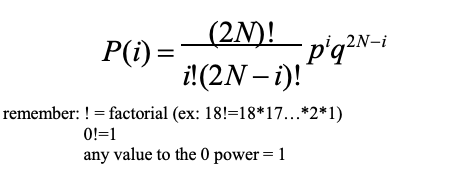
binomial distribution + equation
The discrete probability distribution of the number of successes in a sequence of N independent yes/no experiments (e.g., drawing an A allele or not), each of which yields success with probability p (freq. of the A allele) or failure with probability q (freq. of the a allele)
The number of ways of drawing i A alleles out of 2N draws
graphically how is the amount of possible change in allele frequency per generation is proportional to the population size shown?
The probability of fixation of a novel mutation =
genetic drift is more likely to remove ___
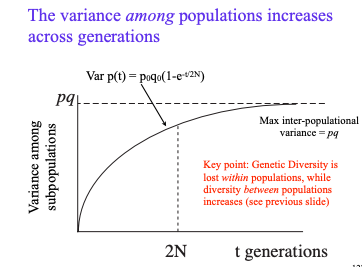
variance among population _ across generations
genetic diversity is __ within populations
genetic diversity ____ between populations
increases
diversity is lost within pops
diversity increases between pops
Missouri Ozark Mts
8000-4000 years ago: Desert!
4000- present: Savanna
Lizards live on rocky outcrops (“glades”) in the savanna (mixed woodland & grassland)
1950’s: Fire suppression
Red cedars invade the glades
Dense understory between glades
Result: populations small & isolated (no gene flow between them)
8 multi-locus genotypes
Most populations fixed for a single multi-locus genotype.
2/3rds of glades now contain no lizards
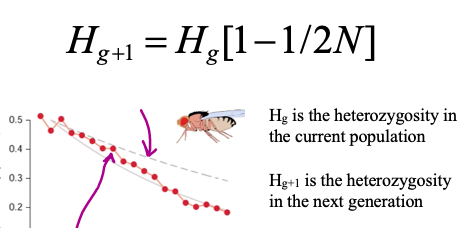
genetic drift and heterozygosity equation
genetic drift __ heterozygosity
Genetic drift lowers heterozygosity
The loss of heterozygosity is more pronounced in smaller populations
founder effect
Genetic Drift can produce “Founder Effects”
Founder effect: Change in allele frequencies that occurs during the establishment of a new population due to sampling error in drawing founders from the source population.
= a population bottleneck that results from colonization
= a form of genetic drift
Genetic Drift can produce “Founder Effects”
example of eye problems?
Pingelapese people of eastern Caroline Islands, ~2700 SW of Hawaii
Descended from 20 people in 1775, originally on Pingelap Atoll
1 individual heterozygous for loss-of-function allele for CNBG3 gene
When homozygous, this gene causes achromatopsia:
color blindness, extreme sensitivity to light, poor visual acuity
Among the Pingelapese, 1/20 have achromatopsia
Worldwide: 1/20,000 have achromatopsia
summary of genetic drift and what it leads to, affects, changes, creates 7
Genetic drift leads to the loss of genetic variation within a population
The amount of possible change in the gene frequency per generation in the population due to genetic drift is proportional to population size
The probably of fixation of an allele is equal to the initial frequency of the allele
Genetic drift creates differences among populations
On average, genetic drift does not change the mean allele frequency among populations
Genetic Drift lowers heterozygosity
Genetic Drift can produce “Founder Effects”
effective population size
Ne
The size of an idealized population in which the rate of genetic drift is the same as in the actual population
Ne is usually less than the census N
effective population size 3 main parts?
variation in the number of progeny
unequal number of males and females
variation in population size
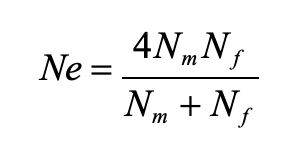
effective population size equation for unequal males and females
effective population size is highest when the Nm = Nf
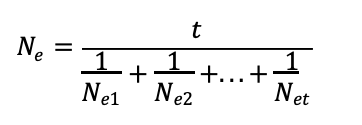
effective population size equation with variation in population size
Ne is the harmonic mean of the census population size through time
nonrandom mating
Nonrandom mating occurs when individuals mate assortatively, for instance, if large females are more likely to mate with large males and vice versa. Nonrandom mating is a violation of HW
inbreeding
a form of what? ___ homozygosity
the mating among genetic relatives, which is a form a nonrandom mating. Inbreeding is a problem in small populations and is a serious concern in conservation biology
increases homozygosity
Inbreeding & Nonrandom mating
related to gene + allele frequencies, the difference, homozygosity?
Genotype frequencies change, allele frequencies do not
With nonrandom mating, cannot predict genotype frequencies from allele frequencies (violates HW)
All nonrandom mating increases homozygosity
The difference: inbreeding impacts the entire genome, whereas mate choice only impacts the loci that influence mate choice (and loci genetically linked to them)
California Sea Otters - Enhydra lutris
wahlund effect?
Distributed from Alaska to Baja California
Over-hunted for their amazing fur: about 50 individuals left in 1911
Now >1500
There is an excess of homozygosity. This is consistent with inbreeding
Other violations of HW could be responsible; more studies needed for a definitive statement
What if two distinct populations are mixed into a single sample? You get the same signature as inbreeding: a deficit of heterozygotes, and an excess of homozygotes. This is called the Wahlund Effect
coefficient of inbreeding
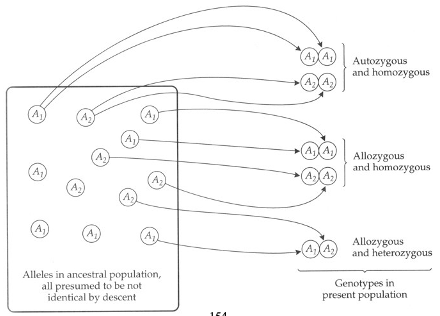
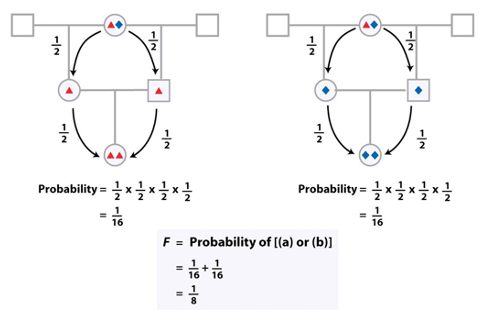
F = Coefficient of Inbreeding = the probability that two alleles are Identical by Descent (IBD): both copies descended from the same ancestral allele in an earlier generation. Alleles that are IBD are called autozygous
Inbreeding can be quantified as the reduction in heterozygosity
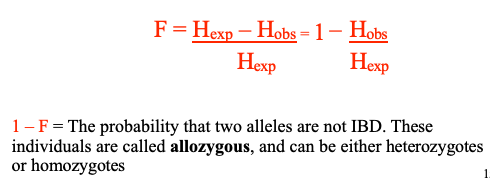
coefficient of inbreeding equation
when F>0, F=0,F=?
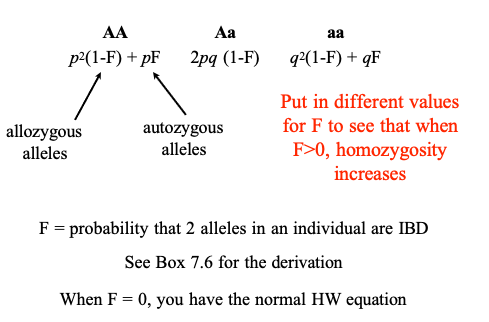
1 – F = The probability that two alleles are not IBD. These individuals are called allozygous, and can be either heterozygotes or homozygotes
when F>0, homozygosity increases
F = probability that 2 alleles in an individual are IBD
When F = 0, you have the normal HW equation
Homozygous vs. Heterozygous
Autozygous vs. Allozygous
calculating F from a pedigree
Genotype frequencies given inbreeding
AA,Aa,aa given p2+2pq+q2
inbreeding depression
By increasing the frequency of homozygotes, inbreeding increases the probability of homozygous deleterious, recessive alleles. For example, inbreeding increases the incidence of Cystic Fibrosis in humans
In captive populations (zoos), inbreeding is a serious problem.
In wild populations, inbreeding lowers the fitness of individuals and populations
Inbreeding is a big topic in conservation, because endangered populations are often small, which results in inbreeding. As if endangered species didn’t have enough problems...
inbreeding avoidance 4
Mate Choice
Dispersal from natal site
Self-incompatibility loci in plants
Management: move individuals between populations (=gene flow) to combat the decline in heterozygosity
migration = aka
gene flow
the movement of alleles between populations
gene flow violates HW
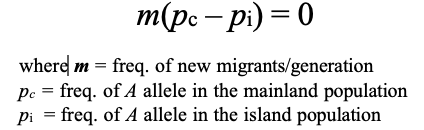
When will migration not change allele frequencies in a population? When the following equation = ??
how does migration change the allele frequencies
Thus: migration does not change the allele frequencies when m = 0 and when the frequency of the A allele is the same in both populations
impacts of gene flow on (1) populations (2) between populations (3) within populations
Gene flow homogenizes populations genetically
Gene flow decreases genetic variance between populations
Gene flow increases genetic variance within populations
difference between migration and genetic drift
The effect of Migration is opposite Genetic Drift
Gene flow and selection can work in opposite directions, as shown by the water snake example
GOOGLE:
Natural selection and genetic drift tend to enhance genetic differences among populations; migration tends to homogenize genetic difference, decreasing the differences among populations.
population structure def
due to 5
Population Structure: The presence of allele frequency differences among populations
Population structure is due to several evolutionary processes:
Natural Selection
Genetic Drift
Founder Effects
Gene Flow (migration)
Mutation
The most important consequence of population structure:
A reduction in the average heterozygosity relative to that expected if all the subpopulations were a single, randomly-mating population
Thus, population structure, like inbreeding, leads to a loss of heterozygosity (however, the loss is hypothetical in the case of population structure, and real in the case of inbreeding!)
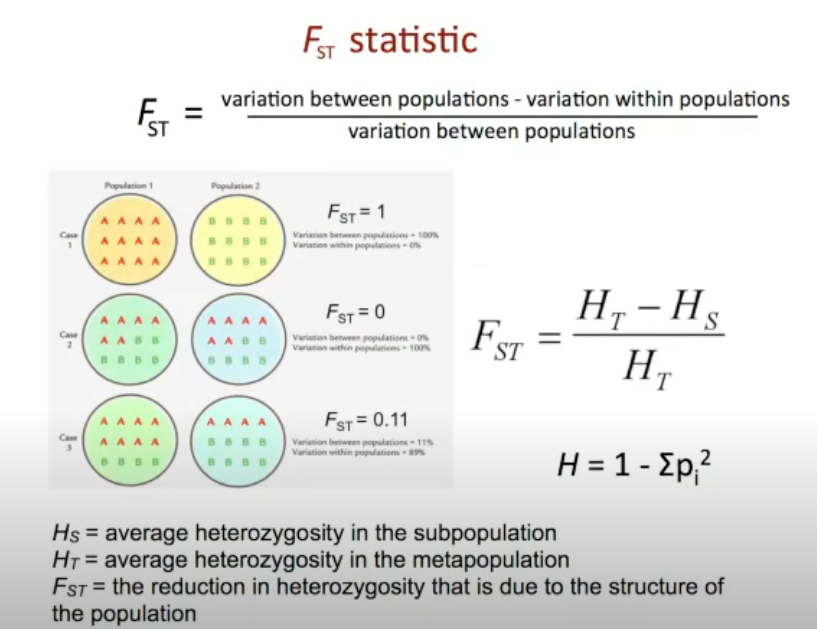
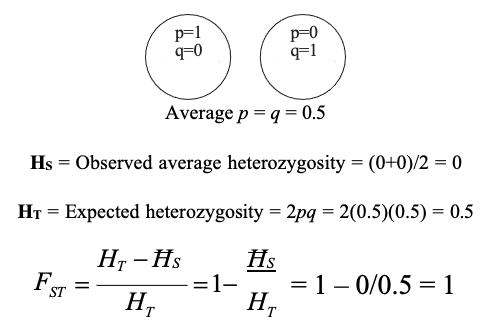
FST
FST is the proportion of the total genetic variance contained in a subpopulation (the S subscript) relative to the total genetic variance (the T subscript)
interpreting FST
0.00 - 0.05 = Little
0.05 - 0.15 = Moderate
0.15 – 0.25 = Great
0.25 – 1 = Very Great
genetic drift and population structure and Fst
Genetic Drift increases divergence among populations over time
Increase in Fst over time among populations as a consequence of genetic drift
migration (gene flow) and population structure
Migration (= gene flow) makes populations more similar to one another. In the absence of any other evolutionary processes, gene flow will completely homogenize subpopulations
Changes in allele frequency between two populations that are exchanging 10% of their individuals each generation (m = 0.10)
What is the balance between gene flow and genetic drift on population structure?
bro idk
Fst and Ne and m equation
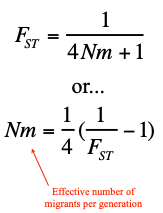
bro im lost on W7L1 slide 15
drift migration equilibrium
small amounts of migration between populations will minimize the loss of polymorphism and heterozygosity within subpopulations due to genetic drift, while allowing for divergence in allele frequencies among subpopulations
Quantitative Genetics
the investigation of continuously variable traits that are influenced by the combined effects of many loci as well as environmental factors
Two Schools of thought on variation
Late 1800’s to 1918
Biometrical School
Initiated by Darwin’s cousin, Francis Galton
Saw heritable variation as continuous
Existed before 1900
Maintained that Darwin’s idea of slight differences among individuals was the essence of evolution
Most naturalists and systematists belonged to this school
Mendelian School
Mostly laboratory geneticists
Viewed variation as discrete and sudden, not continuous
Most laboratory geneticists did not believe in evolution by natural selection: too slow & required too subtle variation
Some even dismissed continuous variation as heritable at all
Both schools right, both schools wrong
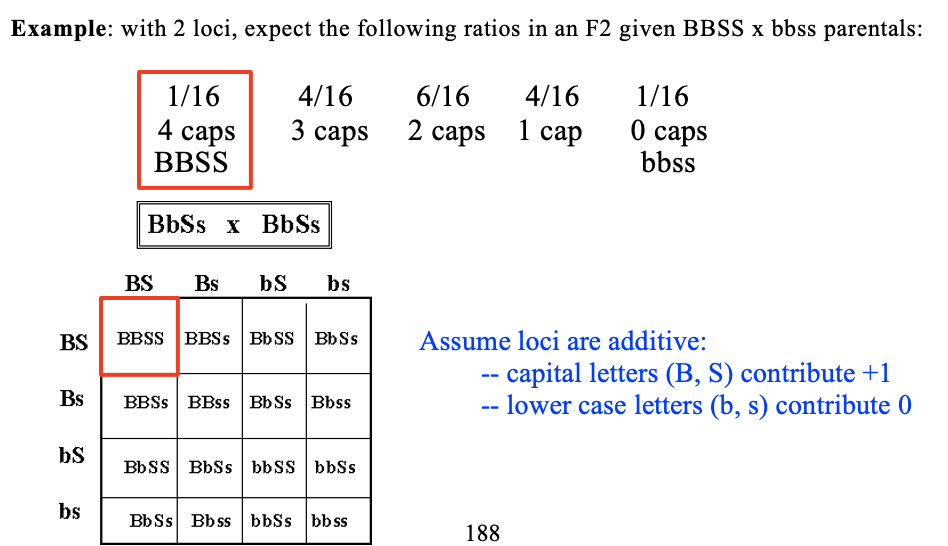
BbSs x BbSs
Fisher (1918) – Published a paper showing mathematically that many genes of small effect could produce biometrical variation. Landmark paper, as it united the Biometricians and the Mendelians.
Assume loci are additive:
capital letters (B, S) contribute +1
lower case letters (b, s) contribute 0
many loci =?
continuous variation
Logic: if continuous variation is composed of discrete units, then ..
the original phenotype should be recoverable
variance
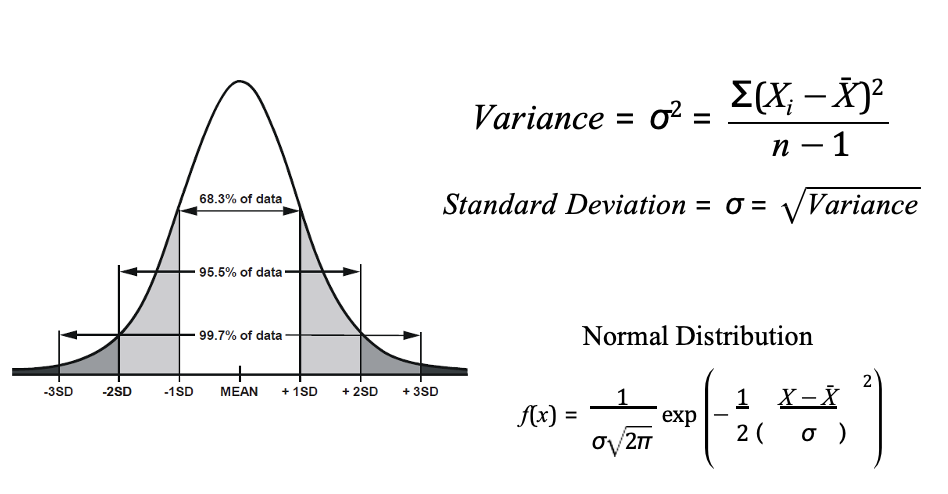
normal distribution is described by 2 parameters - mean and standard deviation
Variance is a measure of how data points differ from the mean
phenotypic variance Vp
Vp=Vg+Ve
Vg=Va+Vd+Vi
additive genetic variance, dominant, epistatic variance Vi, environmental variance Ve, genetic variance Vg
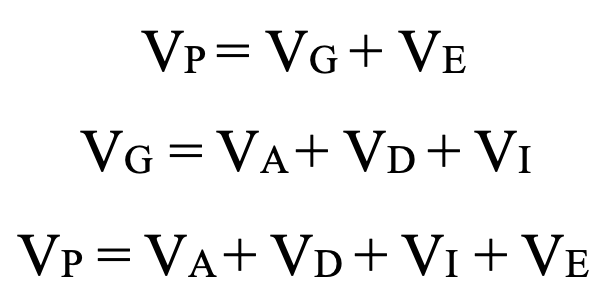
Additive Genetic Variance, Va
is due to what? almost completely responsible for ?
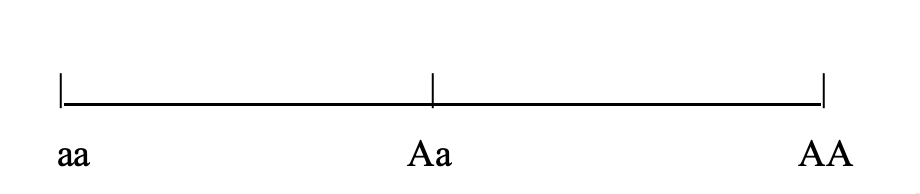
When the Phenotypic Value for a heterozygote is exactly intermediate between both homozygotes, the characters are said to be “additive”.
VA is due to the independent effects of alleles on a phenotype.
Additive genetic variance is almost completely responsible for heritable genetic variation
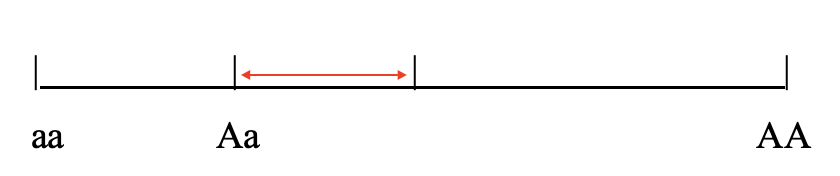
Dominance Variance, Vd
due to what? is it hertiable? why/why not
When Phenotypic Value deviates from additivity, this is called Dominance Variance, and it is due to interactions among alleles at a locus
Dominance effects are not transmitted directly from parent to offspring because only one allele is contributed by each parent
Epistatic Variance, Vi
due to? hertiability?
Epistatic variance is genetic variation due to interactions among loci.
Epistatic variance is not heritable variance because interactions among loci can’t be passed on to offspring due to independent assortment
Epistasis: The effect of the interaction between two or more loci on the phenotype whereby their joint effects differ from the sum of the loci taken separately
Epistasis is common...
epistasis
The effect of the interaction between two or more loci on the phenotype whereby their joint effects differ from the sum of the loci taken separately
Environmental variance
Differences among individuals in a population that are due to differences in the environments they have experienced