Biol 208: Lecture 24 - Ecological Communities
1/17
There's no tags or description
Looks like no tags are added yet.
Name | Mastery | Learn | Test | Matching | Spaced | Call with Kai |
|---|
No study sessions yet.
18 Terms
Community define
An association of interacting species inhabiting a defined area at a particular scare over a particular span of time
Guild, Life form + Functional groups.
Define + Examples
Which are used by animal researchers and which by plants?
Groups of association in Communities
Guild = species living in a similar way (eg. use the same resources) - Zooplankton
Used by Animal ecologists
Life form = species that have similar growth form (eg. trees, vines grass algae etc.)
Used by PLANT ecologists
Functional group = species with a similar ecological function or attribute eg. Trees, carnivores, herbivores, etc.
Used by both animal + plant ecologists
How communities are described:
what are the 3 attributes of a communities structure?
Which of the 3 is the most SPECIFC?
Relative abundance of species within a community
Number of species + diversity
Species composition (most specific)
Define Species ABUNDANCE:
3 ways it can be measured
When to use each type of measurement
give examples
Number of individuals (Count):
distinct entities eg. Bird (not useful for clonal organisms (like aspen)
Species cover (%):
Visual ESTIMATION. Quick + Less destructive But Less Precise
Individuals are not clearly distinguishable (Eg. algae + plants)
Species Biomass (mass/weight):
Quantifiable as FRESH or DRY. Slow + Destructive but precise
Individuals not Distinct or Countable
Species Dominance
How many species are dominant?
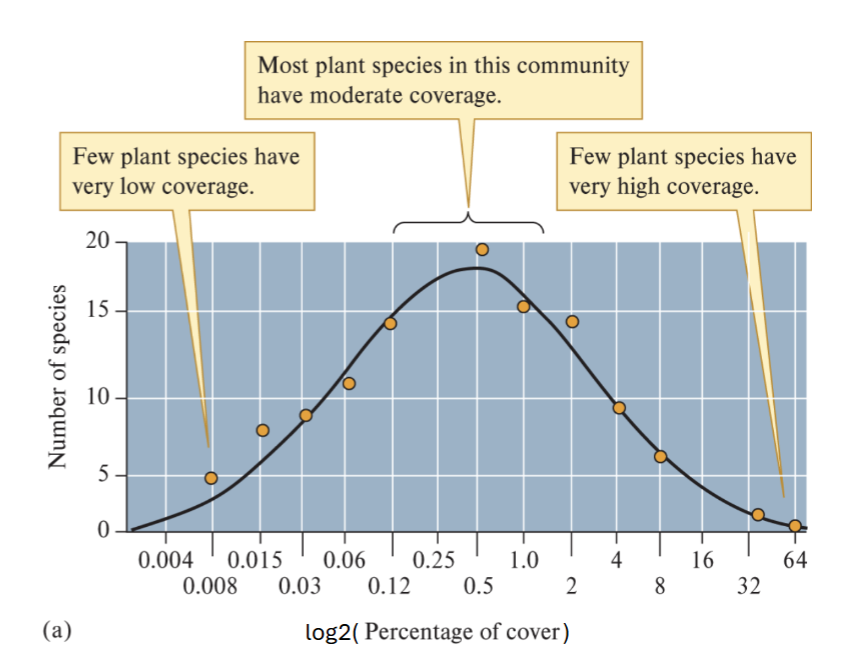
Species abundance distribution
Dominant species = one that is much more COMMON than others
Few species are Dominant or Rare
Most species occur in MODERATE abundance
Bell curve Distribution
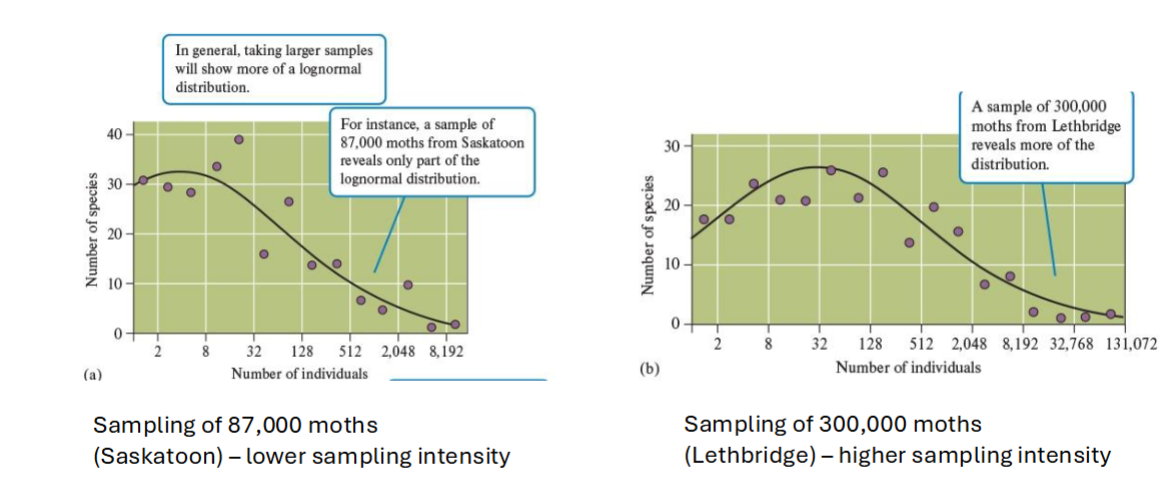
Are Abundance curves always ideal? Why?
NO
Depends on HOW MUCH YOU SAMPLE
Rare species are often overlooked → the more you sample the more likely you will find the rare species + the closer the abundance distribution will match the bell curve
Community structure #2: DIVERSITY
Species Diversity
Species richness
species Evenness
Define each
Diversity = a metric of community composition that combines species richness + species evenness
Richness = How many (number of) species in a community
Evenness: the relative abundance of species in a community
What type of community is more stable?
Diverse community
Three different scales of measuring species Diversity
Gamma = TOTAL diversity within a region or landscape (largest scale) eg. # of species in central parkland region of Alberta
Alpha = Diversity within a locality within a region or landscape eg. Number of species in a 20×20m plot in a forest
Beta = Measure of diversity AMONG locations within a region eg. compare B between a forest + a field patch
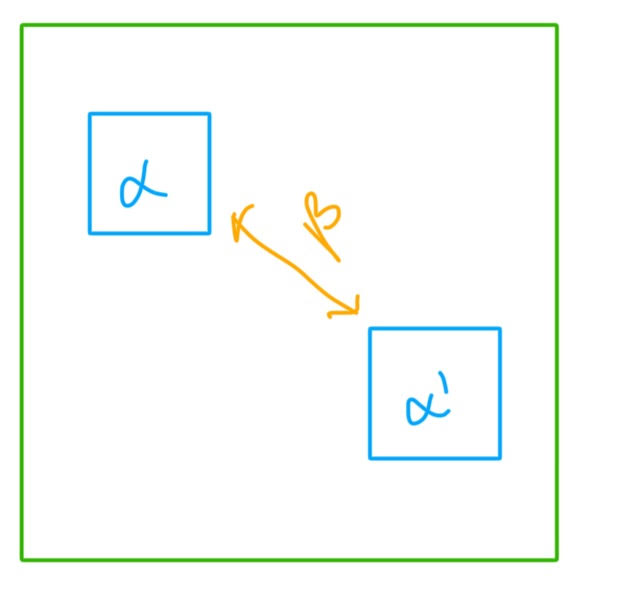
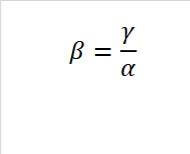
What does this equation represent?
How to compare + interpret Beta
Beta Diversity = measures species Richness
Diversity among locations within a region
Comparing diversity between Alpha’s
The more similar 2 different Beta are the lower the difference between the 2 locations
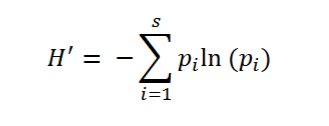
What does this equation represent/ what does it measure
what do all the symbols represent?
How to interpret?
Shannon Wiener diversity Index H’ = measures BOTH Richness + Evenness (takes evenness into account)
Pi = Proportion of species i
ln = natural log
s = number of species in community
The HIGHER the number the greater the diversity
What is the lowest H’ (Shannon wiener diversity) you can get? What does this mean?
0
= means only ONE SPECIES
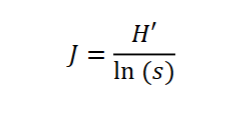
What does this equation represent/ what does it measure
what do all the symbols represent?
How to interpret?
Pielou’s J = Measuring JUST Evenness
H’ = Shannon wiener
ln(s) = natural log of species richness (total # of species)
Closer to 1 = More even
Closer to 0 = less even
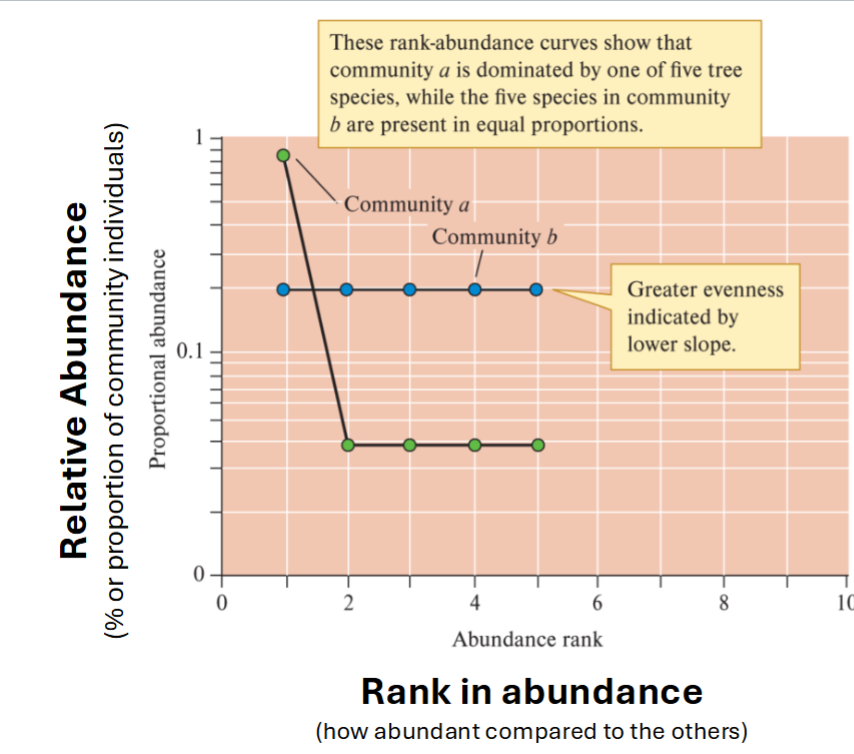
What is a Rank Abundance Curve?
How to interpret species evenness
How to interpret species richness?
Assessing evenness graphically
Plot of relative abundance of species against their rank in abundance (rank species based on abundance)
High Abundance is plotted on the LEFT side
Evenness = How FLAT the line is (more flat = more even)
Richness = How LONG the line is (more long = more rich)
What are 4 factors that Increase/Decrease Biodiversity?
Time: more uninterrupted time to evolve/colonize = more diversity
Complexity: More complex the environment = more diversity
Exploitation + Limitation: Limitations that decrease competition + increase biodiversity
Global Change: Pollution, habitat loss, invasive species = decrease diversity
Relationship between Environmental Complexity + species Diversity:
What is included in complexity
What does a homogenous vs. heterogenous environment look like?
More Complex/ heterogenous = more diversity
Complexity = Vertical structures (Trees), Water movement (current), nutrient, light etc. etc.
Homogenous = Few factors that influence organism → Few Niches
Heterogenous = Many factors that influence organism → Many Niches
Species Composition
Define
Importance
Composition = The species that occur in each community at a given time (WHAT TYPE/FLAVOURS OF SPECIES)
Changes and differences between communities are not only indicated by the number of species + the evenness of those species but the species themselves
Two communities can have the same species richness but different species composition.
Importance:
Species + species group identity influence ecosystem functioning
Composition can indicate shifts due to environmental or anthropogenic effects
Biotic Invaders
Define
Non-native/ invasive species that establish in new range + proliferate, spread + persist to the detriment of the environment
Shift in species COMPOSITION = alters community attributes + ecosystem processes