STAT 110 Exam 1
1/105
Earn XP
Name | Mastery | Learn | Test | Matching | Spaced | Call with Kai |
|---|
No analytics yet
Send a link to your students to track their progress
106 Terms
Variable
characteristic of an individual
categorical
places an individual into 1 or more categories
example of categorical variable
subject
ordinal
ordering, ranking of categorical variables
nominal
categories that cannot be ranked
example of ordinal variable
small, medium, large
example of nominal variable
math, English
quantitative variable
numerical values
discrete variable
counting
example of discrete variable
number of students in the class
continuous variable
data in a range
example of continuous variable
height
experimental study
applying treatments to subjects
explanatory variable
what is being manipulated
response variable
result of explanatory variable
observational study
observes individuals and measures variables of interest
are treatments applied in observational studies
no
can you determine cause and effect from an observational study
no
population
the entire collection from which we want data
example of a population
the entire United States
census
study that includes everyone in the population
sample
subset of the population that is actually surveyed
sampling method
way a sample is selected from the population
convenience sampling
sampling individuals that are easy to reach
voluntary sampling
sample chooses itself by responding to a general appeal
_ are the 2 biased methods of sampling
convenience and voluntary sampling
simple random sampling
method in which each individual has an equal chance of being selected
example of simple random sampling
drawing numbers out of a hat
random digits table
method of random sampling
stratified random sampling
taking an srs from strata to form a complete sample
strata
similar groups
cluster sampling
divide samples into clusters, pick a cluster, sample everyone in those clusters
cluster example
New York, South Carolina, and Arizona. sample is United States
systematic sampling
selecting individuals at a regular interval
p
proportion of the population
x
number of individuals in the sample who are in a specified category
n
sample size
p hat
proportion of sample who agree
bias
systematically favoring a certain outcome/individual
something is biased when…
the true population value is over/under estimated
ways to reduce bias
randomization, replication, control
randomization
using srs and blinding
replication
repeating the process over many subjects
control
having a placebo or group that does not receive treatment
voluntary response bias
people with strong opinions are more likely to participate
self-interest bias
people with a stake in outcome have an incentive to use biased methods
leading question bias
questions are worded in a way that prompt a response
non-response bias
certain proportion of the population do not respond
non responders
people who do not give an answer
sampling bias
some members of the populations are more likely to be included
example of sampling bias
convenience sampling
social acceptability bias
people are reluctant to be truthful bc they do not want answers to be reflected onto them
variability
how observations vary person to person within the sample
sampling variability
describes how sampling methods will vary when an experiment is repeated
sampling distribution
spread of values taken in sample
larger sample = _ variability
less
which is more accurate: large or small sample?
larger sample
population should be _ times larger than sample
20
parameters describe a
population
statistic describes
sample
statistical significant
difference in average response among treatment groups is large enough that it is likely not chance
confidence statements describe
probability the statement given is true
confidence level
what percentage of all possible samples satisfy the margin of error
margin of error
value that accounts for error
a larger margin of error means
there is more uncertainty
margin of error formula
1 / sqrt n
sample proportion ( p hat) formula
= count of successes / n (sample size)
what level of confidence should be used in a confidence statement
95%
sampling frame
list of individuals the sample draws from
mean (p)
average of all the samples proportion
standard deviation
how dispersed data is relevant to the mean
standard deviation formula
sqrt P (1-P) / n
shape
shows variation in sample
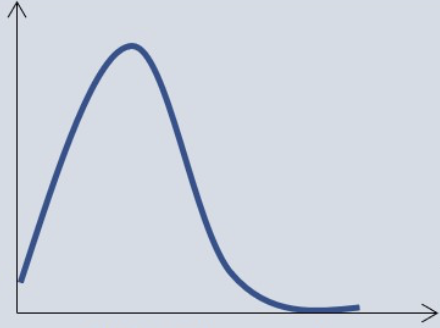
shape of this graph
skewed right
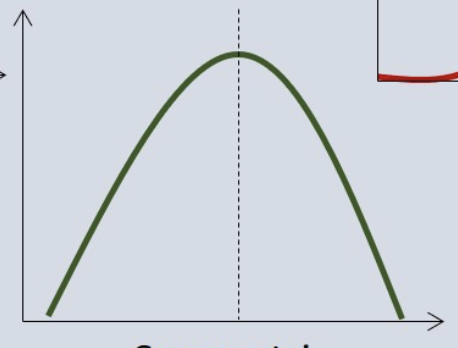
shape of this graph
normal curve
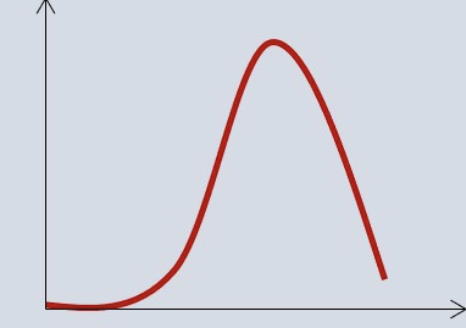
shape of this graph
skewed left
confidence interval formula
p-hat ± z (sqrt p-hat (1- p-hat) / n)
sampling errors
errors that occur during sampling
random error
deviation between statistic and parameter
frame error
not complete representation of population
undercoverage (sampling error)
excludes people via biased sample methods
incomplete sample (sampling error)
excludes certain people from the population
non sampling error
errors that occur aside from sampling
response error
subject gives a false answer
lurking variable
variable not studied has effect on the relationship among variables in the study
ex: study on effects of diet on blood pressure, but patient smokes
lurking variable
confounding variable
2 variables effect on response cannot be distinguished
ex: effect of kids iq on reading level, not considering socioeconomic status
confounding variable
experimental design
the way a study is set up
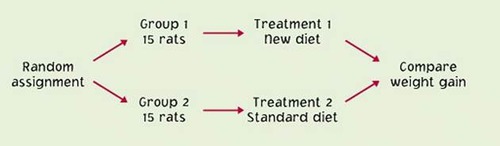
randomized comparative experiment
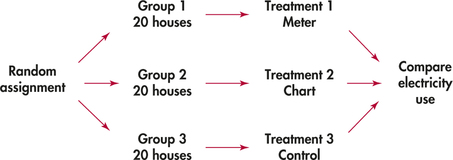
completely randomized design
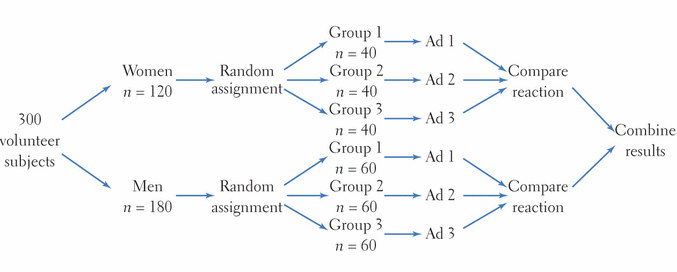
randomized block
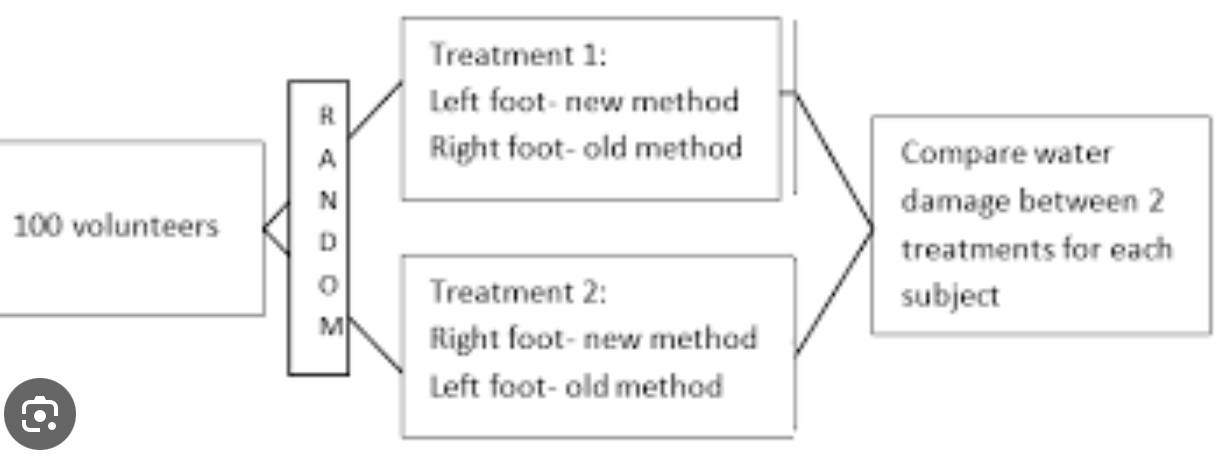
matched pairs
clinical trials
medical experiments
number of subjects in phase 1
20-80
determinants from phase 1
safety, safe dosage, side effects
number of subjects in phase 2
100-300
determinants from phase 2
is it effective, evaluate safety of drug
number of subjects in phase 3
1,000-3,000
determinants from phase 3
confirm effectiveness, side effects, compare to other drugs, determine safety