ECON 2020 Exam 1
1/151
There's no tags or description
Looks like no tags are added yet.
Name | Mastery | Learn | Test | Matching | Spaced | Call with Kai |
|---|
No analytics yet
Send a link to your students to track their progress
152 Terms
scarcity
economic resources are constrained (natural, labor, capital)
Thomas Sowell: Conflicts of Visions
unconstrained: sufficient resources exist to satisfy desires
constrained: limited resources can't satisfy all desires
trade
voluntary exchange
Four Properties of Trade
1. Trade helps both sides
2. Trade creates value
3. Trade is a positive sum game
4. Trade encourages diverse interactions
zero-sum games
- winner takes all
- loser gets nothing
life has many zero-sum games
ex: sports games
Rabbi Jonathan Sacks
"It is through trade that difference becomes a blessing, not a curse."
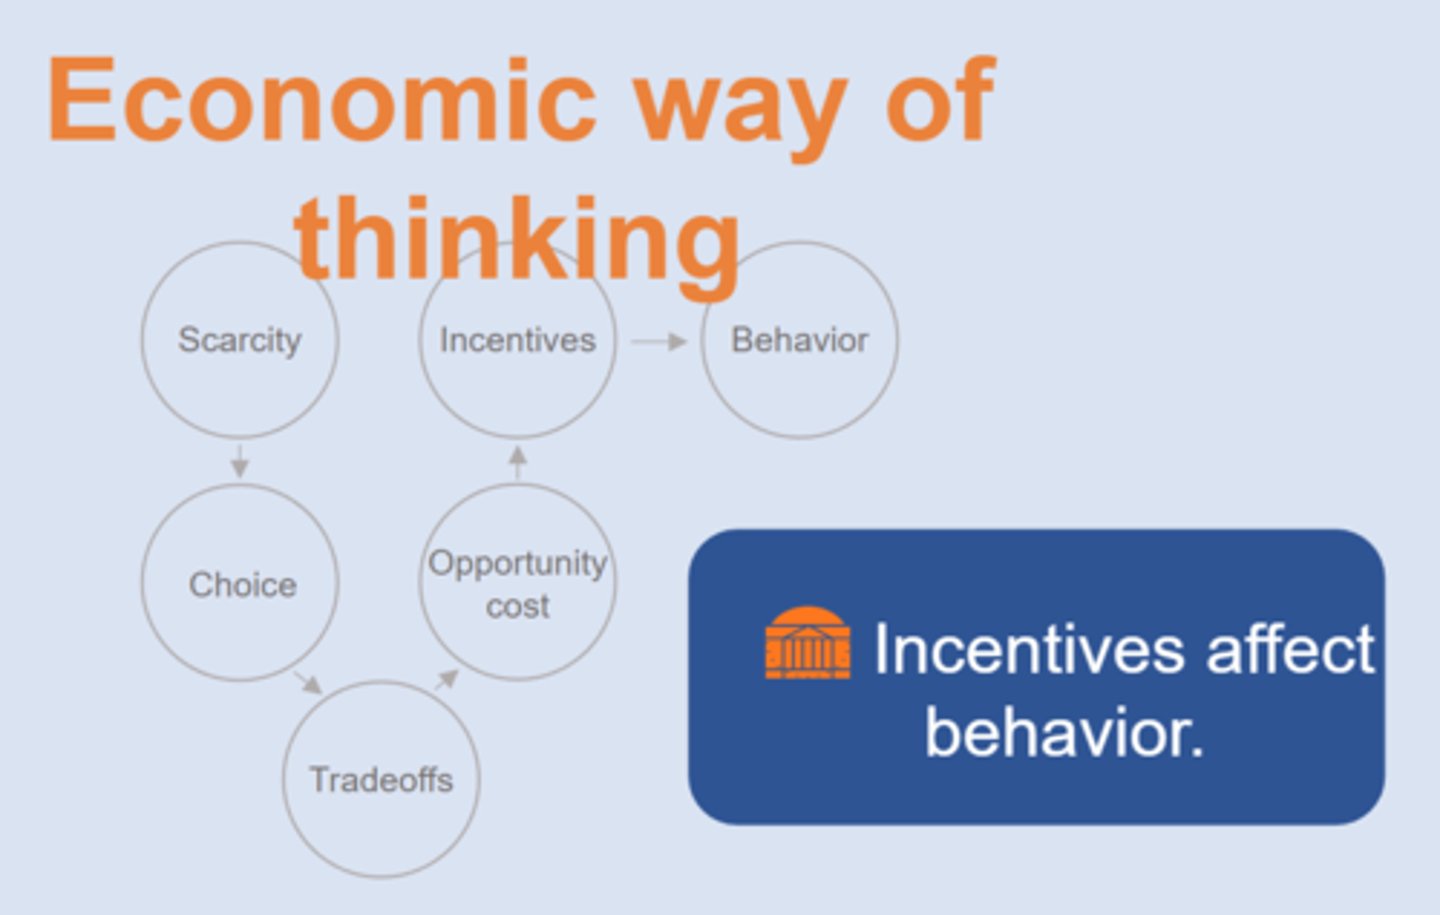
Rotunda Principles
1. Trade creates value (voluntary exchange makes both sides better off)
2. Incentives affect behavior
positive science vs. normative science
positive science = "what is"
normative science = "what should be"
Production Possibilities Frontier
combinations of outputs where resources are used efficiently
ON curve ==> efficient
OVER ==> impossible
UNDER ==> inefficient
- slope is opportunity cost
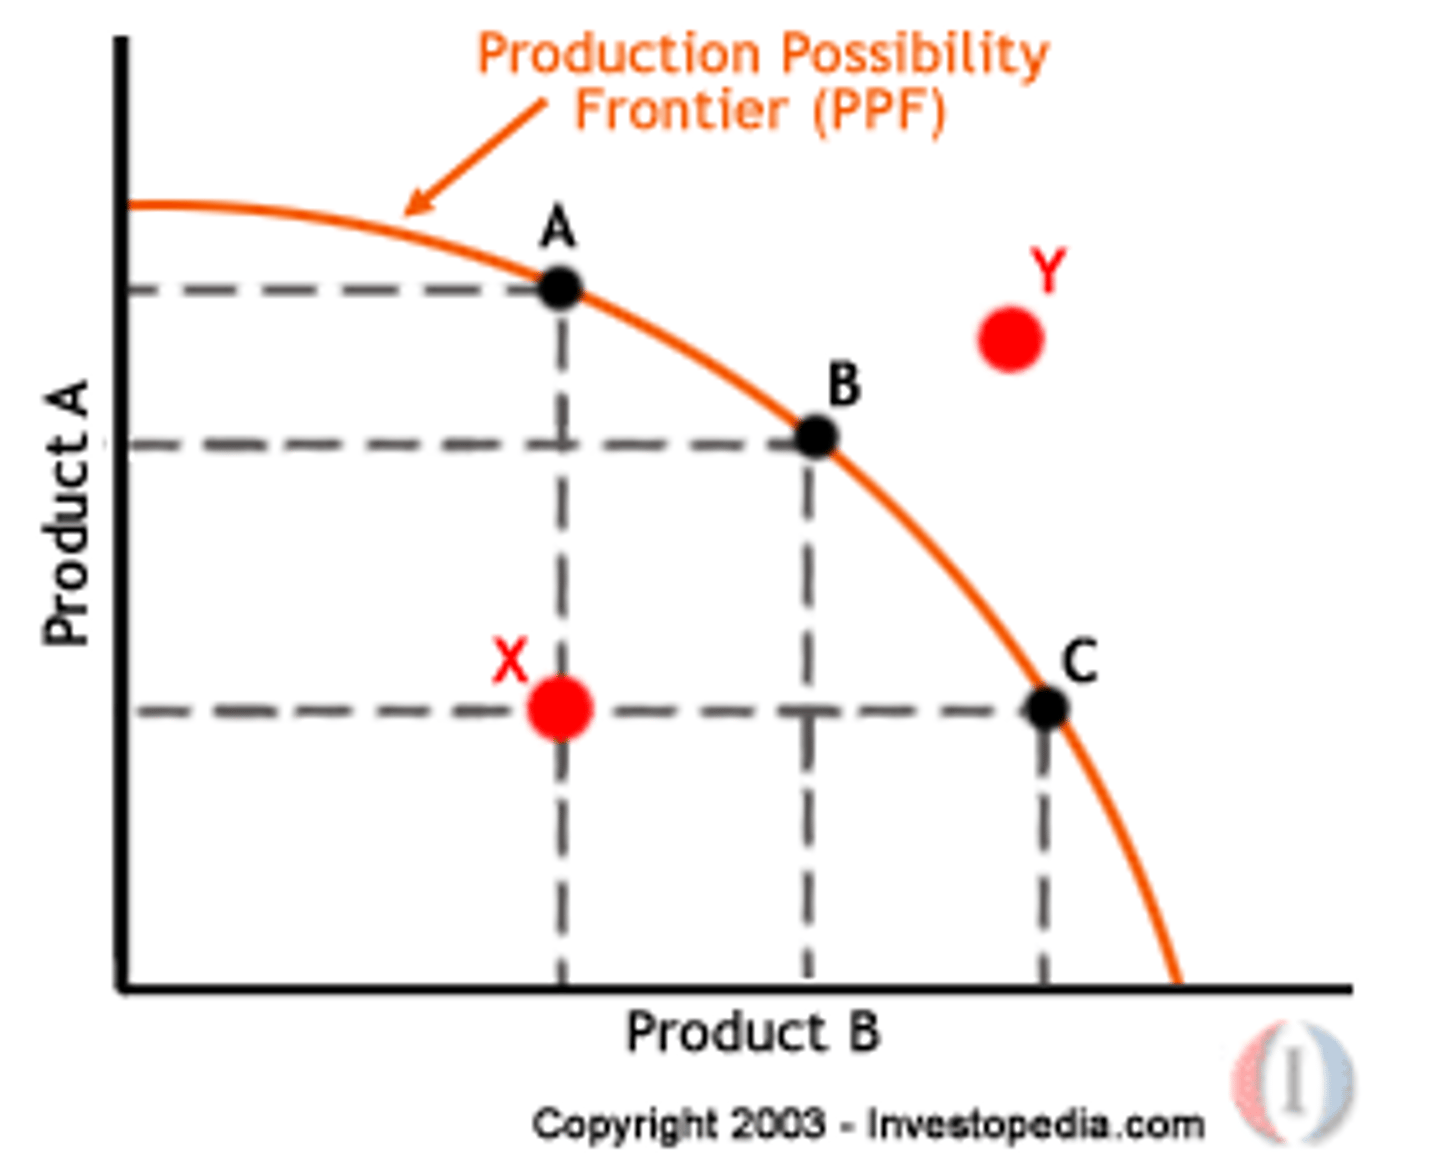
Law of Increasing Opportunity Cost
- bowed outward because opportunity cost of a good increases as you produce more of it
Shifts in PPF
- whole thing shifts outward (x & y) ==> more/less resources (more capital investment can lead to outward shift in LR)
- biased shift ==> new tech/productivity/inputs
comparative advantage
producing @ a lower opportunity cost than a competitor ==> allows for specialization
specialization
limiting one's work to a specific area
==> encourages trade
absolute advantage
producers ability to create more than another producer w/ same Q of resources
When is trade mutually beneficial?
when the exchange ratio falls between the parties opportunity cost ratio
consumer goods vs capital goods
consumer = present consumption
capital = help produce other goods
investment
process of using resources to create/produce new capital
market vs planned economy
market (trade) ======> socialism (gov. decides)
US --------Argentina---------------------------North Korea
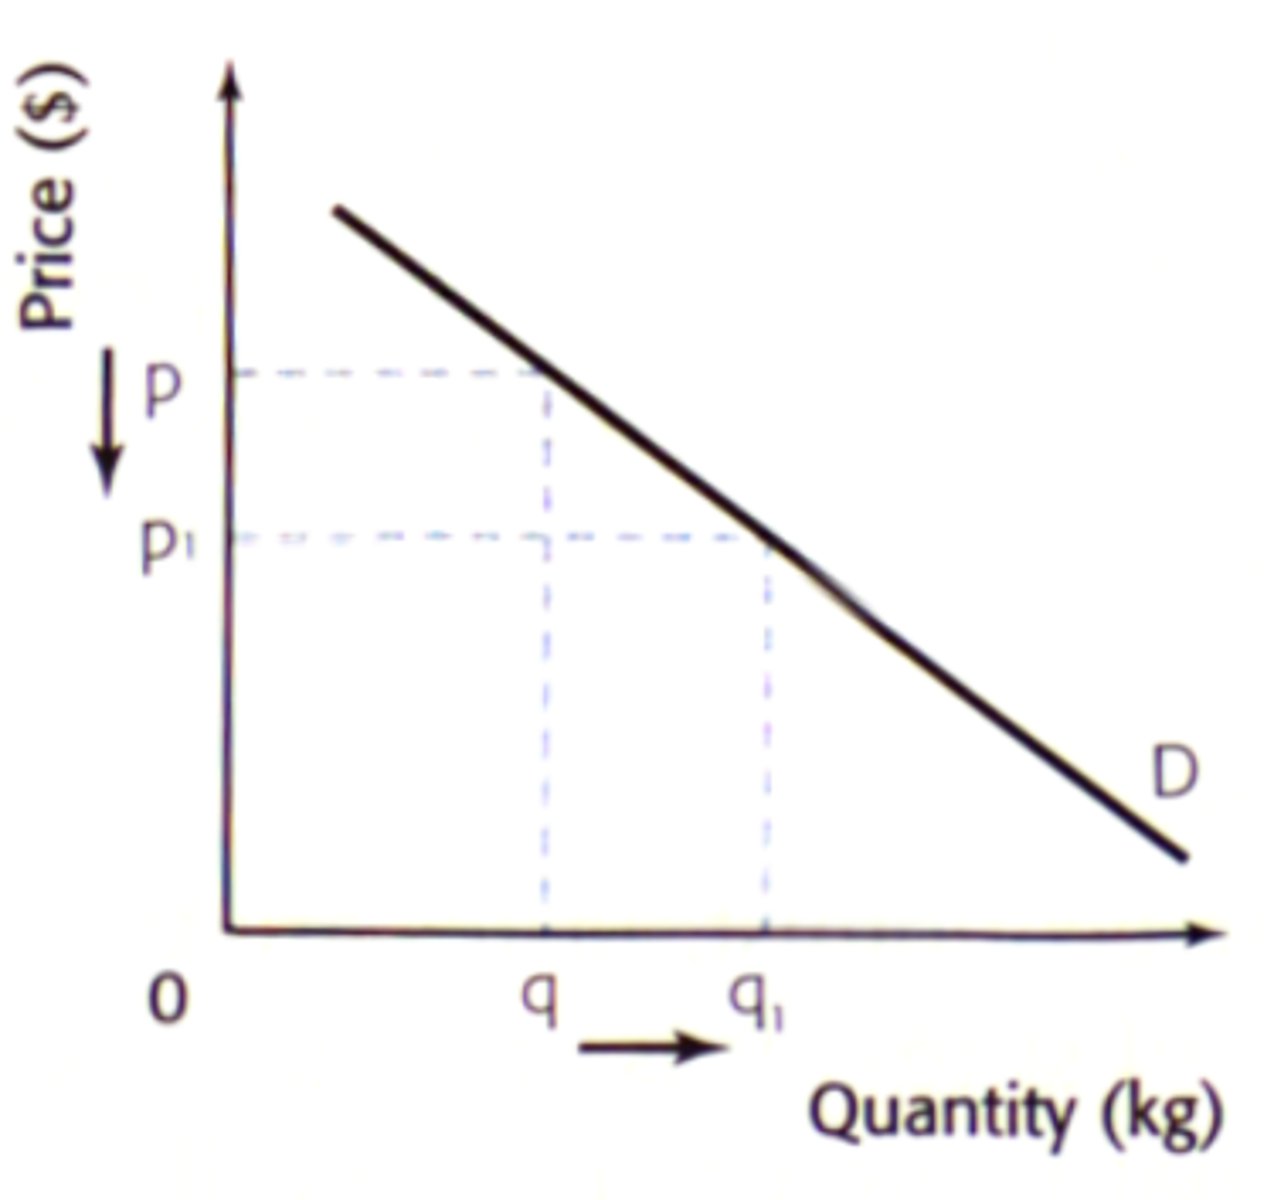
Law of Demand
quantity demanded increases, as price decreases
market demand ==> sum of ind. d curves
competitive market
so many buyers & sellers that each individual firm doesn't have control over price ==> similar goods & participants
imperfect market
buyer & seller can influence price (market power)
monopoly
single supplier for entire market
purchasing power
how income affects how much you can afford
normal good
Qd ⬆️as income ⬆️
inferior good
Qd ⬇️ as income⬆️
complement good
goods or services that are used together
a decrease in the price for one good will increase the quantity demanded for the other good
substitute good
can be used in place of each other.
a decrease in the price for one good will decrease the demand for the other product
subsidy
payment from the gov to shift demand of a product
ex: tax break
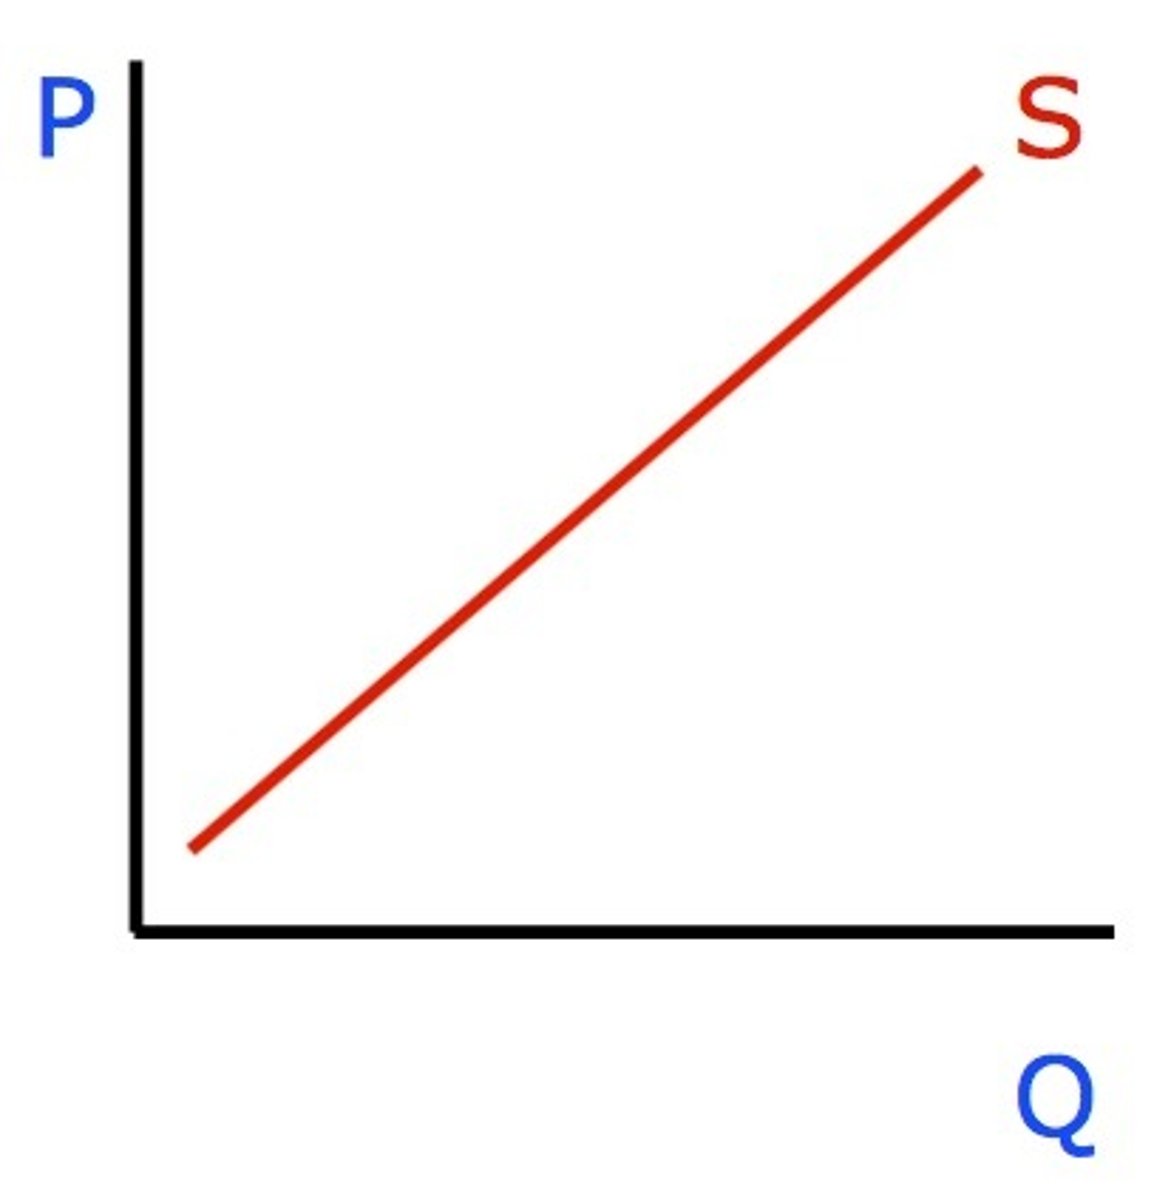
Law of Supply
as price increases, quantitsy supplied increases
market supply: sum of ind quantities from each seller
Does the law of demand apply to necessities like gasoline?
yes (NOT inelastic)! incentives affect behavior and people will shift their choices, price of gasoline increase ==> carpooling, walking, etc.
Will the supply of gasoline ever run out?
No.... the price will increase, people will find more known oil reserves over time
Equilibrium
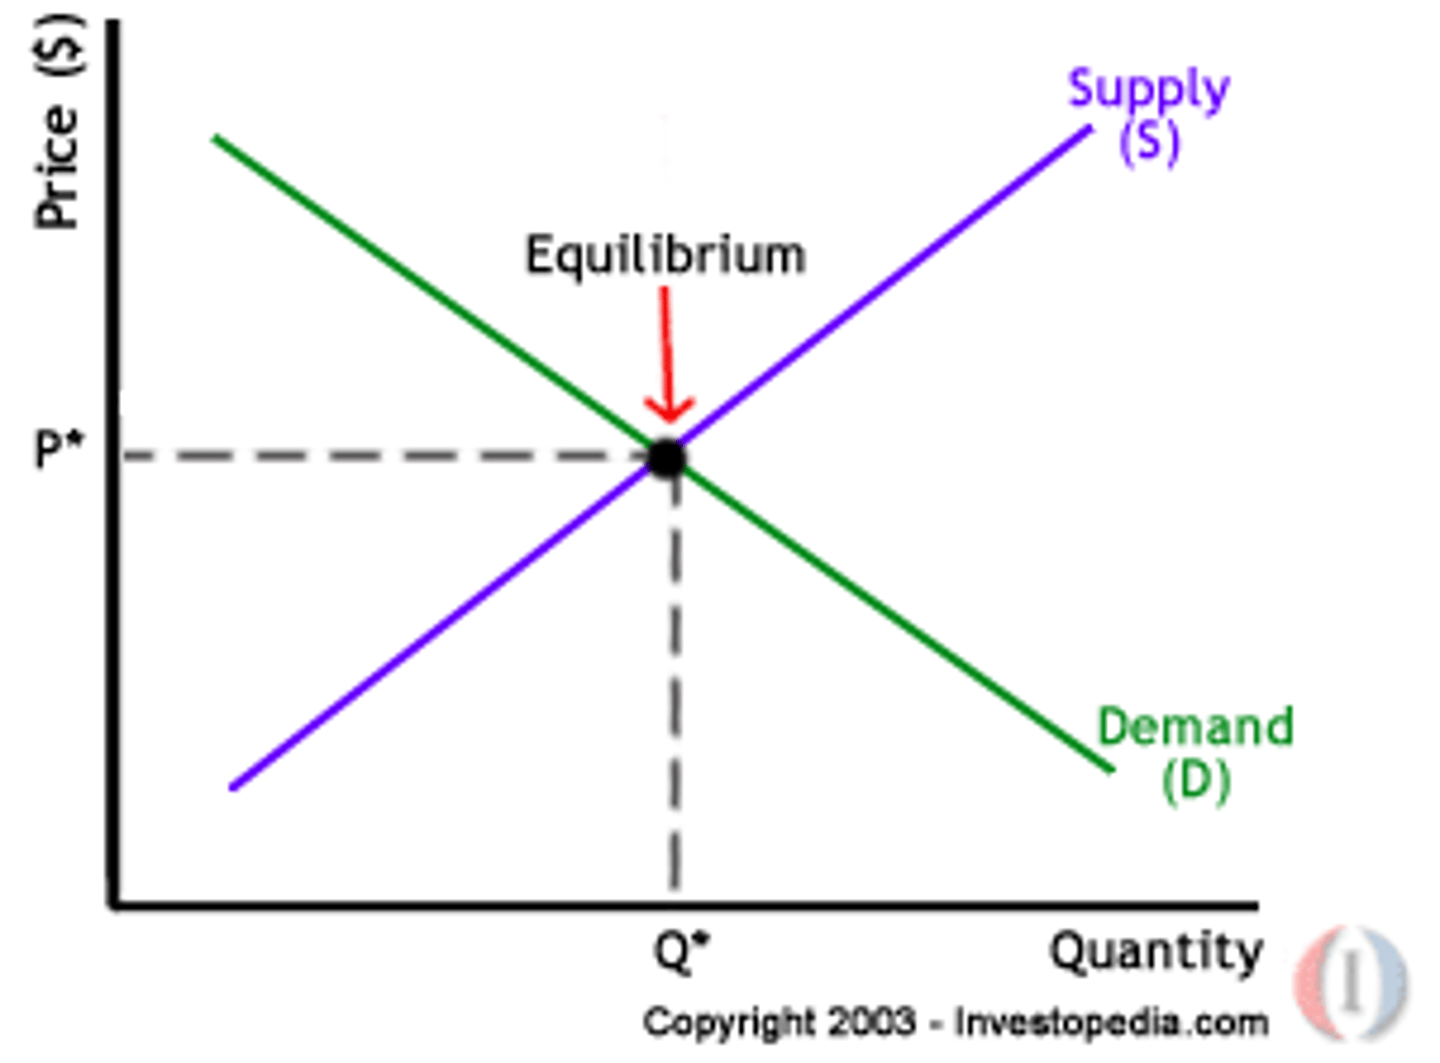
Economic Way of Thinking
prices are....
signals
Argentina Example
- exports soy & beef
- fields or factories
- become more of a market economy recently
Bird Flu....
reduced supply, higher prices
Gross National Product (GNP)
output produced by workers and resources owned by residents of the nation
ex: Nike in Thailand ==> US bc owners of Nike are US
GDP
gross domestic product: the market value of final goods and services produced in a country in a year
measures...
= output = income
How to earn income in a market system?
produce GDP that others value and will trade for
How to use GDP data?
1. living standards
- higher GDP ==> more output ==> more income
- GDP per capita
2. economic growth
- measured in growth rate (% change) of real GDP per capita
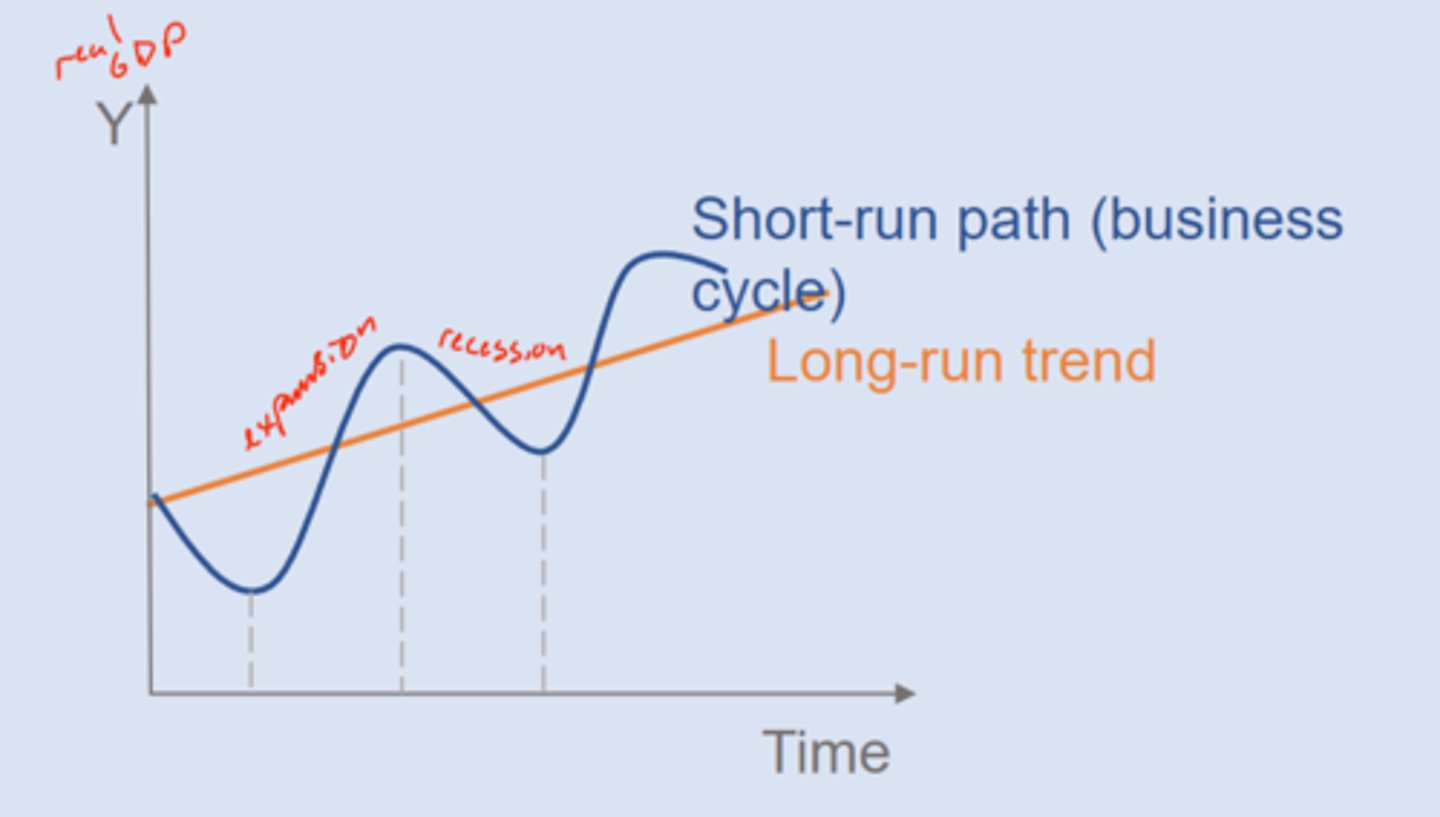
3. business cycles
- short run fluctuations where real GDP increases or decreases
- recessions (contractions) and expansions
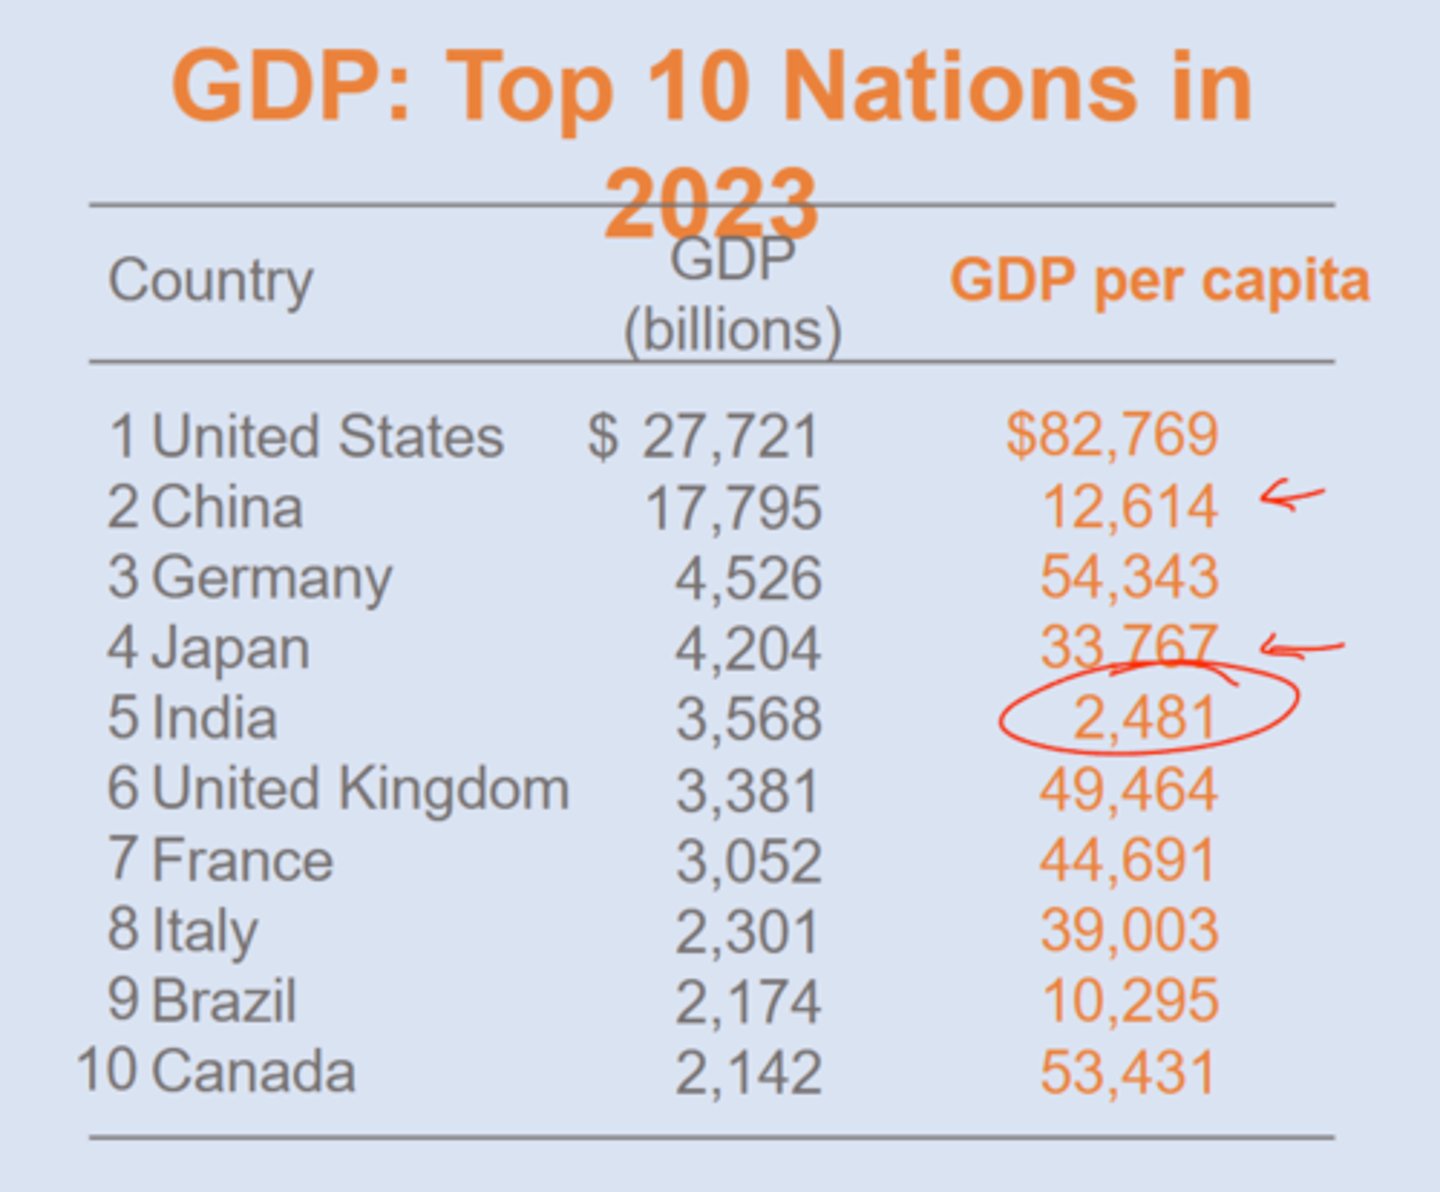
GDP per capita
GDP / population
(thing avg persons income)
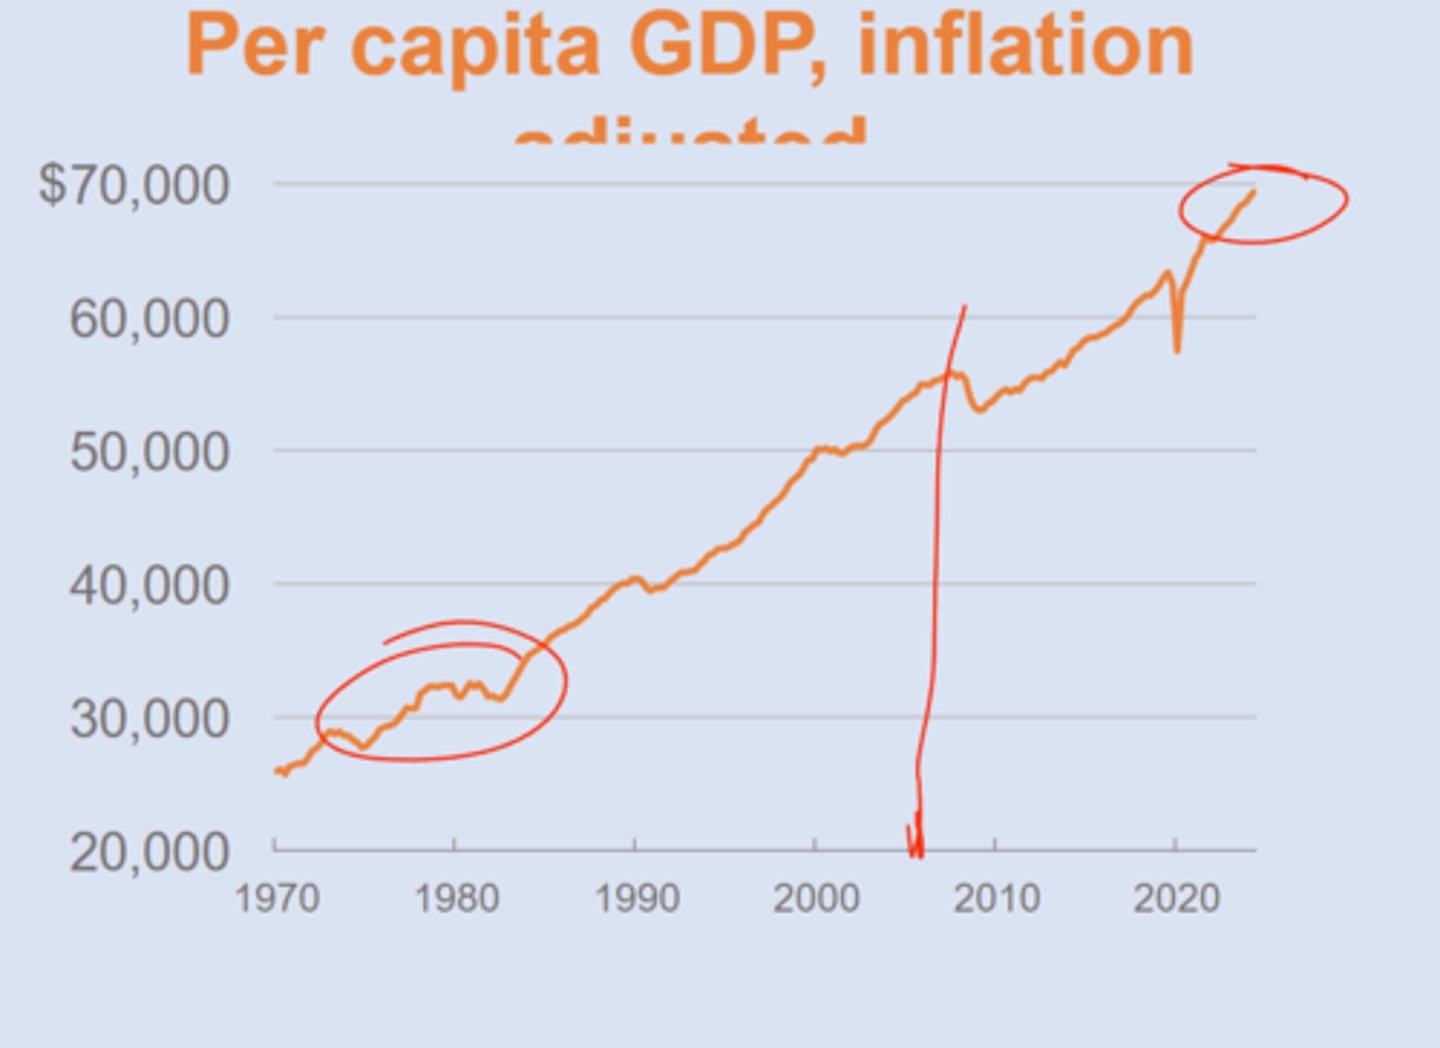
real GDP per capital
GDP adjusted for inflation and population size
recession
short run economic downturn, decrease in real GDP
market value
the amount the goods and services sell for, or what they are worth in a market.
==> P (price) x quantity
final goods
products that are purchased by their end users
intermediate goods
goods used in the production of final goods
services
output that provide benefits w/o tangible products
ex: doctor, accountant, broker
==> greater consumption is spent on services than in past (.42 in 1950 to .64 now)
Is it included in GDP?
- goods produced but not sold ✅
- used goods sold❌
- financial assets sold❌
- brokerage fees ✅
Top 10 Nations GDP and GDP per capita
per capita real GDP Historical Trend
USA
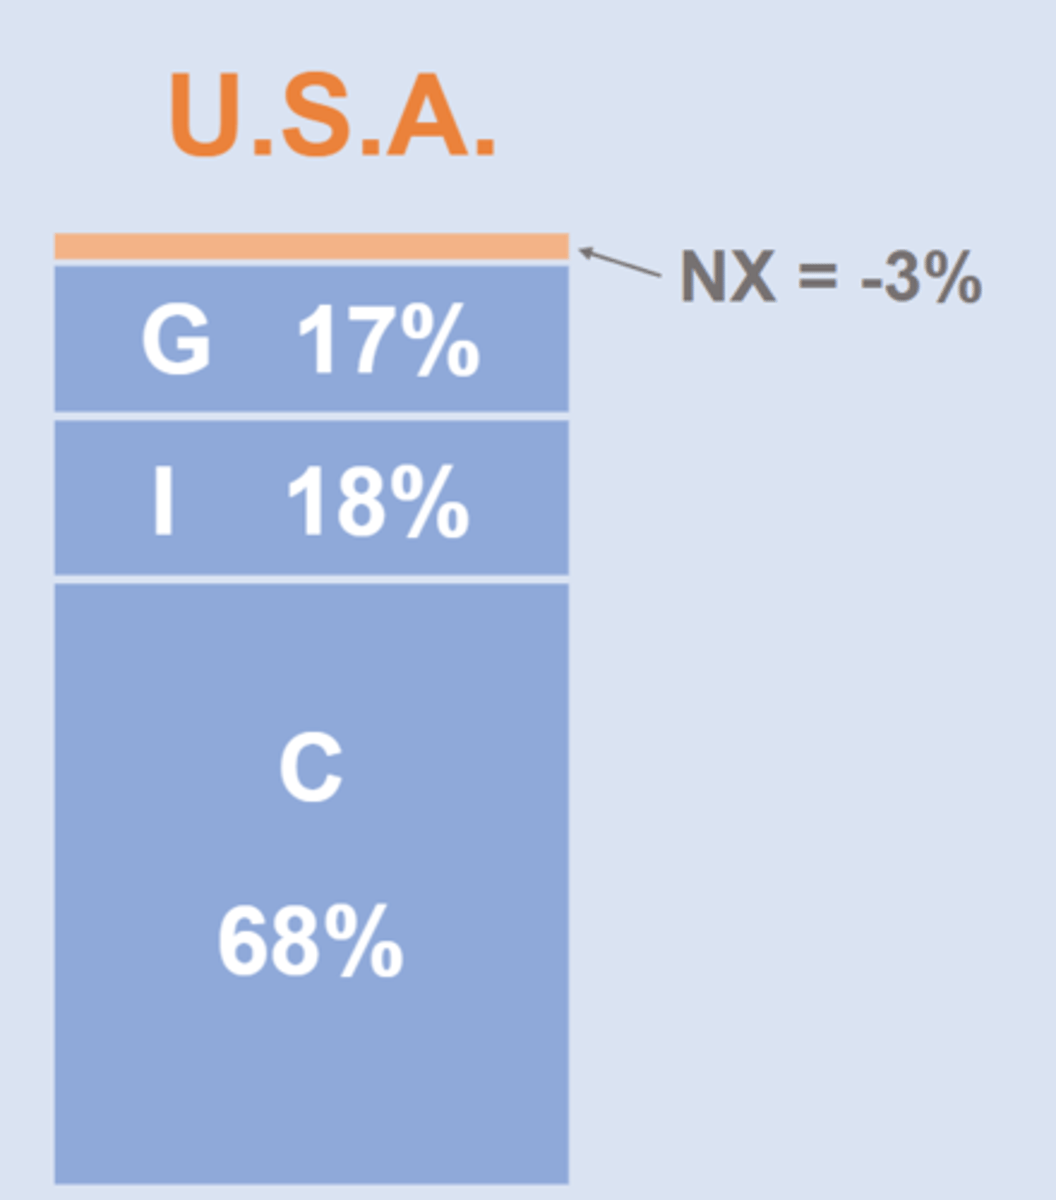
Four Pieces of GDP
C + I + G + NX = Y
consumption, investment, government spending, net exports
consumption
private spending (goods/services)
==> non-durable goods (short-term, purchase regardless of recession)
==> durable goods (long-term, hold off in recession)
investment
spending on capital for future GDP/output
government
spending by local, state, national, federal governments
ex: public projects
NOT transfer payments (SS, unemplyment)
net exports
exports - imports
imports are negative because we consume them in other categories
US GDP makeup
GDP equation
sum(pxq)
nominal GDP
raw GDP data, not adjusted for inflation, "current dollars"
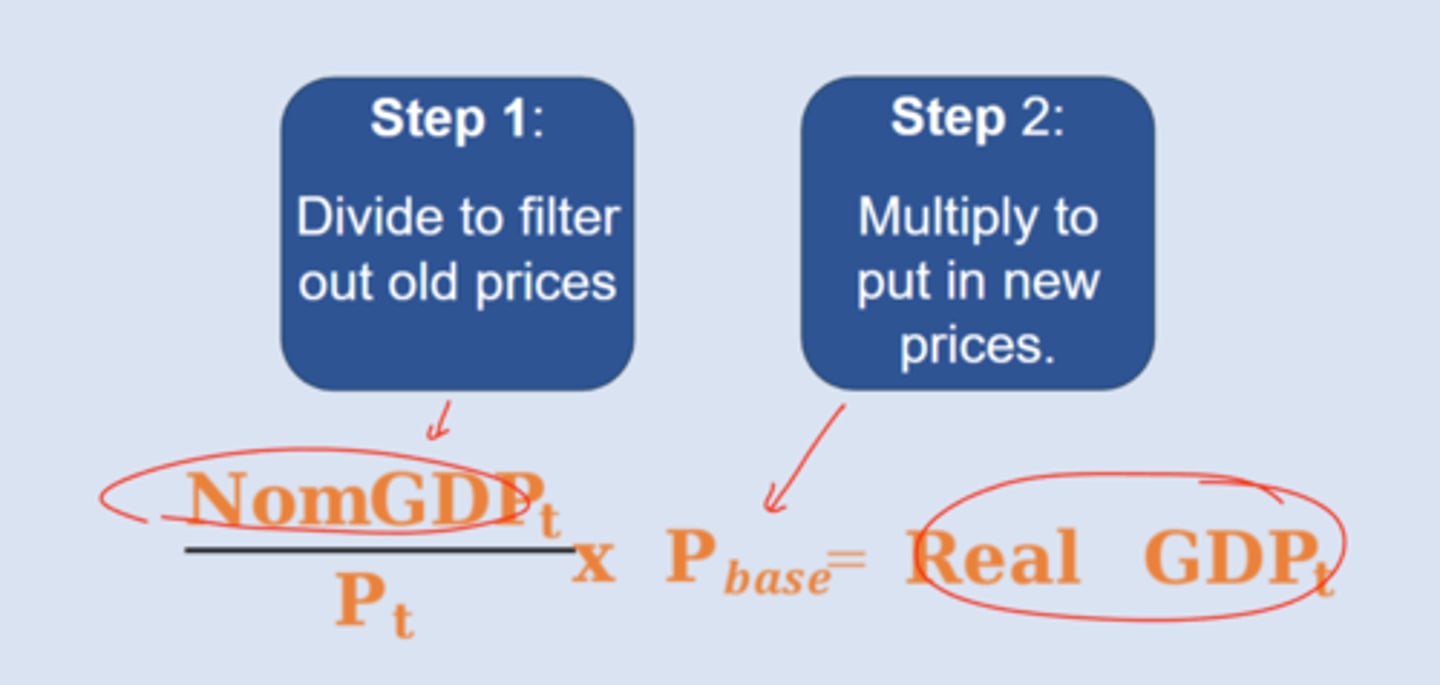
real GDP
GDP data adjusted for inflation, "constant dollars"
price level
index measure of overall prices for all relevant goods and services in the economy
"GDP deflator"
steps for computing real GDP
Growth Rate GDP equation
growth of nominal GDP = growth of real GDP + growth of price level
%△ nominal GDP =%△ real GDP + %△ price level
GDP omissions
1. non-market output
==> household/volunteer work
==> biases GDP down
2. underground activity
==> illegal goods, tips ==> biases GDP down
3. leisure time
==> biases GDP down
4. environmental costs
==> biases GDP data up
is GDP really a measure of welfare?
- within-nations ==> wealthier people show more satisfaction than poor income nations
- across nations ==> wealthier > poorer satisfaction
- Easterlin paradox (income increases happiness but only to a point) ==> NOT TRUE
Higher income...
offer more opportunities to pursue happiness
South Korea
- real per capita GDP growing fast (5.5%)
- BTS
- Pres arrested
unemployment rate (u) (U-3)
% of the labor force that is unemployed
==> 4% in US
labor force
people who are employed or actively seeking work & part of eligible population
==> note: includes part-time
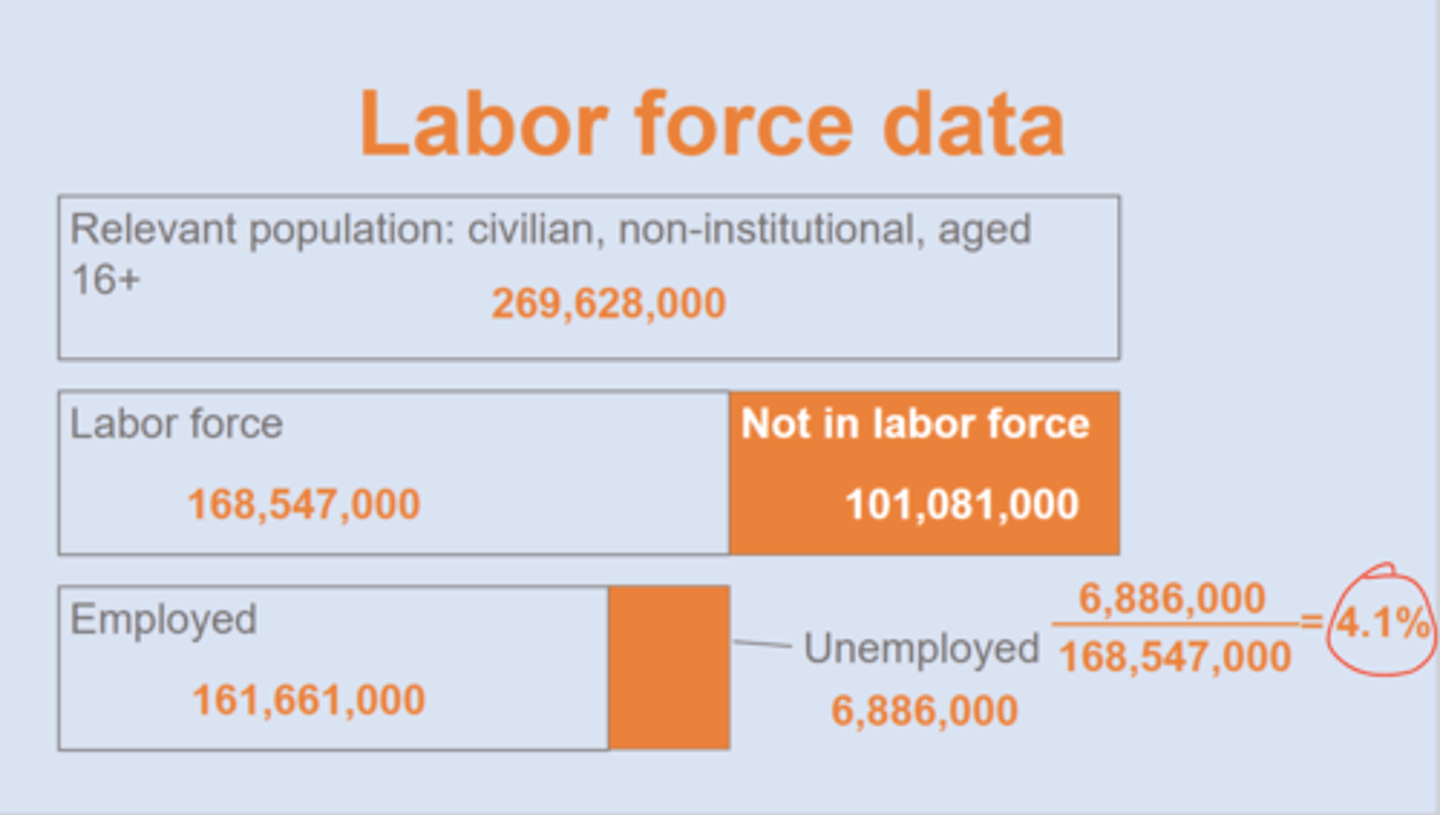
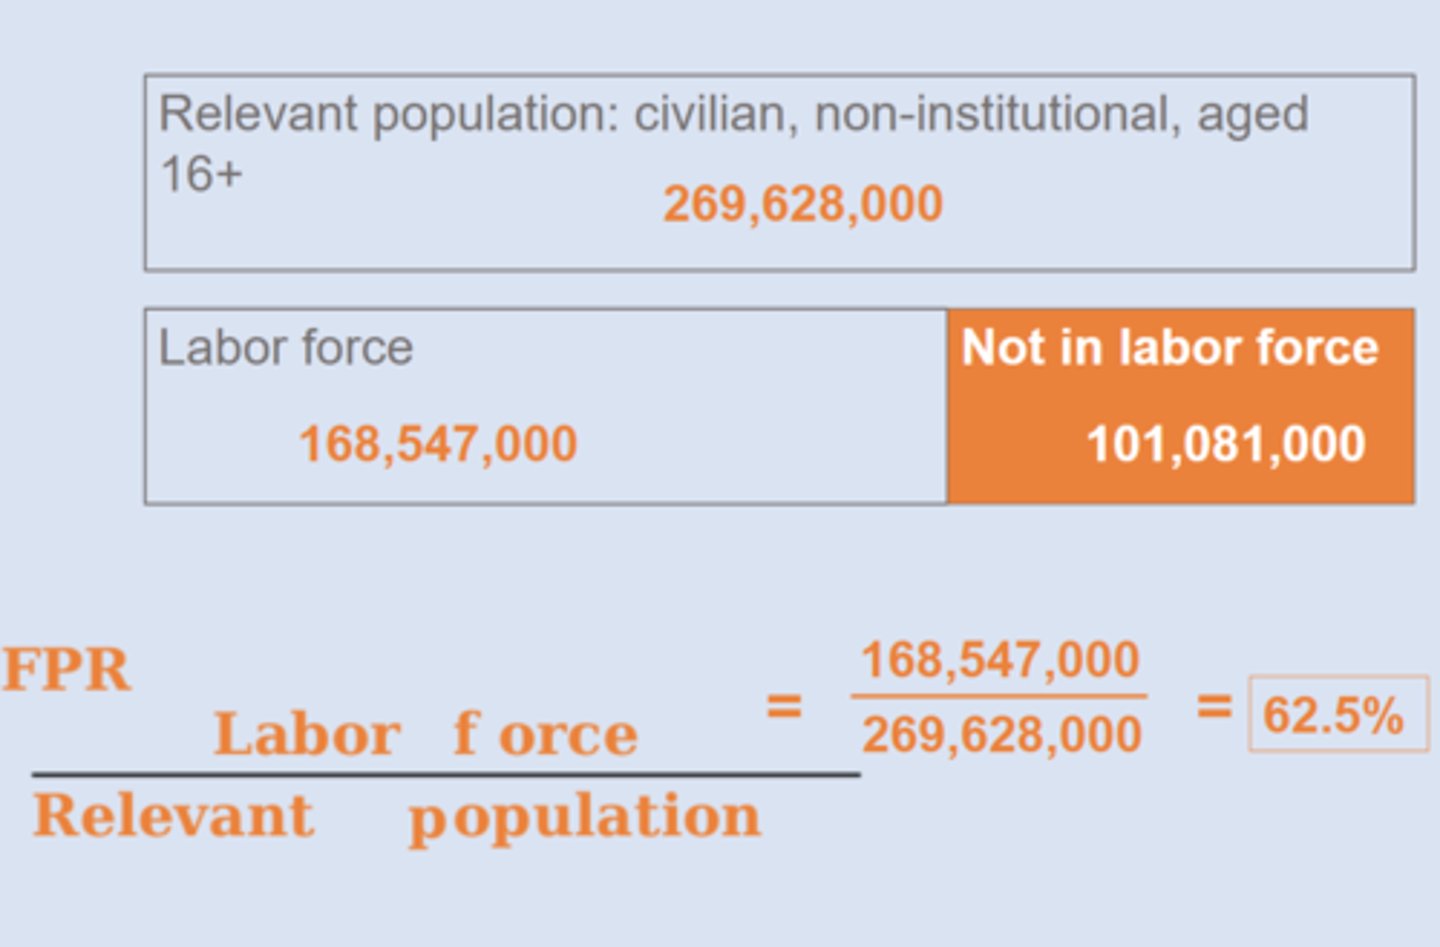
Relevant population
civilian, non-institutional, aged 16+ ==> 269 million
Who is not in the labor force?
+ college students
+ stay @ home workers
+ retirees
- marginally attached workers
marginally attached workers
People who tried to find a job for awhile (in past 12 months) but are no longer looking (in past 4 weeks)
labor force participation rate (LFPR)
percentage of work eligible population that is in the labor force (62.5%)
U-6 Unemployment Rate
total unemployed & marginally attached workers
(Total unemployed + Marginally attached workers + Part-time workers for economic reasons) ÷ (Labor force + Marginally attached workers) x 100
==> higher than u (7.5%)
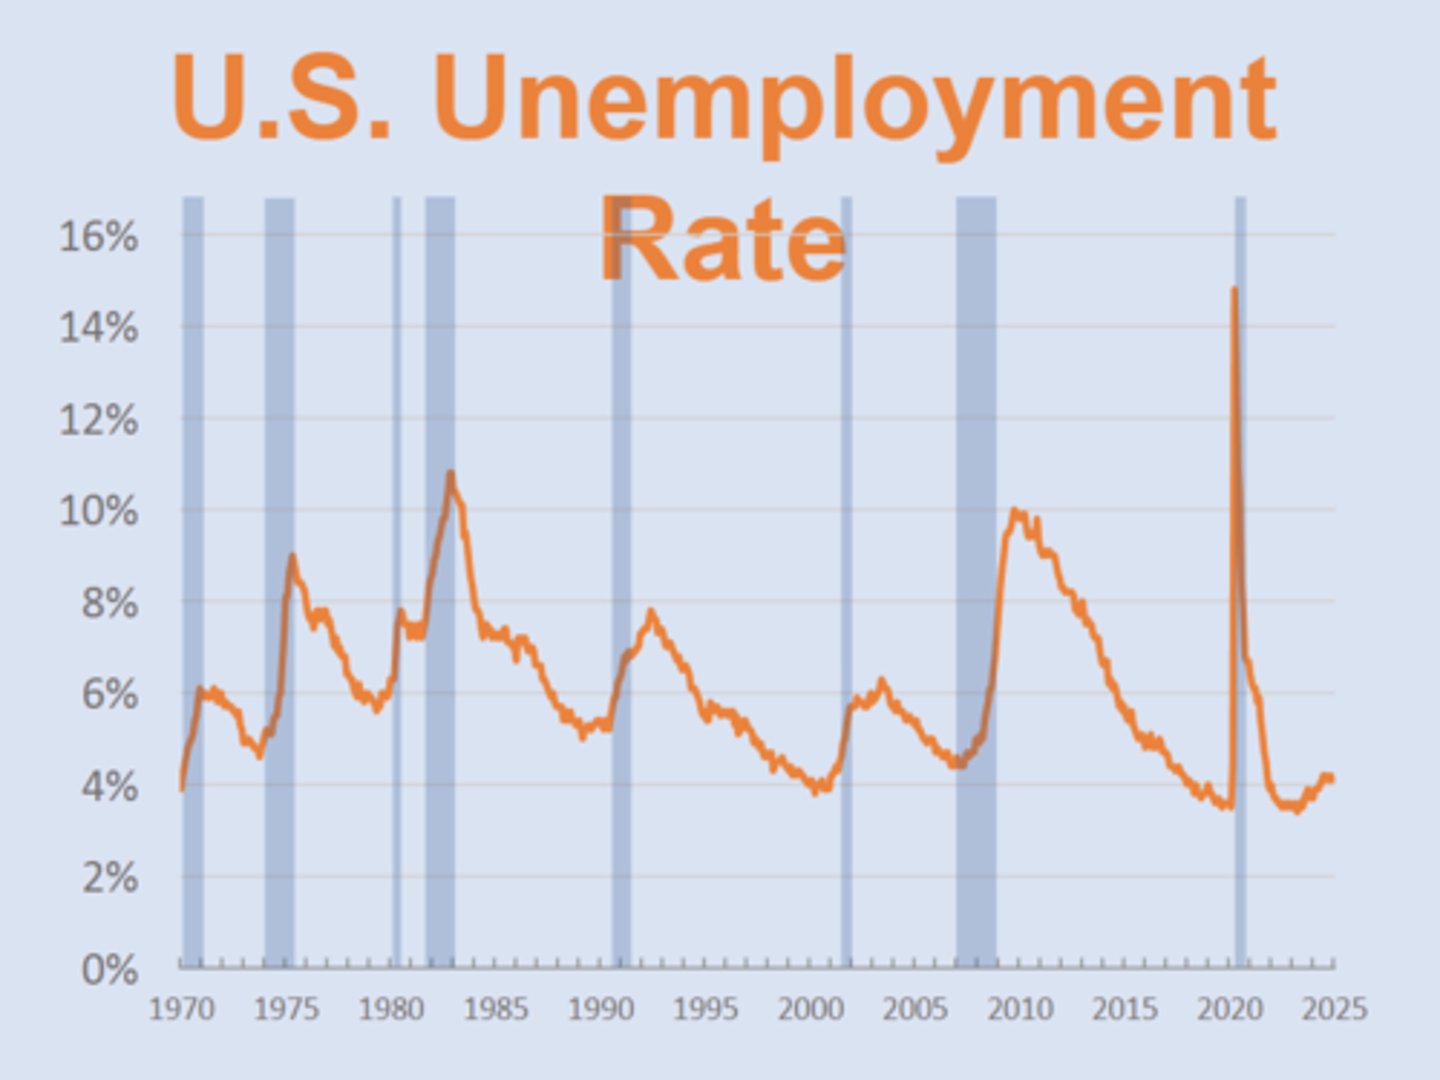
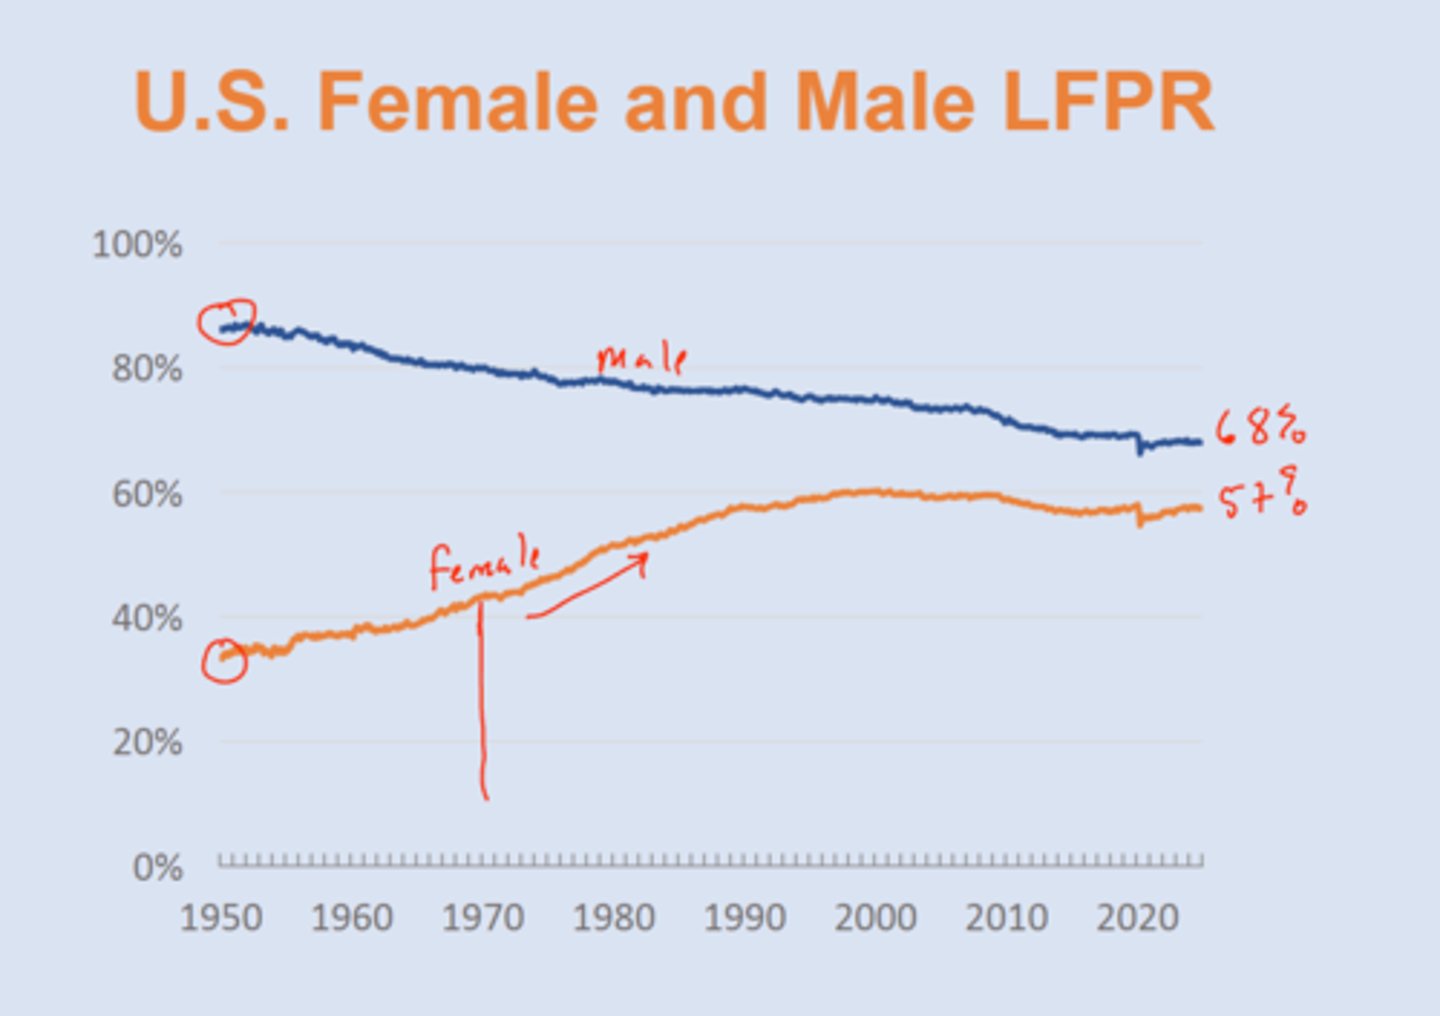
Historical Trends in Labor Forces
Three Types of Unemployment
- cyclical
NATURAL (occur event when econ is healthy):
- structural
- frictional
cyclical unemployment
unemployment caused by economic downturns
ex: covid
structural unemployment
caused by changed in the industrial makeup (structure of the economy)
==> creative destruction
creative destruction
new innovation makes old jobs obsolete
ex: AI, agriculture ==> services, fewer manufacturing
- inevitable
- sign of growing economy
- gov can help alleviate transition through subsidies
frictional unemployment
caused by delays in matching open jobs w/ workers
==> search takes time
==> technologies/policies (Linked-in) can decrease or increase (hiring/firing regulations, unemployment compensation)
natural rate of unemployment
u*
typical rate of unemployment when economy is growing normally (no cyclical)
approximately 4%
full employment output
Y*
potential output/GDP when the unemployment rate is equal to the natural rate
in recession
u > u*
Y < Y*
pos cyclical unemployment
expansion
u < u*
Y > Y*
neg cyclical unemployment
healthy economy
u = u*
Y = Y*
deflation
occurs when overall price levels fall
inflation
growth rate of overall price level in an economy

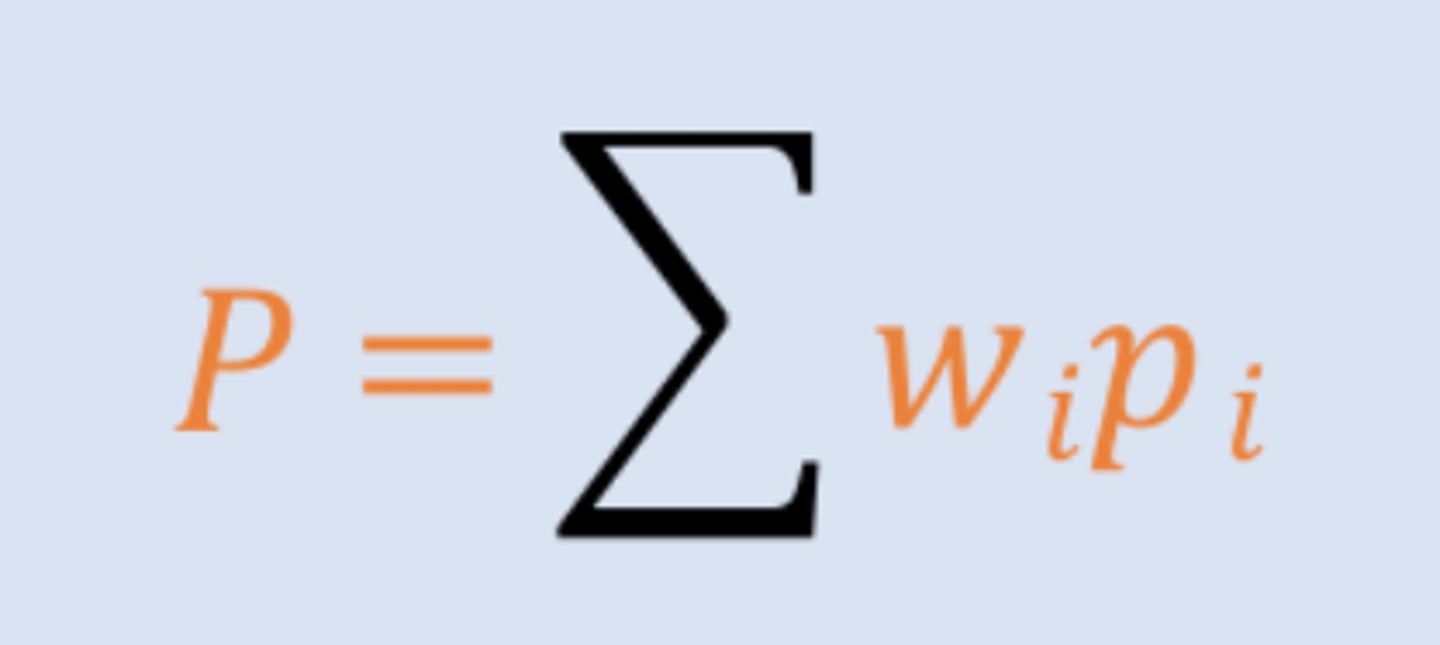
price level
The overall price level, computed with weighted averages of prices of individual goods and services
==> weights are based on the average portion of overall spending on each good/service
2 Price Indexes
1. CPI
2. GDP deflator
CPI
consumer price index: based on prices of goods & services bought by an average consumer (not capital)
ex: housing (45%), transportation (15.8%), food, education
think of overall rise in prices for consumers on average
not all prices move together
- basket, if 17% of budget, 17% weight
CPI equation
basket price / basket price in base year
x 100
using CPI to compare dollar values over time
price in todays dollars = price in earlier time x (price level today/price level earlier)
Accuracy of CPI
is it overstating inflation?
==> people substitute goods if price rises
==> changes in quality (bias upward)
==> new goods/services
(delayed record of price drops of new products)
Hedonic Adjustment
how they adjust for changes in quality of goods
chained CPI
typical consumer basket of goods & supplies updated monthly (lowed than CPI)
GDP deflator
based on prices of final goods & services in GDP
C, I, G, NX
problems w/ inflation
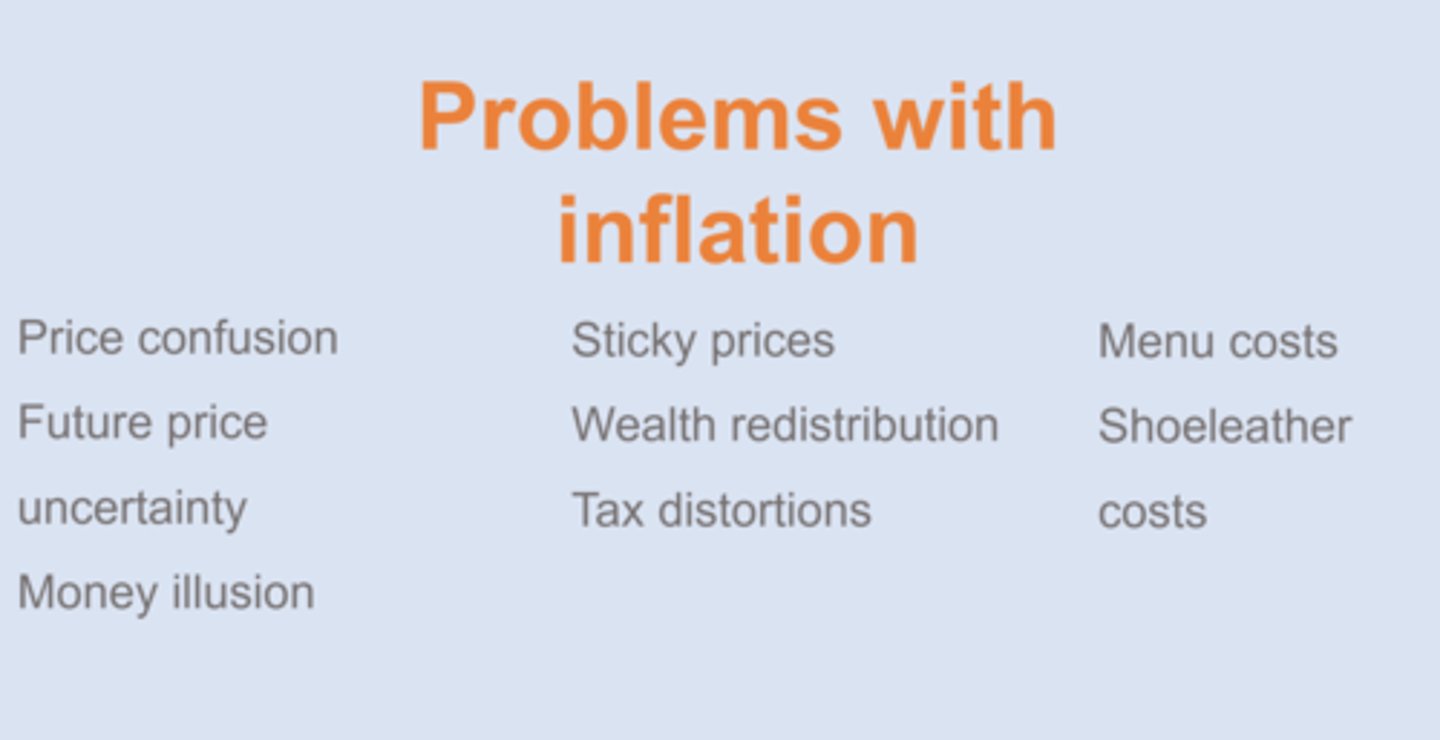
Price confusion
firms can be confused about source of current price changes (due to demand or inflation)
"signal extraction problem"
if they increase output, they risk overbuilding
future price uncertainty
market participants are uncertain about future price levels ==> reluctancy to sign long term contracts
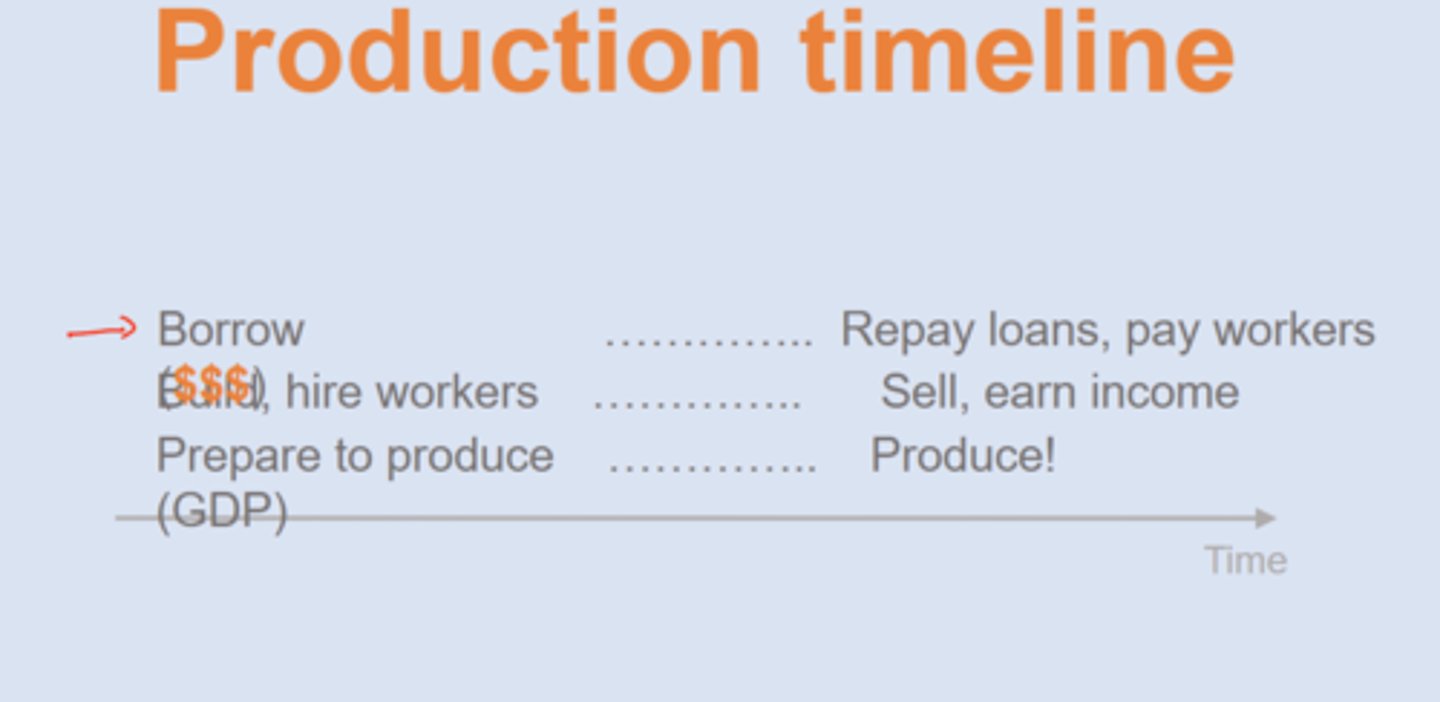
Production timeline
money illusion
occurs when people interpret nominal changes in wages or prices as real changes
ex: raise in income and inflation 3% ==> no real change