PHYS10191 - Astro
1/149
There's no tags or description
Looks like no tags are added yet.
Name | Mastery | Learn | Test | Matching | Spaced | Call with Kai |
|---|
No analytics yet
Send a link to your students to track their progress
150 Terms
Universe and its contents - What are the 5 categories of objects in space and what do they contain?
Planets (and related objects): small (on an astro scale) objects, either rocky or gaseous, that do not support nuclear fusion (don’t produce their own light/energy). e.g, (exo)planets, moons, asteroids, comets
Stars: larger (80x Jupiter mass or more) gaseous objects that do support nuclear fusion (and produce their own light/energy via it). exist on their own or in pairs/groups
Nebulae: Clouds of gas (mostly hydrogen) and dust (small solid particles, ~micron size), often from supernova remnants. They can collapse to form new stars or planets (if a planetary nebula) from contractions in the dust/gas clouds
Galaxies: Structures of stars, planets (sometimes in solar systems), and clouds, bound by mutual gravity. Have supermassive black hole at centre and can take many forms (spiral, elipitical, etc)
Radiation: all space is filled with photons of radiation from the CMBR. Was the only way we could observe space until the discovery of Gravitational waves (produced by large gravitational changes, deform spacetime)
Universe and its contents - What are brown dwarfs and what category of objects in space do they fit in to?
Brown dwarfs are objects with a mass between 13-80x Jupiter’s mass and can have nuclear fusion involving deuterium, but NOT hydrogen. this puts them in a weird category where they are not quite planets but not quite stars. There is not much deuterium in space so their fuel quickly runs out.
Universe and its contents - What are the masses of some key objects in the universe?
Planets: ~1025 kg
Stars: ~1030 kg = ~1 Mo
Galaxies: ~1040 kg = ~1010 Mo
Universe: ~1052 kg = ~1022 Mo
Universe and its contents - What is 1 Parsec (pc) defined as?
1 pc = distance an object is from Earth if the angle of parallax subtended by it from opposite points in Earth’s orbit is equal to 1 arcsecond = 3.09×10¹⁶ m
Universe and its contents - What is the distance (from Earth) of some key objects in the universe?
Sun = 1.496×10¹¹ m = 1 AU
Pluto = 6×10¹² m = 40 AU
Proxima Centauri = 4×10¹⁶ m = 1.3 pc
Galactic Centre = 2×10²⁰ m = 8 kpc
Andromeda Galaxy = 2×10²² m = 800 kpc
Edge of (observable) Universe = ~1026 m = ~3 Gpc
Universe and its contents - What is mass density and what are the densities of some common objects?
(mass) density is the mass per unit volume of an object. for spherical objects (like most astronomical objects) we can write this as:
\rho=\frac{m}{V}=\frac{m}{\left(\frac43\pi r^3\right)}
units: kg m-3
(mass) density of:
Water = 1000 kg m-3
Ice = 930 kg m-3
Typical rock = 2000 kg m-3
note that for water, this is only an estimate as the actual density will change with temperature (though for all temperatures will still round to 1000 up to 2 sig fig)
Universe and its contents - What is number density and what is the typical number density of stars in a galaxy?
number density is the number of something per unit volume (not the mass per unit volume of an object like mass density). This is commonly used for the density of particles (i.e atoms or molecules) in a gas.
it will just have the unit m-3 (or any other measurement of distance instead of m) and uses the symbol n.
the number density of stars in a galaxy is
n = ~1 (stars) pc-3 (= 6.4×10-45 m-3)
Universe and its contents - How can you convert between the number and mass density (and vice versa)?
the number density is just the number of an object within a set volume (i.e another object) while the mass density is the mass within a set volume (the other object)
Therefore:
n=\frac{\rho}{M},
\rho=nM
where M is the mass of the object that was the numbered object in the number density calculation
Universe and its contents - What is the universe composed of?
universe is:
~90% Hydrogen
~10% Helium
~0.01% everything else (!!!)
Universe and its contents - How can you calculate the number of molecules of gas in a set volume of space? (i.e the universe)
we can use the conversion formula from mass to number density:
n=\frac{\rho}{M}
with \rho = the mass density of the universe and M = MH2 = the mass of a hydrogen molecule (as the universe is 90% hydrogen)
Universe and its contents - How can you calculate the number of particles of gas in a set volume of space? (i.e the universe)
we can use the conversion formula from mass to number density:
n=\frac{\rho}{M}
with \rho = the mass density of the universe and M = MH = the mass of a hydrogen particle (as the universe is 90% hydrogen)
Universe and its contents - How can you calculate the number of ionised particles of gas in a set volume of space? (i.e the universe)
we can use the conversion formula from mass to number density:
n=\frac{\rho}{M}
with \rho = the mass density of the universe and M = MH = the mass of a hydrogen particle (as the universe is 90% hydrogen)
This gives us the number of particles of gas in the universe, however we want the number of ionised particles. When hydrogen is ionised, it splits into 2 particles (1 proton, 1 electron). Therefore, we just double the answer:
n=\frac{2\rho}{M}
Gravity - What is gravity and how is it calculated?
Gravity is one of the 4 fundamental forces. it is:
the weakest of all 4 of the forces (by a long way)
only ever attractive (yes, even with antimatter)
a radial force (acts between centre of masses)
infinite (has infinite range)
The force of gravity between two objects can be calculated from
F=G\frac{mM}{r^2}
where m = mass of first object, M = mass of other object, r = distance between the object’s centres of masses, and G is the Gravitational Constant, where G = 6.67×10⁻¹¹ m3 kg-1 s-1
ALL VARIABLES SHOULD BE IN SI UNITS!
Gravity - How can you calculate the acceleration caused by gravity (gravitational field strength) caused by the gravitational field of an object at a point in that field?
As F = ma
(where m is mass of object experiencing the force), we can find the gravitational field strength (acceleration caused by gravity) on a body of mass M from
g=\frac{F}{m}=\frac{GM}{r^2}
Gravity - How can you find the gravitational energy released (work done by gravity) by an object falling under the influence of gravity when the distance travelled is small?
released GPE = work done by gravity:
W=Fs=mgs
where s is the distance travelled by the object and F is constant (as s is small).
work done is also = the change in kinetic energy of an object, so
W=mg\Delta s=\frac12m\Delta v^2
Gravity - How can you find the gravitational energy released (work done by gravity) by an object falling under the influence of gravity when the distance travelled is NOT small?
when s is small,
W=Fs=mgs
However, if s is NOT small, F will NOT be constant and will change as S changes, so we must use integration:
W=\int_{}^{}\!F\,ds=\int_{}^{}\!mg\,ds=\int_{}^{}\!m\frac{GM}{s^2}\,ds
=-\left\lbrack\frac{GmM}{s}\right\rbrack (used s here instead of r in equation for g as we are integrating with respect to distance s)
GPE is the energy that is needed to reverse the process of the object falling (reverse the work done), so change in GPE = -W
Therefore, for initial r = r1 and final r = r2, where r1 > r2 (r1 = r2 + s as the object is falling towards the centre of mass)
W=\int_{r1}^{r2}\!m\frac{GM}{s^2}\,ds
=GmM\left(\frac{1}{r2}-\frac{1}{r1}\right)
so change in GPE=-GmM\left(\frac{1}{r2}-\frac{1}{r1}\right)
if the object starts at infinity (r1 = infinity), then the second term goes to 0 and can be left out, so
W=\frac{GmM}{r} ,
GPE (at point r) = -\frac{GmM}{r}
where r is the distance of the object from the centre of mass.
Gravity - How do you find the escape velocity of an object in a gravitational field?
remember that for an object starting at r = r1 and falling to r = r2, where r1 > r2,
W=\int_{r1}^{r2}\!m\frac{GM}{s^2}\,ds
=GmM\left(\frac{1}{r2}-\frac{1}{r1}\right)
If falling from infinity (r1 = infinity) and as W = - change in GPE, the change in GPE from falling from a height of infinity will equal = -\frac{GmM}{r}
This negative sign shows us that GPE has been lost: the GPE lost by a fall from infinity =\frac{GmM}{r}
Therefore for an object starting at r and trying to reach infinity, the GPE gained will equal this GPE lost ( =\frac{GmM}{r} )
As GPE gained = Ek lost:
\frac{GmM}{r}=\frac12mv^2
Alternatively, the change in Ek for an object moving away from the centre of mass = Work done against gravity (= -W = GPE) so
\frac{GmM}{r}=\frac12mv^2
therefore,
v=\sqrt{\frac{2GM}{r}}
where v = vesc = the velocity needed for an object to escape a gravitational field caused by mass M and r = the initial distance of the object from the centre of mass M (i.e if starting on the surface of Earth, r = Rearth)
Gravity - How do you find the orbital velocity of an object in a gravitational field at distance r from the centre of the field?
If in a stable orbit, the only force acting on an object should be the gravitational force,
F=\frac{GmM}{r^2}
therefore, all of the centripedal force causing the object to rotate in a circle must come from this gravitational force, so we can find vorbit by equating the gravitational and centripedal force:
F=\frac{GmM}{r^2}=\frac{mv^2}{r}
v=\sqrt{\frac{GM}{r}}
where v = vorbit, the orbital velocity of the object in the gravitational field caused by mass M, and r = the distance of the object from the centre of mass M (in a perfectly spherical orbit, this will equal the radius of the orbit)
Note: as vesc = \sqrt{\frac{2GM}{r}} ,
we can see vorbit = \frac{1}{\sqrt2} vesc
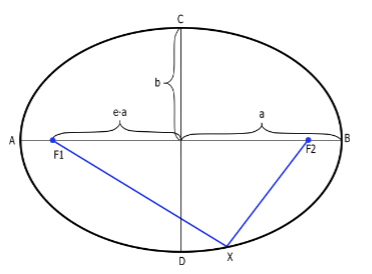
Gravity - Kepler’s first law
“Planets orbit the sun in ellipses with the sun at one focus”
An ellipse has a major axis (max radius) = 2a and a minor axis (min radius) = 2b, and two foci, each a distance of e*a from the centre along the major axis. The sun lies at one of these foci.
e = eccentricity (measure of how ‘wonky’ the orbit is) =\sqrt{1-\frac{b^2}{a^2}} , hence for a perfect circle, b = a, so e = 0
e*a gives the distanec from the centre of the ellipse to one of the foci along the major axis (as can be seen in diagram)
the semi-major axis is defined as half the major axis, = a, and the semi-minor axis is defined in the same way, so therefore = b.
the graphical equation for a ellipse is
\left(\frac{x}{a}\right)^2+\left(\frac{y}{b}\right)^2=1
Gravity - Kepler’s second law
“Planets sweep out equal areas in equal times”
the formula for angular momentum states L = mrv, where r and v are perpendicular to each other. However, in ellipses, r and v are not (always) perpendicular, so this becomes
L=mrv\sin\theta
the area swept out by a planet in time t is, assuming t is small enough that \theta is constant:
A=\frac{L}{m}t=rv\sin\theta t (remember momentum = mass * velocity so \frac{L}{m} is the radial velocity, w)
comparing this with the equation L = mrv shows that angular momentum is constant along the orbit for circles.
Gravity - Kepler’s third law
“the period, P, and semi-major axis, a, or the orbit are related through P2 = Ca3 (C is a constant)”
Note that when P is in years and a is in AU, for planets orbiting our sun, C = 1 so P2 = a3.
for other objects orbiting other objects, the equation P^2=\frac{4\pi^2}{GM}a^3 can be used, where in this equation, everything is in SI units. and an object of mass m orbiting an object of mass M (m « M).
It is important to note that in this law, the period is only dependent on the semi-major axis (a) and not the semi-minor axis (b). Objects with different eccentricity but the same value of a will still have the same period, despite having different centres!
Gravity - how can Kepler’s laws be used to show the conservation of angular momentum?
Use Kepler’s second law:
Remember angular momentum is given by L = mrv (when v and r are perpendicular, i.e in a circle)
the component of velocity perpendicular to r is,
v=r\frac{d\theta}{dt} , therefore L =mr^2\frac{d\theta}{dt}
for a perfect circle, \frac{d\theta}{dt} = constant, so
\frac{dL}{dt} = 0 as \frac{d^2\theta}{dt^2} = 0, showing that angular momentum is constant. This also shows that (for and object orbiting in perfect circle, so angular acceleration = 0), the gravitational force between that object and the object it is orbiting has no \theta component, therefore gravity is a radial force.
Gravity - how can Kepler’s laws be used to form the basis of Newton’s law of gravity?
Use Kepler’s third law and the equation for centripetal force:
We will assume that the force of gravity, Fg acts like a power law:
Fg=Ar^{b} where A and b are arbitrary constants
equating this to the centripetal force gives:
Ar^{b}=\frac{mv^2}{r}
the velocity in an orbit is given by v=\frac{2\pi r}{P} and Kepler’s third law states P^2=Cr^3. Therefore:
v=\frac{2\pi r}{\sqrt{Cr^3}}=\frac{2\pi}{\sqrt{Cr}}
substituting this into the force equation gives
Ar^{b}=\frac{4\pi^2m}{Cr^2}=\frac{4\pi^2m}{C}\cdot r^{-2}
showing A = \frac{4\pi^2m}{C} and b = -2.
This shows that the force of a gravity is an inverse square law with r (distance/radius from centre of mass) and that it is proportional to the mass of the orbiting object (m). This leads directly to Newton’s law of gravity if you make the assumption that the force of gravity is also proportional to the mass of the body being orbited, M (by letting C=\frac{4\pi^2}{GM}). Note: this is also where the general equation for Kepler’s third law comes from!
Gravity - What is one failing of Kepler’s laws?
Kepler’s laws apply to situations where one mass is completely dominant and therefore ignores the gravitational acceleration on the dominant mass entirely: the laws consider the sun in the system to be stationary, yet even in our own solar system, this isn’t true!
Jupiter has a mass of about 0.1% of the sun, so while it’s gravitational force of the sun is minimal, it is not negligible: it pulls the sun out of position by about 1 solar radius (Ro)
This makes the laws not as reliable when working with systems where orbiting objects have more comparable masses, i.e binary systems or the Earth-Moon system.
Gravity - How do you find the centre of mass between two objects in a binary orbit (binary pairs), and how does the centre of mass and the binary pair behave?
let m1 be the mass of object 1 and x1 be its position. Likewise, let m2 be the mass of object 2 and x2 be its position.
the position of the centre of mass, xcom, is given by:
xcom =\frac{m1x1+m2x2}{m1+m2}
which can be extended for more objects (i.e n objects) via a simple summation:
xcom =\frac{\Sigma mixi}{\Sigma mi} where i starts at 1 and ends at n
For binary pairs:
The centre of mass remains stationary while the two objects in a binary pair orbit it. The centre of mass will lie at one of the foci of the elliptical orbits (or in the centre if the orbits are circular), replacing the position of the sun in Kepler’s laws, and leaving both foci empty.
For binary pairs, the objects will always be on opposite sides of the centre of mass, showing us that the period of their orbits (P) is the same. If P was not the same, the centre of mass could not remain stationary and if it did, momentum would not be conserved! If xcom is stationary, then the momentum of the system is zero. Therefore, m1v1 = - m2v2 so the objects must always be moving in opposite directions to each other (P1 = P2).
Gravity - How do binary pairs in circular orbits behave?
Say we have two objects, object 1 has mass m1 and distance to the centre of mass r1, while object 2 has mass m2 and distance to centre of mass r2. Remember that both objects orbit with the same period (or else xcom would move).
using the equation for the gravitational force, we see
F=\frac{Gm1m2}{\left(r1+r2\right)^2}
The centripetal forces of the objects is given by \frac{m1v1^2}{r1} and \frac{m2v2^2}{r2} for object 1 and 2 respectively. Remembering that v=\frac{2\pi r}{P} and that P is the same for both objects, we can write these in the form \frac{4\pi^2m1r1}{P^2} and \frac{4\pi^2m2r2}{P^2} respectively.
By equating the centripetal force for each object to the gravitational force and cancelling like terms (the masses), we get the equations
\frac{4\pi^2r1}{P^2}=\frac{Gm2}{\left(r1+r2\right)^2} (object 1) and
\frac{4\pi^2r2}{P^2}=\frac{Gm1}{\left(r1+r2\right)^2} (object 2)
Adding these equations gives
\frac{4\pi^2\left(r1+r2\right)}{P^2}=\frac{G\left(m1+m2\right)}{\left(r1+r2\right)^2} which by substituting r = r1 + r2 and rearranging for P gives us:
P^2=\frac{4\pi^2}{G\left(m1+m2\right)}r^3
This is the equivalent equation to Kepler’s third law, but now r is the distance between the two masses and the sum of the two masses appears in the equation. If one of the masses is much larger than the other (i.e m1»m2) then the equation reduces back down to Kepler’s 3rd law (in SI units)
Gravity - How do binary pairs in eliptical orbits behave?
for a binary pair orbiting with elliptical orbits, the orbits will share one focus and the centre of mass will lie at this focus.
the orbital periods, P, of the objects will still be the same and the objects will still always be at opposite sides of the centre of mass from each other (if you drew a line from one object to the other, it would always pass through the centre of mass)
the equation for the period of the orbit becomes:
P^2=\frac{4\pi^2}{G\left(m1+m2\right)}a^3 (note: do not need to know derivation)
where a is the sum of each of the semi-major axes of the two orbits (i.e a = a1 + a2)
Distances - How do you measure the circumference of the Earth, and therefore Earth’s diameter?
take 2 points that are a known distance, d, away from each other (Greeks used Syene and Alexandria in Egypt, which are 800km apart)
wait until local noon at the summer solstice at one of the locations (Greeks did Syene) when the Sun will be directly overhead (at the Zenith)
at the same time, measure the angle,\alpha , between the position of the Sun and the Zenith at the second location (Greeks did this at Alexandria via shadows and measured an angle of 7.2 degrees)
knowing that a full circle is 360 degrees, you can find the circumference, C, (and therefore diameter) of the Earth using ratios:
\frac{\alpha}{d}=\frac{360}{C} (angles in degrees)
Using the Greek’s measurements, you calculate the circumference of the Earth to be 40,000 km (real answer is 40,075 km!)
Distances - How do you measure circumference of the moon’s orbit, and therefore the distance to the moon?
During a lunar eclipse, the moon travels through the shadow of the Earth. As the Sun is much further away from the Earth than the moon, we can assume the Earth’s shadow is a cylinder with a diameter equal to Earth’s diameter (D)
By measuring how long it takes for the moon to travel through this shadow, t, we can find the velocity of the moon, v
The period, P, or the moon’s orbit is known (29 days) and from this we can find the circumference, s, of the moon’s orbit, as this will be equal to the speed times the time travelled for ( s = vP)
we also know that s=2\pi r, so from this we can find the radius of the moon’s orbit, r, which is equal to the distance from Earth to the moon!
in formulas:
\frac{t}{D}=\frac{P}{s} ( comes from s = vP as v = D/t)
s=2\pi r
Distances - What is parallax?
Parallax is a method for measuring distances by recording where an object is seen from one position (i.e one side of the Earth) and again from another position (i.e from the other side of the Earth) and measuring the change in angle between the object at these two positions
let d be the distance to the object, b be the baseline (distance between your two positions, in example above would be Earth’s diameter), and \theta be the angle. simple trig shows us that \tan\theta=\frac{b}{d} , which when using small angle approximations goes to \theta=\frac{b}{d}
in this equation, b and d should be in the same units and \theta should be in radians
Distances - What is the drawback of using parallax on Earth and what can we do to get around this?
Using Earth’s diameter (~40,000 km) as a baseline and a telescope with a resolution \thetamin = 1×10⁻⁶ rad (most good telescopes), the furthest distance we can see is only ~1013 m = the distance to Pluto. this is 3000x less than the distance to the nearest star, so this cannot be used to measure the distances to even the closest of stars :(
We can get around this by instead of moving from one side of the Earth to the other, letting the Earth do the moving for us. If we take measurements 6 months apart (so Earth is in opposite sides of its orbit at each reading), we get a baseline = 1 AU (= radius of orbit as we must make it a right angled triangle), allowing us to measure the distances to (nearby) stars by comparing their position relative to background stars (stars that are much further away so appear not to move)
Distances - What is a Parsec defined as and what is it equal to?
A parsec is defined as the distance, d, that would be measured using parallax if you had a baseline of 1 AU and an angle, \theta, of 1 arcsecond
this can lead to a simplified parallax equation: d=\frac{1}{\theta}
NOTE: to use this equation D WILL be in pc and \theta MUST be in arcseconds.
1 pc = 3.09×10¹⁶ m = 206 kAU
Distances - How can parallax be applied in reverse to measure the size of objects in space?
remember the parallax equation, \tan\theta=\frac{b}{d}\approx\theta (in SI units or using ‘estimated’ version with b in AU, d in parsec, and \theta in arcseconds)
if you know the distance, d from you to an object in space, and know its angular diameter, \theta, (i.e angle subtended between the positions of two sides of the object from your position) then you can calculate the physical diameter, which will in this case be b, using b=d\tan\theta\approx d\theta
You can then (by assuming the object is circular in the sky) find its physical surface area from A=\frac{\pi}{4}b^2=\frac{\pi}{4}\left(d\theta\right)^2
The Solid angle of this object, or the angular surface area, can simply be found from \Omega=\frac{\pi}{4}\theta (just use angular diameter in area equation)
Distances - What is proper motion?
Proper motion is the motion of stars observed relative to each other caused by their velocities relative to each other. We see this as a change in position in the sky
It is measured in arcsec per year (note: this means by ‘change in position’ we clearly mean ‘change in angular position’), though an equation for it in SI units is given by \mu=\frac{v}{d} , where \mu is the proper motion (radians sec-1), v is velocity (in m sec-1), and d is distance (in m)
working in SI units for astronomy isn’t always helpful, so we can use the following equation to find the proper motion in arcsec yr-1:
v=\mu\cdot4.74\cdot d , where v is in km sec-1, \mu is in arcsec yr-1, and d is in pc
Distances - How do coordinates work in astronomy?
uses the system of longitude and latitude used on earth, but under a different name and with different units:
longitude (runs along the Earth’s equator) becomes the right ascension, RA (or \alpha), and is now split into 24 hours (instead of 360 degrees), with each hour containing 60 mins and each min containing 60 seconds
latitude (measured as an angle above or below the equator) becomes the declination, \delta, and ranges from 90 degrees (at North Pole) to -90 degrees (at South Pole), with each degree split into 60 arcmins and each arcmin split into 60 arcsecs.
Note that 1 minute does NOT equal 1 arcmin! (and same for seconds).
Distances - how do you convert seconds to arcseconds when working with coordinates in space, and how can you use this to find the distances between nearby stars?
At the equator ( \delta =0), each second of RA corresponds to 15 arcseconds (each hour = 15 degrees). as the declination changes, the conversion between time and angles does too. at a given value of \delta , 1 second =15\cos\delta arcseconds. Therefore, converting a difference in RA (\Delta\alpha) from seconds to arcseconds uses this equation:
\Delta\alpha (arcseconds)=15\Delta\alpha(seconds)\cdot\cos\delta
when finding the distances between two stars close together in the sky, you can take \cos\delta to be constant. this allows you to (once you’ve converted \Delta\alpha to arcseconds) easily find the distance between the stars, \Delta x, by adding up in quadrature:
\Delta x=\sqrt{\left(\Delta\alpha\right)^2+\left(\Delta\delta\right)^2}
Distances - What is luminosity? What is the Sun’s luminosity equal to?
Luminosity (L) is the energy that a star emits per second (i.e, it is the power output of the star). As it is a power, it has units of Watt (W), or equivalent (i.e J/s)
The Sun’s luminosity is: Lo = 3.84×1026 W. This is on the sheet of constants and is often used as a unit
Distances - What is flux? How is it linked with luminosity?
Flux (F) is the energy per second (luminosity) per square metre received by a star (i.e, it is the brightness of the star, or the apparent magnitude of the star). As it is a measurement of received light from a star, it depends on the distance from the star and therefore is proportional to 1/d2 (as we assume emitted photons from star spread out in all directions in a perfect sphere)
As flux is simply luminosity per square metre (area), we can link the two from F=\frac{L}{A}. As we assume stars are perfect spheres and that their emitted light spreads out in all directions equally, then the surface area that the light is covering at a given distance, d, is A=4\pi d^2.
Therefore, F=\frac{L}{4\pi d^2} (inverse square law)
From this, we can also calculate the distance to a star if we know it’s power output (luminosity) and observed brightness (flux): d=\sqrt{\frac{L}{4\pi F}}
Distances - What is apparent magnitude? How does it scale and how is it linked with flux?
Apparent magnitude is a measure of the brightness (i.e the flux) of a star. The larger the apparent magnitude, the dimmer the star appears to us.
Apparent magnitude works on a logarithmic scale, where magnitude increases by 5 if flux decreases by a factor of 100 (so a star of apparent magnitude 4 is 1001/5 = 2.511 times brighter than a star of apparent magnitude 5 etc)
due to this dumb scale, apparent magnitudes can only be calculated with reference to another star via the below equation:
m1-m2=-2.5\log_{10}\left(\frac{F1}{F2}\right) , where m1 and m2 are the apparent magnitudes and F1 and F2 are the fluxes of star 1 and star 2 respectively. Note that if F1 > F2 , m1 < m2 (as brighter stars have lower magnitudes)
If we just have one star and we want to find its flux from its magnitude, we have to use another reference star, i.e our Sun, or a star with an apparent magnitude of 0 (such as Vega) that we know the flux of (this is the easier method as then m2 vanishes from the equation)
Units become complicated when working with logarithmic quantities, so we usually use the abbreviation ‘mag’ to signify apparent magnitude values, i.e, mvega = 0 mag
Distances - What is flux ratio and how is it calculated?
Flux ratio is the ratio of the brightness (flux) of two celestial objects. Note that as it is a ratio, it is independent of distance (unlike flux on its own), making it useful for comparing different objects in space.
It can be calculated from the equation for apparent magnitude, m1-m2=-2.5\log_{10}\left(\frac{F1}{F2}\right), which can be rearranged to give \frac{F1}{F2}=10^{-0.4\cdot\left(m1-m2\right)}
Distances - What range of values can the apparent magnitude of stars as seen from Earth take?
Our Sun has m = -27, though the brightest star in our sky (Sirius) has just m = -1.46. Meanwhile, our best telescopes can detect stars of m = +25 or more (and in fact, many stars go much dimmer than that)
A range of -2 to +25 doesn’t sound that large, but remember the scale is logarithmic: Sirius is over 1010 times brighter than a star of m = +25, and our Sun is almost 1021 times brighter!
Note that you don’t need to know these exact values, it is just good to know to get a rough idea of how the scale works. tl;dr, magnitude 0 is very bright for a star, and magnitude 20 is very dim.
Distances - What is absolute magnitude and how is calculated?
The absolute magnitude is a measure of the power output (flux) of a star, and is defined as what the apparent magnitude of the star would be if it was a distance of 10 parsecs away from Earth. This means that it is independent of the distance between the star and Earth, so is useful for comparing the qualities of different stars.
It can be calculated by combining the equation linking flux and luminosity (F=\frac{L}{4\pi d^2}) and the flux ratio equation (\frac{F1}{F2}=10^{-0.4\cdot\left(m1-m2\right)}). Note that in the below workings, d0 and F0 are used to represent a distance of 10 parsecs and the flux at that distance respectively:
From flux and luminosity: \frac{F0}{Fobs}=\frac{L}{4\pi d0^2}\cdot\frac{4\pi d^2}{L}=\left(\frac{d}{do}\right)^2
Flux ratio: \frac{Fobs}{F0}=10^{-0.4\cdot\left(M-m\right)} , where M is absolute magnitude (apparent magnitude at distance d0)
so:
10^{-0.4\cdot\left(M-m\right)}=\left(\frac{d}{d0}\right)^2
M-m=-2.5\log_{10}\left(\frac{d}{10}\right)^2 (taking logs of both sides, note log(d0) = 10
M=m-5\log_{10}\left(\frac{d}{10}\right)=m-5\log_{10}d-5\log_{10}\left(-10\right)
therefore M=m-5\log_{10}d+5
Note that d MUST be in parsec!!! (or else equation WILL NOT WORK)
Distances - What is the distance modulus? How is it defined?
the distance modulus is defined as the difference between the apparent magnitude and absolute magnitude of a star/object in space, therefore = m - M (note we put apparent magnitude first as most stars are further than 10 pc away, so their apparent magnitude will be a larger value than their absolute magnitude as they will appear dimmer to us then they would be if they were 10 pc away, i.e m = M)
Distances in astronomy are often given as a distance modulus as observations normally measure the brightness of stars in magnitudes, which can easily be written as the distance modulus (m - M)
From our equation for absolute magnitude, M=m-5\log_{10}d+5, we can see that the distance modulus can be given by:
m-M=5\log_{10}d-5
(Remember d is in parsec!!!!!)
Therefore, if we know the distance modulus, we can easily calculate the distance in parsec to the object using this formula (another reason why distances in astronomy are usually given as distance modulus)
Distances - What are Cepheids and what are they used for?
Cepheids are a type of variable star which change brightness periodically (at a set frequency) making them easily recognizable (brightness sharply increases then slowly declines periodically with time)
The period of these pulsations scales linearly with the absolute magnitude of the Cepheid: the longer the period, the more luminous the star (M is more -ve)
Measuring the period allows us to find the absolute magnitude of the Cepheid and hence use it as a standard candle: Measuring the apparent magnitude and comparing this to the absolute magnitude allows us to find the distance the Cepheid is from us. This can be used to find the distance to objects near the Cepheid, for example if we find a Cepheid in a nearby galaxy, we can measure the distance to that Cepheid and therefore distance to that galaxy
As Cepheids are stars (so not super bright) they can only be used for closer measurements, i.e in or nearby to the Milky Way
Distances - What are type 1a supernovae and what are they used for?
Type 1a supernovae are a type of supernovae that all have a uniform peak brightness of M = -19.3
As the (peak) absolute magnitude is known, they make great standard candles: if you can find the peak apparent magnitude, the distance to the Supernova (and nearby stuff i.e galaxies) can be calculated
They are much brighter than Cepheids so are visible to very large distances (i.e outside the Milky Way). However, they are much rarer than Cepheids and are short lived (weeks - months), so large surveys and repeated observations are needed to find them
Distances - How do we know the peak absolute magnitude of type 1a Supernovae?
We used Cepheids!!!
A few supernovae were found in galaxies where the distance had been measured using Cepheids. This allowed us to ‘calibrate’ the relation between distance and peak apparent magnitude of the type 1a Supernovae, allowing us to find their peak absolute magnitude of M = -19.3
This method of calibrating a more distant type of object using more nearby ones is called the distance ladder (see picture)

Observational Astro: Formulae relating to light
Speed of wave: c=f\lambda
Energy of photon: E=hf=\frac{hc}{\lambda} (the only way a ‘wave’ of frequency f can increase its energy is by containing more photons!)
Observational Astro: Key wavelength values for EM spectra
Gamma: < 10-10 m
X-ray: 10-8 - 10-10 m
UV: 10-7 - 10-8 m
Visible: 3×10⁻⁷ - 7×10⁻⁷ m (300 - 700 nm)
IR: 10-4 - 10-7 m
Micro: 10-2 - 10-4 m
Radio: > 10-2 m (can even reach 100s of km)
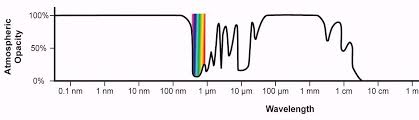
Observational Astro: graph of atmospheric opacity against wavelength of EM and what this means for different telescopes
as graph shows, most visible and all radio waves pass through our atmosphere and reach the ground, so optical and radio (and some low wavelength IR) telescopes can be placed anywhere on Earth. (though IR telescopes such as SOFIA are usually placed at high altitude to get above as much water in the atmosphere as possible - water vapour absorbs IR)
All other wavelengths are at least partially absorbed by the atmosphere so telescopes need to be at high altitudes / in space. (nearly) All gamma and x-rays (and most UV, which on graph is in between 100 nm and visible light) is blocked entirely so telescopes detecting these waves are always in space.
Observational Astro: What is a black body?
A black body absorbs and emits ALL wavelengths of EM radiation with perfect efficiency. Note that the distribution of emitted EM is not uniform (depends on the temperature).
In the real world, there is no perfect black body, but assuming stars act as black bodies can be useful for calculating/estimating details about them.
Observational Astro: What is the Planck function?
The Planck function (or Planck’s law) is a function that gives the distribution of emitted wavelengths of EM radiation by a black body for a set temperature:
B\lambda\left(T\right)=\frac{2hc^2}{\lambda^5}\frac{1}{e^{\frac{hc}{kT\lambda}}-1}
(note: you do not need to memorize this)
B is the energy over a small range of wavelengths (shown by the \lambda subscript) emitted per second by one square m of the blackbody, giving it units of W m-2 m-1 (where W m-2 is power per square m of area, aka the flux, and m-1 represents the wavelength, meaning B is the flux per m of wavelength)
B is often called the spectral irradiance: this is simply power per square m (flux) for each value of \lambda emitted
Remember, k is simply the Boltzmann constant
A plot of B against \lambda for a given temperature produces the black body curve for that temperature (see diagram)

Observational astro: Wien’s displacement law
Wien’s displacement law gives the peak wavelength (peak of black body curve of spectral irradiance against \lambda), meaning the wavelength where the most power is emitted per square m (flux = max) of the black body:
\lambda peak = \frac{2.897\cdot10^{-3}}{T} m (units are key here!!)
Observational astro: Stefan-Boltzmann law
Stefan-Boltzmann law gives the peak intensity (= total flux) of a black body given by the Planck function, and comes from integrating the black body curve produced by the Planck function at a given temperature (as area under = total flux, you don’t need to be able to do this integral):
F=\sigma T^4 W m-2
\sigma is the Stefan-Boltzmann constant and equals 5.67×10⁻⁸ W m-2 K-4
Observational astro: Finding the luminosity of a star and total energy emitted over a set amount of time by a star given its temperature
By remembering that luminosity is simply the energy emitted per unit time (= power) and that flux is the energy emitted per time per metre squared, we can see that luminosity is simply the flux multiplied by the surface area of a star.
By assuming a star acts as a black body, we can use the Stefan-Boltzmann law to find the flux of the star given the temperature:
F=\sigma T^4 W m-2
Therefore (assuming the star is spherical) the luminosity is given by
L=4\pi r^2\sigma T^4 W (= Js-1)
As luminosity is the energy emitted per unit time, the total energy emitted by a star is simply found by
E=Lt=4\pi r^2\sigma T^4t J
Observational astro: Why do stars not act as perfect black bodies in the real world?
different layers have a range of temperatures: deeper layers are hotter so would have a different spectral irradiance etc. For some wavelengths, the cooler outer layers are more opaque, so we only see these outer layers. For other wavelengths, the outer layers are more transparent so we see the hotter deeper layers. For example, with our Sun, at red wavelengths (where opacity is less) the Sun appears hotter than in the UV (where opacity is higher). Also note that as a black body absorbs everything perfectly, anything that is at all somewhat transparent cannot be a black body
Line emission spectra: the line emission spectra of stars contains narrow wavelength ranges that are emitted while other nearby wavelengths are not emitted, therefore not acting as a black body (see diagram)

Observational astro: ways of categorising the temperature of stars
Colour temperature: Select a range of wavelength and use the black body that most closely fits the true curve of the star’s emission at a range of selected wavelengths. This can be different for different wavelengths, for example the Sun’s colour temperature in the UV range is cooler than the colour temperature in the visible range
Effective temperature: uses the temperature of a black body which has the same surface area and luminosity of the star
As luminosity = surface area * flux, the Stefan-Boltzmann law can be rearranged to find the effective temperature, Teff:
Teff =\left\lbrack\frac{L}{4\pi r^2\sigma}\right\rbrack^{0.25}
Observational astro: How do you find the power of a lens?
defined as the inverse of the lens’ focal length:
p=\frac{1}{f} (m-1)
where f, the focal length, is the distance from the lens to it’s focal plane.
Observational astro: the Lens equation
\frac{1}{f}=\frac{1}{u}+\frac{1}{v}
where f is focal length, u is distance from object to lens, v is distance from image to lens
NOTE: u is positive if object is to left of lens while v is positive if image is to right of lens (directions of u and v are opposite)
Observational astro: Magnification of a lens
M=-\frac{v}{u}
The negative sign signifies if the image is upright or inverted, also showing if they are virtual or real: M is only negative if both v and u are positive, meaning a real image would have formed, which will be inverted. if M is positive, a virtual upright image will be formed. (note that u will, technically, always be positive)
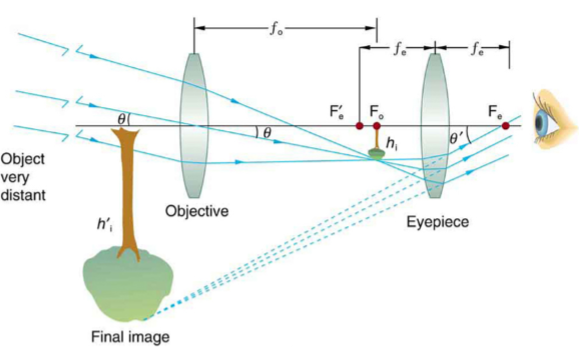
Observational astro: refracting telescope
Made up of two convex lenses: objective lens and eyepiece lens. They are separated so that their focal planes overlap
As the star is so far away (effectively at infinity distance), light from it enters the objective lens as a parallel beam
The objective lens creates an image at the focal plane. Light from this image then enters the eyepiece lens and as it’s focus is at the same focal plane where the image is, exits the eyepiece lens as parallel rays again
this forms a virtual image at “infinity” which can be seen by a human eye or camera looking into the eyepiece lens
Observational astro: downsides of using refracting telescopes
For large telescopes, lenses become increasingly massive (i.e a 2m lens could weigh 2 tons). This lens can only be supported from its edges which makes the telescope fragile (and unsafe as the astronomer will be sat below this huge lens!). It also makes the telescope hard to move and expensive to make
Chromatic aberration: different wavelengths of light are refracted by slightly different amounts by the same lens. Can form ‘fuzzy’, poorly-detailed images. Meanwhile, light is always reflected in the same way by mirrors meaning reflecting telescopes don’t have this issue.
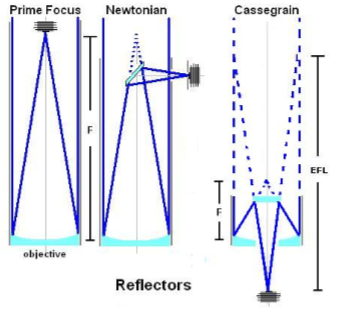
Observational astro: reflecting telescope(s)
Use a curved (technically parabolic) mirror at the bottom of the telescope to focus the light onto a “prime focus”.
Prime focus: These telescopes have the detector at the prime focus. This makes them simple as a secondary mirror is not needed to change the path of the light, but also makes them impractical as optical telescopes (as the human head would just block all the light lmao)
Newtonian: Use a (flat) secondary mirror placed BEFORE the prime focus to reflect the light by 90 degrees so an image is formed out the side of the telescope, means the detector (human eye or camera etc) is positioned alongside the telescope
Cassegrain: Use a secondary (convex parabolic) mirror placed BEFORE the prime focus to reflect the light 180 degrees back towards the centre of the primary mirror, which will have a hole through it allowing the light to exit the back of the telescope, where detectors would be positioned.
Observational astro: Magnification of astronomical telescope
Unlike for a single lens, there is no final image with space telescopes consisting of an objective and eyepiece lens (outgoing beam is parallel). Magnification is defined as the ratio between angles of incoming an outgoing light rays, i.e light rays entering the objective lens at \theta will exit the eyepiece at angle \theta^{\prime}, giving a magnification of:
M=\frac{\theta^{\prime}}{\theta}
This can be rewritten in terms of focal lengths of the two lenses:
M=\frac{fo}{fe} (where fo is the objective focal length and fe is the eyepiece focal length)
Observational astro: Focal length and image scale of astronomical telescopes
The overall focal length of a telescope, f, is the focal length of it’s objective lens (fo), or the focal length of the primary mirror if is a reflecting telescope
The image scale is the size of the image of the sky in the focal plane and is found with respect to angles (again):
Imagine there are two stars in the sky that have an angular separation of \theta. Imagine the distance between those two stars on the image formed by the telescope is s. The image scale is the ratio of the angular separation over distance on image:
p=\frac{\theta}{s}
drawing the ray diagram of the light through the objective lens reveals that \tan\theta=\frac{s}{f}. Using small angle approximations, we can therefore see that this can be rewritten as:
p=\frac{1}{f}
Observational astro: Why is the image scale of an astronomical telescope significant?
It is used for matching the size of the detector (eye or CCD etc) to the area of the sky that is being measured:
The size of the detector should be equal to the size of the field that is being detected (=s)
This can be found by dividing the angular separation of the field in the sky (\theta) by the image scale (see equation)
i.e, if angular separation of field when it is in the sky is 3600 arcseconds and the telescope has an image scale of 10 arcsec/mm, the detector must have a diameter of 360 mm across.
Observational astro: The collecting area of astronomical telescopes
defined as the area of the mirror or the objective lens and determines how much light is collected from the sky - more light = brighter image, but more expensive telescope! Assuming aperture is circular, collecting area is given by
A=\frac{\pi}{4}D^2 (D is dish diameter)
Observational astro: The focal ratio of astronomical telescopes
Defined as the focal length of the telescope divided by the dish diameter:
F=\frac{f}{D}
A smaller value means a brighter image (as brightness is proportional to dish diameter squared and the image scale)
For some reason, focal ratio is normally displayed as “F/.”, where . will be replaced with a number that is equal to F; it is NOT saying “F divided by this number” (i.e F/4.5 means the telescope has a focal ratio of 4.5)
oh astrophysicists…
Observational astro: What is the resolution of a telescope and what is it defined by?
Resolution refers to a telescope’s ability to separate two closely spaced sources, i.e min separation where you can still distinguish two separate objects
It is set by the diffraction limit of the telescope: smallest angular separation that can be resolved by the telescope in ideal conditions, given by:
\theta=1.2\cdot\frac{\lambda}{D}
D is diameter of telescope. Don’t forget the 1.2
larger angles = worse resolution (duh)
Observational astro: What is seeing?
“Seeing” refers to interference caused by our atmosphere that effects the resolution that can be achieved by a ground-based telescope;
Air contains pockets of slight different temperatures of typical size (r0) 5 - 30 cm. These pockets act as lenses and diffract light in slightly different directions. The diffraction limit of these pockets is therefore given by:
\theta=1.2\cdot\frac{\lambda}{r0}
This diffraction limit is called the “seeing”, and under normal circumstances at a typical observatory is equal to about one arcsecond.
For telescopes of diameter smaller than ~50 cm (in ideal conditions), the resolution is set by the telescope’s diffraction limit. For larger telescopes, the resolution is set by the seeing.
Observational astro: How is the effects of seeing prevented?
1: Remove the atmosphere! Place observatory on high mountain, or even better in space (Hubble is so good not because of it’s size, but because it can actually achieve it’s diffraction limit!)
2: Deform mirrors to compensate for air pockets via adaptive optics. Air pockets move by their own size in ~ 1-100 milliseconds, so adjust the shape of the mirror (of reflecting telescope) by that rate too. Adaptive optics is a difficult technique but is now built into the mirrors of the largest ground-based telescopes (allowing some to actually surpass the resolution of Hubble!)
Observational astro: What is interferometry?
Interferometry is the technique of combining several telescopes into an array in order to create a “singular” big telescope with a much better resolution;
The diffraction limit of the combined telescopes is now given by the distance between telescopes and not their individual diameters:
\theta=\frac{\lambda}{d}
where d is the distance between telescopes. (note the “1.2” is no longer here; before it was caused by the fact that the mirror/lens was circular and disappears when combining light from two spots)
The total collecting area of the combined telescopes is simply the collecting area of one singular telescope multiplied by the number of telescopes combined together:
A=N\cdot\frac{\pi D^2}{4}
(N is number of telescopes in array. note assumes all telescopes in array are identical)
Interferometry is a common technique in radio astronomy (i.e used in e-Merlin, which includes the telescopes at JB and has a resolution that matches that of hubble!) and is occasionally used in optical astronomy.
Observational astro: Spectroscopy via prisms
light enters prism at some angle to the first surface, is refracted, and exits at the second surface where it is refracted again
the refractive index, n, of the prism is greater than that of air (duh) so light bends towards the normal when entering and away from the normal when leaving. Different wavelengths of light bend by different amounts (refractive index depends on wavelength - is larger at shorter wavelength), causing them to spread out.
Snell’s law:
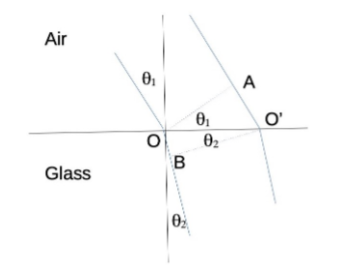
Derived from comparing two waves (see diagram):
wave 1 makes angle \theta1 with normal passing through point O at the boundary (where wave 1 enters the prism). A is a point on wave 2 that is \theta1 (upwards from parallel to boundary) from O.
O’ is the point at which wave 2 meets the boundary. B is a similar point on wave 1 that is \theta2 (downwards from parallel to boundary) from O’, where \theta2 is the angle of refraction of wave 2.
Using trig we can see:
\sin\theta1=\frac{AO^{\prime}}{OO^{\prime}} and \sin\theta2=\frac{BO}{OO^{\prime}}
This gives \frac{\sin\theta1}{\sin\theta2}=\frac{AO^{\prime}}{BO} where length AO^{\prime} equals v1t and length BO equals v2t where v1 and v2 are the speeds of light in those respective mediums. Remember v=\frac{c}{n} for mediums, therefore:
\frac{\sin\theta1}{\sin\theta2}=\frac{v1t}{v2t}=\frac{n2ct}{n1ct}
=\frac{v1}{v2}=\frac{n2}{n1}
n1\sin\theta1=n2\sin\theta2
Observational astro: Spectroscopy via gratings
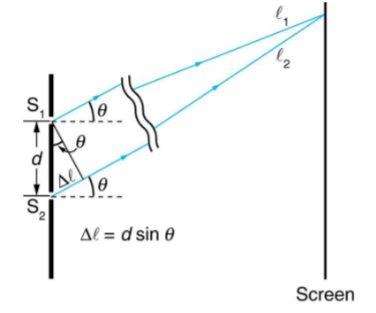
take an opaque screen with two holes a distance d apart from each other. Light shone at this beam will exit via the two holes which will act like light sources emitting spherical wave fronts which are (initially) in phase with each other.
A screen is placed a set distance away from the grating. As the two slits are separated, light from them must travel different distances to reach the same point on the screen. This means at some points on the screen light arrives in phase (so constructively interferes = light) but at others it arrives in antiphase (so destructively interferes = no light)
the path difference, \Delta l, of the distances traveled by the light determines if they constructively or destructively interfere. if \Delta l=\frac12\lambda then the waves cancel each other out (destructive interference) while if \Delta l=\lambda, the waves are in phase so constructively interfere
From the diagram we can see that:
d\sin\theta=n\lambda
where d is the distance between slits, n is an integer referring to the number of the node, and \theta is the angle between the normal to the grating and the path taken by the light rays (as shown)
Observational astro: Photographic plates
used until the 1980s
pros:
unlike the brain, they don’t suffer from imperfect recording/recollection (false memories) and can be read by anyone, not just the original observer
cons:
have poor efficiency i.e number of photons recorded vs number of incident photons
suffer from poor saturation i.e limit to the number of photons that can be recorded at a particular location
Observational astro: CCDs
‘Charge coupled devices’ use the photoelectric effect - they are basically photon counters: a photon releases an electron from the material, electrons induce a voltage, the voltage is read out. The signal is then digitized (digital-to-analog converter) and each digital number is recorded.
CCDs consist of a 2D array of cells, each acting as a separate detector. Barriers between cells carry negative voltage, repelling electrons so that they stay released in their separate cells. At the end of exposure, the voltage is made positive, attracting electrons which are then moved to the adjacent cell over and over until they reach one corner, where each voltage is measured as each cell’s electrons pass through
This gives a recording of each cell, which is used to form an image where each cell is one pixel.
Observational astro: Image scale of cells in a CCD
The size of each cell should match the resolution of the telescope, e.g if the telescope has resolution of 0.1 arcsec and each CCD pixel is 15 microns in size, the image scale (p, = resolution over surface/exposure area) should be 0.1 arcsec/15 microns
this gives p = 6.7 arcsec mm-1
Observational astro: What is the charge transfer efficiency in CCDs?
Charge transfer efficiency is the fraction of electrons in a cell that is successfully transferred to the next cell during the read-out process.
CCDs have lots of pixels (2000×2000 is normal) so lots of transfers are required for the furthest cells from the corner where voltage is measured.
This means the charge transfer efficiency should at least be >0.9999: otherwise lots of electrons are ‘lost’ on the way and ‘pollute’ the next cells creating issues in the intensity of the formed image.
Observational astro: What is the dynamic range of a CCD?
Dynamic range is the ratio between the highest and lowest number of electrons that can be counted (for each cell)
Lowest is normally 1, highest is normally limited at 65,000. This is for two reasons:
1) too many electrons in a cell negates the voltage barrier around the cell causing electrons to leak out
2) the binary number used to store the output is normally 16 digits, so can store at most the number 216
Observational astro: What is quantum efficiency? What is a typical value for a CCD, a photographic plate, and the human eye?
Quantum efficiency is the fraction of incoming photons that are detected (i.e in CCDs the fraction that ‘generate’ an electron).
For CCDs: can be as high as 80%
For photographic plate: is in the order of just 1%
For human eye: ~50%
Observational astro: Equations for calculating recessional velocity (doppler shift) for both non-relativistic and relativistic conditions
Case 1: v « c (where v is the recessional velocity of the source):
We can use \frac{v}{c}=\frac{\Delta\lambda}{\lambda rest}=\frac{\lambda obs-\lambda rest}{\lambda rest}
Case 2: v is close to c:
relativistic effects apply so cannot use previous equation. Instead we use the relativistic equation:
\lambda obs=\lambda rest\sqrt{\frac{1+\frac{v}{c}}{1-\frac{v}{c}}}
Observational astro: Exoplanet detection via radial velocities
Uses the doppler effect to detect radial velocity variations of the star (light from planet is too faint to see):
vdoppler=vorbit\cdot\sin i , where i is the angle of inclination of the orbit of the planet: if = 0, the orbit is in the plane of the sky so vdoppler cannot be seen, hence this method cannot be used. the maximum vdoppler is only seen for i = 90 degrees (when orbit is seen perpendicular to plane of sky)
We can restate the stellar velocity equation in terms of masses to give:
Mp=Ms\cdot vs\sqrt{\frac{rp}{GMs}}
If the orbit is inclined, vs is related to the observed doppler velocity (by equation above), giving us:
Mp\sin i=Ms\cdot vdoppler\sqrt{\frac{rp}{GMs}}
If Ms, the mass of the star, is known (i.e we know it’s position on HR diagram), by measuring the radial velocity variations of the star using the doppler effect, we can find the mass of the planet, but only in the form Mpsin(i), meaning the inclination of the orbit must be known for a full result.
Observational astro: What is cosmological redshift defined as and how is it measured?
Cosmological Redshift, z, is defined as the difference between observed and rest wavelength (of light emitted by star/object) over the rest wavelength (of same light):
z=\frac{\lambda obs-\lambda rest}{\lambda rest} or 1+z=\frac{\lambda obs}{\lambda rest}
This definition is true for relativistic and non-relativistic cases, but this is not true for recessional velocity (doppler shift), as seen in previous flashcards.
For non-relativistic conditions, we have seen \frac{vdoppler}{c}=\frac{\lambda obs-\lambda rest}{\lambda rest} meaning when v « c, z=\frac{vdoppler}{c} , hence usually the non-relativistic case applies to z <= 1, and when z is close to 1, it is often more accurate to use the relativistic case.
(more on relativistic conversion of z to v is in cosmology section)
Redshift is measured using the emission spectra of the observed object (usually a galaxy) and seeing how the wavelength of observed emission lines (particularly Halpha, which for high z can shift out of visible range, and Lyalpha, which for high z can shift into visible range) compare with the expected (rest) emission lines
Stars and Galaxies: The HR diagram (uses and “common” form)
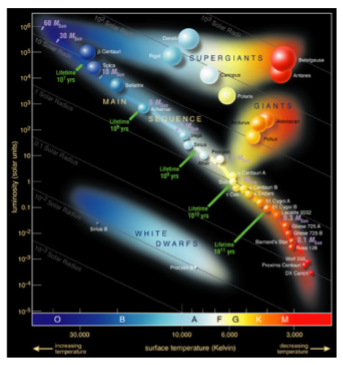
Is used to show relations between common properties of stars (i.e mass, temp, radius, luminosity/magnitude). Mid section shows main sequence (90% of stars), top right has red giants/supergiants, bottom left has white dwarfs.
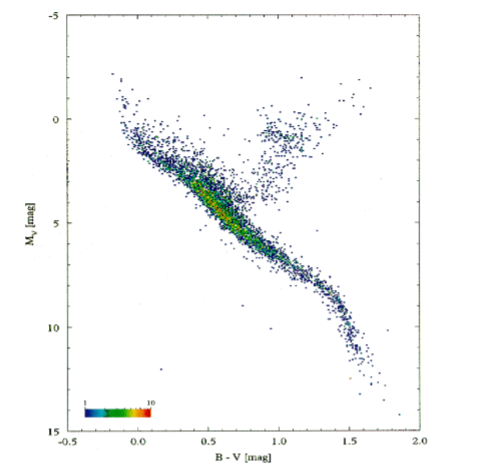
The common form of this diagram has the absolute magnitude of stars plotted on the vertical axis and colour plotted on the horizontal axis.
The colour is put on a numerical scale of B - V, where B is the magnitude of the star at blue wavelengths (~450 nm) and V is the magnitude of the star at visual wavelengths (~550 nm). A bluer star will have a smaller B value than V value while a redder star will have a smaller V value than B value (remember that high magnitude = -ve number), meaning bluer stars have small B - V and red stars have large B - V. (see diagram)
Stars and Galaxies: The HR diagram (luminosity/temp form and what it shows)
Luminosity (= power = total energy radiated per second) and temperature are linked by the Stefan-Boltzmann law:
L=4\pi R^2\sigma T^4
Meanwhile, absolute magnitude is a logarithmic scale measurement of luminosity while colour is a measurement of temperature (Wein’s displacement law). Therefore absolute magnitude is replaced with the log of luminosity and (for consistency, due to Stefan-Boltzmann law above) colour is replaced with the log of temperature.m
From the Stefan-Boltzmann law we can see this gives:
\log_{10}L=4\log_{10}T+2\log_{10}R+\log_{10}4\pi\sigma - A straight line!! (when radius is constant)
This gives us the luminosity against temp form of the HR diagram (see diagram), which is the more commonly used form of the diagram (despite the other form being called “common form”??). Note that temp is plotted on horizontal axis “backwards”, i.e hotter temperatures are closer to vertical axis.
The straight line when R is constant (gradient 4, y-intercept 2\log_{10}R+\log_{10}4\pi\sigma ) is often plotted over this and tends approximately fit the general slope (bit in middle, not at edges) of the main sequence. The diagram shows this with the straight line plotted over it for various values of R. The fact that the low-temp end curves below the line and high-temp end curves above the line shows us that lower temp stars (in the main sequence) have smaller radii than high temp stars - radius increases with temperature.
Stars and Galaxies: Spectral classification on HR diagram
On the horizontal axis of the (luminosity/temp) HR diagram, the letters of spectral classification run alongside the stellar temperature from high to low (OBAFGKM, see diagram).
Each class is then subdivided further from 0 to 9 (in decreasing temp, i.e A9 is colder than A0).
The spectral classification is also linked to the mass of the stars, but only for main sequence stars (spectral classification shows temp/colour of giants/dwarfs, but not mass). For example, A types are around twice as massive as G types, O types are more than 15 solar masses!
Note the Sun is a G2 star.
This is known as the Harvard system of classifying stars and was devised by a group of (mainly women) astronomers in the early 20th century, and is still used today!… The spectra of the stars show the general shape of that of a blackbody, with superposed (larger than expected) absorption lines coming from particular elements. These elements were used by Cecilia Payne Gaposchkin to show the composition of stars (90% H, 10% He)

Stars and Galaxies: Comparison of red giants to red supergiants (with respect to HR diagram and how their details compared to the stars that made them)
once low-mass main sequence stars burn all their fusion fuel in their core, they become red giants. High-mass main sequence stars become red supergiants
red giants have a much higher luminosity than the main sequence stars that became them, but red supergiants often have approximately the same luminosity as the main sequence stars that formed them
Once red giants use all their fusion fuel, they become white dwarfs. red supergiants supernovae into either neutron stars or black holes, depending on mass.
Stars and Galaxies: measuring the lifetime of stars (in stellar clusters) on the main sequence
Lifetime depends on mass - highest mass stars last around 107 yr, low mass stars last much longer.
Difference in lifetimes can be measured from observing stellar clusters - clusters contain stars all formed at the same time so will all have the same age, but not the same mass.
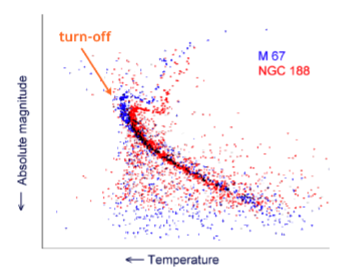
Stars with a maximum lifetime on the main sequence that is less than the age of the cluster will have evolved off the sequence. Therefore, the HR diagram of the main sequence of the cluster will have a “turn off” point at the top left. As the cluster ages, this cut off “border line” will progress down the sequence
This point is called the main sequence turn off. By measuring the luminosity/temperature at the main sequence turn off and comparing that to the average lifetime of stars in that spectral class, the age of the stellar cluster can be estimated.
The diagram shows two different HR diagrams of the main sequences for two different stellar clusters. M 67 has stars of a higher luminosity at it’s turn off point than NGC 188, suggesting it is younger than NGC 188.
Stars and Galaxies: (non-relativistic) Derivation of wavelengths of spectral lines of hydrogen atom (which give way to specific hydrogen spectral lines)
Uses the idea of “electron orbits” - Electron is wave so if the circumference of the orbit around the nucleus is not exactly an integer of wavelengths, the electron will interfere with itself and vanish.
We want to find energy of electron at different orbits (as this links to wavelength by E = hc/lambda). The total energy will be the kinetic energy (of the electron) plus the electric potential energy (between electron and proton/nucleus):
E=\frac12mv^2-\frac{e^2}{4\pi\epsilon0r}
Here r is the distance from proton to the electron, and m is the mass of the electron. We want to find expressions for these in terms of constants we know. First we find v (in terms of r) using the idea that the circumference must equal an integer value of the wavelength:
2\pi r=n\lambda (r is distance from proton/nucleus)
2\pi r=\frac{nh}{mv} (m is mass of electron)
v=\frac{nh}{2\pi rm}
To find r, we can equate electric force (between proton and electron) and centripetal force:
\frac{e^2}{4\pi\epsilon0r^2}=\frac{mv^2}{r}
r=n^2\left(\frac{h}{2\pi}\right)^2\frac{4\pi\epsilon0}{me^2}
Substituting v into the equation for E, followed by substituting r gives (after some wacky maths):
E=-\frac{1}{n^2}\frac12\left(\frac{2\pi}{h}\right)^2\frac{me^4}{\left(4\pi\epsilon0\right)^2}
E=-\frac{13.6}{n^2}eV (as all terms other than n are constants!)
This shows us the energy of each “orbit” depends on n2.
Note: it is the change in energy levels that releases/requires energy.
This gives us:
\Delta E=13.6\left(\frac{1}{n1^2}-\frac{1}{n2^2}\right)eV
Linking to \Delta E=\frac{hc}{\lambda} (where lambda is wavelength of emitted/absorbed photon to allow for this change of energy) gives:
\frac{1}{\lambda}=R\left(\frac{1}{n1^2}-\frac{1}{n2^2}\right)
Where R is the Rydberg constant, R = 1.097×10⁷ m-1 (= 13.6 eV / hc)
Note that this equation has been derived without relativity, though happens to actually give the correct answers!!
Stars and Galaxies: Generic equation for wavelength of spectral lines for atoms
\frac{1}{\lambda}=R\left(\frac{1}{n1^2}-\frac{1}{n2^2}\right) (derived in last flashcard) gives the wavelength of spectral lines specifically for hydrogen atoms. The generic equation includes Z, the number of protons of the atom (atomic number):
\frac{1}{\lambda}=RZ^2\left(\frac{1}{n1^2}-\frac{1}{n2^2}\right)
Stars and Galaxies: How are hydrogen spectral lines named and what are their ranges of wavelengths?
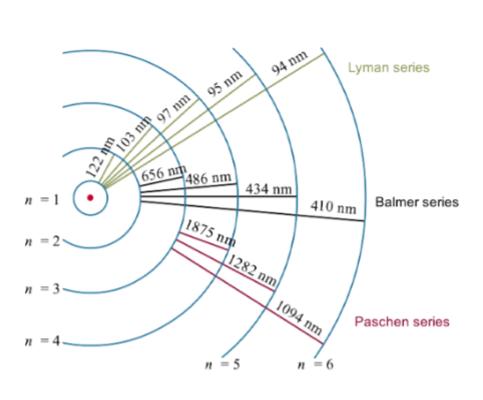
\frac{1}{\lambda}=R\left(\frac{1}{n1^2}-\frac{1}{n2^2}\right) gives the equation for wavelength of emitted/absorbed photon of hydrogen spectral lines, where n1 is the lower level, and n2 is the higher level, of the transition that produces that photon.
Hydrogen line groups (series) are named according to the lower level of the transition, n (i.e n1. n2 has no effect on group name)
Lyman series for n = 1, abbreviated Ly. They are in UV range
Balmer series for n = 2, abbreviated H (for “historical reasons” - in optical range so first detected). They are in visible range
Paschen series for n = 3, abbreviated P. They are in infrared, and up to radio range
Further series are usually denoted as Hn
Greek letters are used to designate the difference (= n2 - n1, NOT just n2).
\Delta n=1 gives \alpha
\Delta n=2 gives \beta
and so on for rest of Greek alphabet…
Specific individual spectral lines are given by the combination of the two, i.e Ly\alpha gives the spectral line from the Lyman series with difference in n of 1 (so n1 = 1, n2 = 2).
Further series being denoted as Hn can be confusing, i.e H\beta equals Balmer series transition with n1 = 2, n2 = 3, but H10\beta gives the 10th series where n1 = 10, n2 = 11. Make sure to note if there is a number directly after “H” to confirm if it is marking a Balmer series or a later series spectral line!
Stars and Galaxies: When are hydrogen spectral lines (specifically Balmer lines) the strongest in stars? Why?
In general, Hydrogen lines are strongest at high-ish (but not too high) temperatures (strongest in A and B type stars). They tend to disappear at both high and low temperatures
The diagram (spectra of an A type star) shows that for stars with strong Balmer lines, not all spectral lines are the same strength (intensity) - intensity increases up to the Balmer limit where the energy of the star is not sufficient to produce spectral lines with a greater change in energy level (denoted by Greek letters)
Reasoning:
At higher temperatures, hydrogen at the surface of the star becomes ionized - the atoms no longer have electrons!! This clearly means their electrons cannot absorb photons to move between energy levels and produce spectral lines, hence O class stars have NO Balmer lines at all!
At lower temperatures, there is not enough thermal energy to bring electrons to level n = 2 (almost all hydrogen has electrons in n = 1). The Balmer lines require the lowest electron in n = 2 so that it can be excited to higher levels, hence why F to G types have progressively weaker Balmer lines and M types have none at all.

Stars and Galaxies: The dynamical time scale (+ derivation)
Defined as time it would take for a star to collapse if there is no opposing force to gravity AND assuming acelleration (of particles falling from rim to centre of star) stays constant (in reality it would increase as force of gravity is proportinate to 1/r2)
Instead we assume a particle has fallen from infinity to the surface of star (r = R) so has velocity equal to escape velocity. We then assume it maintains this velocity until it reaches the centre. Therefore:
t=\frac{R}{vesc} , vesc=\sqrt{\frac{2GM}{R}}
t=\sqrt{\frac{R^3}{2GM}}
We can then write M in terms of star density:
M=\frac{4\pi R^3\rho}{3} , t=\sqrt{\frac{3}{8\pi}\frac{1}{G\rho}}
As we made simplyfing assumptions, this only gives approximate answers. If we only want an order of magnitude estimation (within factor of 10) we can set the constant (3/8pi) to 1. This gives the dynamical time scale:
tdyn\approx\sqrt{\frac{1}{G\rho}}
note: Sun’s density is ~ 1400 kgm-3, giving a tdyn = 1000 sec → less than half an hour!
Stars and Galaxies: Equation of hydrostatic equilibrium (+ derivation)
Force that stops stars from collapsing under gravity is provided by pressure gradient - imbalance of pressure along direction of gradient: higher pressure gas pushes outwards (from star), the lower pressure outer gas pushes back with a lesser force, providing a resultant radially outward force
For derivation, we must find Fg (grav force) and Fp (pressure force) as expressions of r and set them equal to each other:
Fg: Use expanding shells idea - consider small volume element of area dA, thickness dr, density p, at distance r from centre of star. The gravitational force acting on this volume comes from the mass located inside the radius of r (= m as a function of r). The mass of the volume element will be dAdrp, therefore:
Fg=\frac{Gm\left(r\right)dAdr\rho}{r^2}
Fp: Pressure equals force/area, therefore to turn the pressure into a force, we multiply it by dA. Pressure itself is a function of r - net pressure is the difference between pressure at bottom of volume (P as function of r) and at the top (P as function of (r + dr)). Therefore:
Fp=\left(P\left(r\right)-P\left(r+dr\right)\right)dA
P(r + dr) can be approximated as P\left(r\right)+\frac{dP}{dr}dr, therefore:
Fp=-\frac{dP}{dr}drdA
Equal forces: Fg = Fp, Fg - Fp = 0, therefore:
\frac{Gm\left(r\right)dAdr\rho}{r^2}+\frac{dP}{dr}drdA=0
Equation of hydrostatic equilibrium =
\frac{dP}{dr}=-\frac{Gm\left(r\right)\rho}{r^2}
Stars MUST satisfy this equation (to a high accuracy) to stay stable. Note that m(r) is the mass located inside radius r
This equation provides an explanation for why stars exist longer than the dynamical time scale predicts - as long as the star has internal energy, the pressure gradient is upheld and the star will not collapse.
Stars and Galaxies: Kelvin-Helmholtz time scale (+ derivation)
Defined as the time it would take for a star to collapse assuming it is purely powered by it’s potential energy from when it was formed - how long would the star continue to radiate at its present luminosity before it has radiated all it’s internal energy away and collapses?
The potential energy of a star is the negative of the energy that was released when the star was formed. Stars are formed by the collapse of very extended gas clouds. The collapse of this cloud from infinity to R releases energy equal to the gravitational potential energy of the star, hence we can use (derived before)
E\left(r\right)=-\frac{Gm\left(r\right)mshell}{r}=-\frac{Gm\left(r\right)4\pi r^2\rho dr}{r}
For the KH time scale, we assume density is constant, therefore m\left(r\right)=\frac43\pi r^3\rho. The total potential energy of the star therefore comes from integrating over r (r = 0 at centre to r = R at rim):
Ep=-\int_0^{R}\frac{Gm\left(r\right)4\pi r^2dr\rho}{r}=-\int_0^{R}\frac{16G\pi^2}{3}\rho^2r^4dr
Ep=-G\frac{16\pi^2}{15}\rho^2R^5, which we write as Ep=-G\left(\frac{4\pi}{3}\rho R^3\right)^2\frac{3}{5R}. Note that the term between the brackets equals the total mass of the star, M, so:
Ep=-\frac35\frac{GM^2}{R}
(constant 3/5 is only true for constant density, different density profile gives different constants, but are usually in range of 0.1 to 10, so can use 1 for quick estimations)
Potential energy held in the star is minus the energy released when the star is formed (what we just found). Kelvin-Helmhotz timescale therefore given by:
tKH=-\frac{Ep}{L}
tKH\approx\frac{GM^2}{RL} (when constant is ignored / set to 1)
Note L is luminosity (power output i.e energy radiated per second) of the star. For the Sun, this gives a timescale of 30 milllion years - much better than dynamical timescale, but still much shorter than real lifetime!
Stars and Galaxies: Vivial theorem (+ long derivation)
Vival theorem links the potential energy of the star to the kinetic energy of it’s particles, also known as it’s thermal energy (i.e Ek = Eth)
Thermal/kinetic energy is linked to pressure by \char"0190 k=\char"0190 th=\frac32P (equation derived by using pV = nRT and stating P equals change of momentum of particles hitting wall of container from A level), where Epsilon means energy density, i.e energy in one cubic metre of gas in star.
Therefore, the dynamical timescale (based on pressure) and KH timescale (based on potential energy) can be used to link potential and kinetic energy!
Derivation:
1) integrade hydrostatic equilibrium equation:
dP=-\frac{Gm\left(r\right)\rho}{r^2}dr , integrate pressure from outside star (P = 0) towards current radius of star (P = P(r)), therefore integrate inwards towards current radius r from radius outside star, R:
\int_0^{P\left(r\right)}dP=\int_{R}^{r}-\frac{Gm\left(r\right)\rho}{r^2}dr
P\left(r\right)=-\int_{R}^{r}\frac{4G\pi}{3}r^{}\rho^2dr
(here we have subbed in m\left(r\right)=\frac43\pi r^3\rho. Note we are using constant density)
P\left(r\right)=-\frac23G\pi\rho^2\left(r^2-R^2\right)
This gives the pressure at any radius in star
2) Energy:
As \char"0190 k=\frac{Ek}{V}, total kinetic (thermal) energy inside star given by:
Ek=\int_0^{R}\char"0190 \left(r\right)4\pi r^2dr
Remember that \char"0190 k\left(r\right)=\frac32P\left(r\right). Sub in our equation for P(r) to get:
Ek=G4\pi^2\rho^2\int_0^{R}R^2r^2-r^4dr
Ek=G\frac{8\pi^2}{15}\rho^2R^5
Comparison:
Using \rho=\frac{M}{\frac43\pi R^3} gives:
Ek=\frac{3}{10}\frac{GM^2}{R}
Before (when deriving KH timescale), we found potential energy is given by:
Ep=-\frac35\frac{GM^2}{R} (when density is constant!!)
Therefore, we can see:
Ep=-2Ek
The virial theorem!!
Note that we have derived this for the particular case of constant density!! However, it is generally still valid in conditions where kinetic energy (= thermal energy) has to provide stability against gravity, i.e to be stable, a star must satisfy Ep+2Ek=0
Also note this appears in other places - we saw before Vesc=\sqrt2vorbit. Squaring both sides and multiplying by 1/2m gives \frac12mvesc^2=mvorbit^2=-Ep=2Ek - objects in circular orbits also satisfy virial theorem!
Stars and Galaxies: Short derivation of virial theorem
start with equation for potential energy:
Ep=-\int_0^{R}\frac{Gm\left(r\right)}{r}\rho4\pi r^2dr
Use hydrostatic equilibrium, \frac{dP}{dr}=-\frac{Gm\left(r\right)\rho}{r^2}, to give:
Ep=-\int_0^{R}\frac{dP}{dr}4\pi r^3dr
Remembering \int\frac{dP}{dr}=P\left(r\right), integrate by parts to get:
Ep=\left\lbrack P\left(r_{}\right)4\pi r^3\right\rbrack^{R}0-3\int_0^{R}P\left(r\right)4\pi r^2dr
Note the first term here is 0 - when r = 0 this is obvious, but remember that at surface (r = R), pressure will equal 0!. We then sub \char"0190 k=\frac32P into the second term:
Ep=-3\int_0^{R}P\left(r\right)4\pi r^2dr=-2\int_0^{R}\char"0190 k\left(r\right)4\pi r^2dr
Note here that as \char"0190 k=\frac{Ek}{V}, total kinetic (thermal) energy inside star is given by Ek=\int_0^{R}\char"0190 \left(r\right)4\pi r^2dr. Our integral is just double this!! therefore is equal to 2Ek, so:
Ep=-2Ek
Stars and Galaxies: Effect of vivial theorem on KH timescale and conclusion of this effect
KH timescale is time for star to radiate all of its potential energy away. It assumes all of the potential energy is radiated away by the star’s luminosity as the star contracts (i.e star temp stays constant).
However, the vivial theorem states that to stay stable, Ep=-2Ek, i.e only half of the potential energy of the star needs to be radiated away as the star contracts while the other half heats the star up
Therefore, the vival theorem increases tKH by a factor of 2 (doubles it). This is still not long enough to match real world observations. The only way to survive longer than tKH is if the star has a source of energy that is not gravitational… Stars “generate” their own energy!
Stars and Galaxies: How much energy does a star need to produce? How does it provide this energy
Must produce enough to maintain hydrostatic equilibrium but no more (or else virial theorem will be violated)
Energy production must exactly balance energy loss at surface (luminosity), or else star will not maintain hydrostatic equilibrium (will expand/contract).
Therefore, luminosity divided by mass gives energy required per kilogram: P=\frac{L}{M}, for sun =\frac{3.828\cdot10^{26}}{1.988\cdot10^{30}}=0.19 mWkg-1
This is very small, but this must be maintained for a very very long time!
For Sun must be maintained for 10 billion years, giving total energy output as E = Pt = 6×10¹³ Jkg-1 (though in reality this is actually a factor of 10 higher as only 10% of star produces energy!)
Total energy needed surpasses that that can be produced by any chemical reaction. Also surpasses gravity (as shown by tKH being around a factor of 100 short). Nucleuar fission provides enough energy but stars contain barely any uranium.
Therefore, nuclear fusion of hydrogen (90% of stars) is used.
Stars and Galaxies: The pp-cycle (overlook)
pp-cycle is the fusion of hydrogen performed in stars. It is made up of 3 steps (see diagram):
Step 1: H + H reaction is extremely slow - time scale (avg. time for reaction to occur) for this reaction to succeed is t = 1.4×10¹⁰ yr so a typical hydrogen atom has to wait 10 billion years before it creates deuteron.
Step 2: The H-2 + H reaction has a time scale of just 6 seconds, so this stage of the reaction happens very fast (He-3 produced very quick once H-2 is finally produced)
Step 3: The He-3 + He-3 reaction takes around a million years (which is still negligible compared to time for first step)
Therefore, the speed of the full sequence is deterimed entirely by the first step
Released energy: he net result is 4 H-1 makes 1 He-4. Each hydrogen nuclei has mass 1.00794 amu, He-4 has mass 4.00260 amu, leaving mass deficit of 0.0292 amu = 4.34×10⁻²⁹ kg (per He-4 atom). E = mc² gives energy released as 4.35×10⁻¹² J
Therefore, energy released per kg of hydrogen burned = 6.54×10^14 Jkg-1. In the case of the Sun, this is more than is neede to maintain hydrostatic equilibrium without breaking virian theorem, hence why only 10% of the Sun’s mass is used in energy production - only the core of stars needs to take part in fusion.
Note, if mass of star drops below 0.08M0 (mass of Sun), the temperature of the core is not hot enough to fuse hydrogen. The star may still initially fuse deuterium (if it has any) but once this is used up it will not be replenished. These objects are known as brown dwarfs.

Stars and Galaxies: How does a star’s expansion control the rate of the pp-cycle?
Experiments on Earth show the rate of the H + H reaction (first step) scales \alpha\rho T^4 . Incease in temperature increases rate of reaction by fourfold, each reaction increases temperature (releases energy as Eth) so a runaway reaction should occur! why doesn’t it?
Reason 1: reaction is very slow (H + H step takes on average 10 billion years to happen) so star has time to adjust to higher rate of energy production.
Reason 2: Virial theorem causes star to “adjust itself” via expansion:
When temp increases, pressure increases (pV = nRT) so pressure gradient goes up, but gravity remains unaffected. Hydrostatic equilibrium is broken.
Increased pressure gradient causes star to expand, converting thermal energy into potential energy. Energy must be conserved so \Delta E\operatorname{th}=-\Delta Ep.
However, to maintain equilibrium, virial theorem requires that \Delta Eth=-\frac12\Delta Ep. Previous equation shows star loses thermal energy by a factor of 2 faster than that. meaning after a reaction, star has excess thermal energy compared to virial theorem.
During expansion caused by increased pressure gradient, thermal energy decreases fast enough that the star can find a new equilibrium (and virial theorem can be restored) before more reactions
Example: Imagine star of temp T and radius R. Temp then increases to 1.01T. Star will expand and a new equilibrium will be found at 1.02R and 0.99T - the star is cooler than before!!. This counters the increase in fusion rate so the energy production decreases and the star will contract again back to it’s original radius and cool back to original temperature, before another reaction can increase temperature again.