Macroeconomics Theme 4 <3
5.0(2)
Studied by 8 peopleCard Sorting
1/178
Earn XP
Description and Tags
Last updated 4:45 PM on 5/6/23
Name | Mastery | Learn | Test | Matching | Spaced | Call with Kai | Chat |
|---|
No analytics yet
Send a link to your students to track their progress
179 Terms
1
New cards
globalisation
the process by which the worlds economies are becoming closely integrated
2
New cards
causes of globalisation
decreased cost of communication
decreased transport costs (containerisation)
reduction in world trade barriers
growth of trading blocs
increased importance of TNCs
decreased transport costs (containerisation)
reduction in world trade barriers
growth of trading blocs
increased importance of TNCs
3
New cards
\
containerisation
containerisation
decreased cost for shipping
less labour and time
economies for scale
increased output
off shoring
less labour and time
economies for scale
increased output
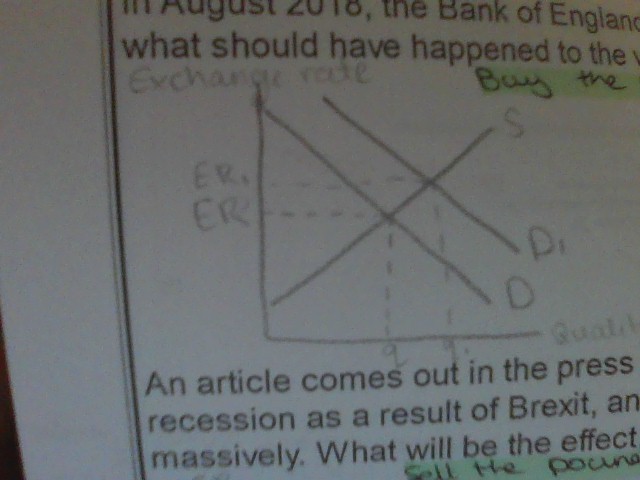
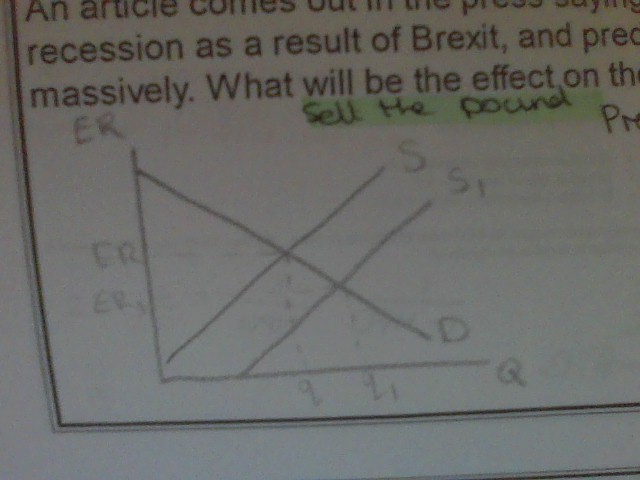
off shoring
4
New cards
characteristics of globalisation
increased trade to GDP ratio
increased FDI and TNC
decrease in global inequality
increased flow of labour
increased capital flow between countries
increased FDI and TNC
decrease in global inequality
increased flow of labour
increased capital flow between countries
5
New cards
benefits of globalisation in LEDCs
higher living standards
economies of scale
reduced absolute poverty
increased tax revenue
technology transfer / new managerial techniques
economies of scale
reduced absolute poverty
increased tax revenue
technology transfer / new managerial techniques
6
New cards
costs of globalisation in LEDCs
negative externalities
overdependence on exports
increased inequality
exploitation of labour
exploitation of resources
tax avoidance
overdependence on exports
increased inequality
exploitation of labour
exploitation of resources
tax avoidance
7
New cards
benefits of globalisation in MEDCs
higher living standards
economies of scale
lower prices
increased consumer choice
economies of scale
lower prices
increased consumer choice
8
New cards
costs of globalisation in MEDCs
overdependence on imports
increased inequality
increased unemployment
increased inequality
increased unemployment
9
New cards
absolute advantage
the ability to produce a good more efficiently
10
New cards
comparative advantage
the ability to produce a good relatively more efficient with a lower opportunity cost
11
New cards
law of comparative advantage
overall output can be increased if individuals or countries specialise in producing goods they have a comparative advantage in
12
New cards
things that determine the global patterns of trade
trading blocs
bilateral agreements
comparative advantage
exchange rates
factor endowment
bilateral agreements
comparative advantage
exchange rates
factor endowment
13
New cards
terms of trade (TOT)
measures the rate of exchange of one product for another when two countries trade
14
New cards
TOT formula
index prices of exports/index prices of imports x 100
15
New cards
trading bloc
free trade area
customs union
common market
monetary union
customs union
common market
monetary union
16
New cards
free trade area
trade barriers are removed between countries but each country can impose its own restrictions on countries outside the area (NAFTA)
17
New cards
customs union
same as free trade area but with a common external tariff (EAC)
18
New cards
common market
same as customs union but free movement of factors of production (EU)
19
New cards
monetary union
same as common market but with a common currency (eurozone)
20
New cards
benefits of free trade
comparative advantage
export led growth
increases in consumer surplus
increased efficiency
access to larger markets
greater political ties
export led growth
increases in consumer surplus
increased efficiency
access to larger markets
greater political ties
21
New cards
costs of free trade
deterioration in the trade balance
danger of dumping
unemployment
contagion
sectoral imbalance
global monopolies
danger of dumping
unemployment
contagion
sectoral imbalance
global monopolies
22
New cards
benefits of monetary union
lower transaction cost to trade
more FDI
reduced currency fluctuations
more FDI
reduced currency fluctuations
23
New cards
costs of monetary union
loss of independent monetary policy
24
New cards
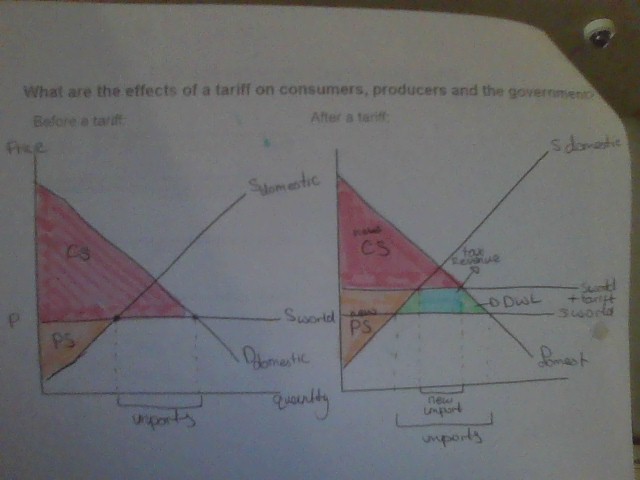
tariff diagram
gain - government through tax revnue - domestic producers (+PS)
loss - consumers (-CS) - global producers
loss - consumers (-CS) - global producers
25
New cards
purpose of protectionism
protect strategic and infant industries
reduced risk of dumping
reduced impact of global monopolies
increased tax revenue
reduced over dependence on imports
reduced risk of dumping
reduced impact of global monopolies
increased tax revenue
reduced over dependence on imports
26
New cards
non tariff barriers
Quotas \n Voluntary Export restraint \n Intellectual property laws \n Technical barriers to trade \n preferential state procurement policies \n domestic subsidies \n currency intervention
27
New cards
balance of payments
record of all payments
monetary transaction between countries
monetary transaction between countries
28
New cards
components of balance of payments
current account
capital account
financial account
capital account
financial account
29
New cards
components of current account
trade in goods
trade in services
current transfers
investment income
trade in services
current transfers
investment income
30
New cards
component of capital account
fixed assets
31
New cards
components of financial account
FDI
hot money
portfolio investment
hot money
portfolio investment
32
New cards
current account deficit causes
structural shift - deindustrialisation \n overvalued exchange rate \n declining TOT \n rising commodity prices
33
New cards
current account surplus causes
export oriented growth \n undervalued exchange rate \n FDI growth \n closed economy \n high domestic savings rates
34
New cards
floating exchange rate
demand and supply of the currency depends on the exchange rate
35
New cards
fixed exchange rate
when the exchange rate is fixed in relation to another country
36
New cards
appreciation
increase in the value of the currency in a floating exchange rate
37
New cards
deppreciation
decrease in the value of the currency in a floating exchange rate
38
New cards
revaluation
increase in the value of the currency in a fixed exchange rate
39
New cards
devaluation
decrease in the value of the currency in a fixed exchange rate
40
New cards
factors influencing exchange rate
relative inflation rates
relative interest rates (hot money)
current account balance
FDI
speculation
relative interest rates (hot money)
current account balance
FDI
speculation
41
New cards
buy the pound
increase IR
return on pound increases
more demand for pound
appreciation of pound
return on pound increases
more demand for pound
appreciation of pound
42
New cards
sell the pound
prediction of UK recession
investors sell pound
more supply of pound
depreciation
investors sell pound
more supply of pound
depreciation
43
New cards
arguments for a floating currency
automatic correction of current account deficit
no problem with lack of currency reserves
insulation from external economic events
govt can use IR to change AD
no problem with lack of currency reserves
insulation from external economic events
govt can use IR to change AD
44
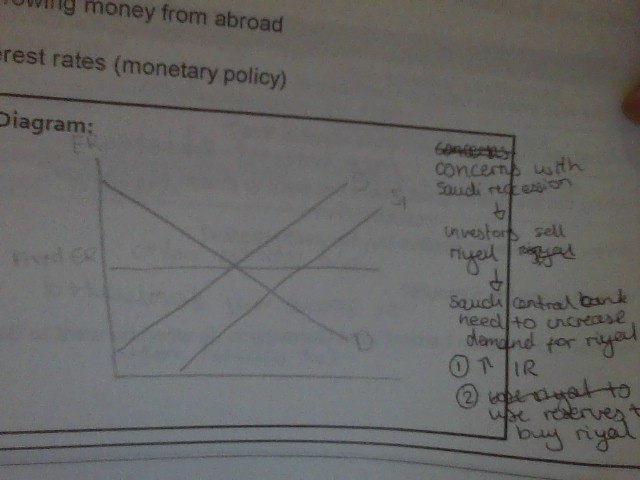
New cards
maintaining a fixed exchange rate
using reserves
borrowing money from abroad
interest rates
borrowing money from abroad
interest rates
45
New cards
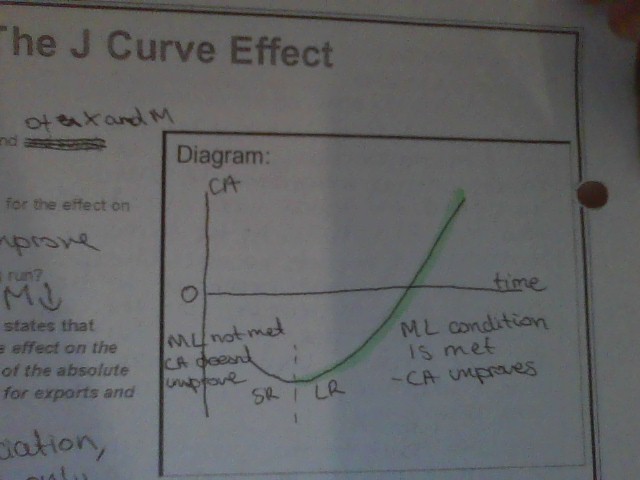
J curve effect
after a currency depreciation
current account will worsen in the short run
then improve in the long run
current account will worsen in the short run
then improve in the long run
46
New cards
marshal lerner condition
if there is a depreciation then the current account will only improve if the PED of exports + the PED of imports > 1
47
New cards
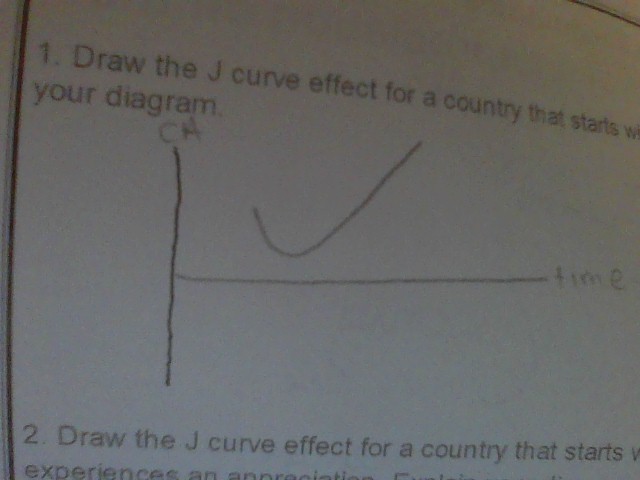
J curve for a current account surplus
48
New cards
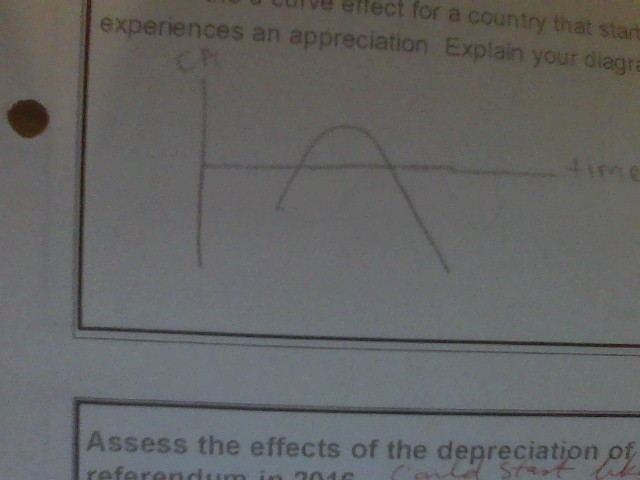
J curve for a current account deficit
49
New cards
depreciation leading to inflation COR
depreciation of currency
increase price of importing raw materials or capital goods
increased cost for firms
decrease SRAS
cost push inflation
increase price of importing raw materials or capital goods
increased cost for firms
decrease SRAS
cost push inflation
50
New cards
depreciation causes TNC
depreciation of currency
cheaper for TNC to invest (china-belt and road)
build bridges, roads and dams
increase AD and LRAS
long run economic growth
cheaper for TNC to invest (china-belt and road)
build bridges, roads and dams
increase AD and LRAS
long run economic growth
51
New cards
competitiveness
measure of a countries ability to sell its goods on international markets at a price attractive in those markets
52
New cards
measuring competitiveness
relative export prices
relative unit labour cost
relative unit labour cost
53
New cards
pillars of the Global competitive index (GCI)
institution
infrastructure
ICT adoption
health
macroeconomic objectives
labour market
market size
innovation capability
infrastructure
ICT adoption
health
macroeconomic objectives
labour market
market size
innovation capability
54
New cards
factors influencing competitiveness
unit labour cost
productivity
exchange rate
labour taxes or subsidies
govt laws and regulations
research and development
productivity
exchange rate
labour taxes or subsidies
govt laws and regulations
research and development
55
New cards
UK tax breaks for R+D to improve competitiveness COR
tax breaks for R+D
incentives to investment in R+D
technological spill over
gain a comparative advantage in tech
increase in FDI
increase productivity
increase in relative export prices
increase in competitiveness
incentives to investment in R+D
technological spill over
gain a comparative advantage in tech
increase in FDI
increase productivity
increase in relative export prices
increase in competitiveness
56
New cards
UK tax breaks for R+D to improve competitiveness EV
uk govt has a high national debt
they cant be sure all firms will use the tax breaks effectively
this leads to a high opportunity cost
they cant be sure all firms will use the tax breaks effectively
this leads to a high opportunity cost
57
New cards
UK deregulation improve competitiveness COR
leaving the EU
allows the UK the ability to cut regulation (in financial sector)
lowers compliance cost
fall in COP
fall in relative export prices
increase in competitiveness
allows the UK the ability to cut regulation (in financial sector)
lowers compliance cost
fall in COP
fall in relative export prices
increase in competitiveness
58
New cards
UK deregulation improve competitivenes EV
market failure
negative externalities are a risk in the financial sector
can affect growth of competitiveness in the future
negative externalities are a risk in the financial sector
can affect growth of competitiveness in the future
59
New cards
improving access to vocational education improve competitiveness COR
increases access to apprenticeship scheme
help young people get specialised skills (digital literacy)
increases quality of human capital
increases productivity
decreases unit labour cost
increases competitiveness
help young people get specialised skills (digital literacy)
increases quality of human capital
increases productivity
decreases unit labour cost
increases competitiveness
60
New cards
improving access to vocational education improve competitiveness EV
rapid automation
risk of unemployment for those with vocational training
occupational mobility of labour (too specialised and jobs may be replaced)
risk of unemployment for those with vocational training
occupational mobility of labour (too specialised and jobs may be replaced)
61
New cards
improving infrastructure to improve competitiveness COR
infrastructure project (financed by china)
attracts FDI
belt and road initiative
decrease transport costs
attracts further FDI
increase geographical mobility of labour
increase knowledge transfer and technological spillover
increases productivity
increases competitiveness
attracts FDI
belt and road initiative
decrease transport costs
attracts further FDI
increase geographical mobility of labour
increase knowledge transfer and technological spillover
increases productivity
increases competitiveness
62
New cards
improving infrastructure to improve competitiveness EV
countries may be dependent on chinese imports in the future as part of the agreement
63
New cards
absolute poverty
when a person has insufficient resources to meet basic human needs
64
New cards
absolute poverty figure
less than $2.15 PPP a day
65
New cards
causes of absolute poverty
population growing faster than GDP in low income countries
severe savings gap
absence of basic public services
effects of corruption
high levels of debt and high interest rates
damaging effects of civil wars and natural disasters
low employment rates, vulnerable jobs and poverty wages
absence of basic property rights
severe savings gap
absence of basic public services
effects of corruption
high levels of debt and high interest rates
damaging effects of civil wars and natural disasters
low employment rates, vulnerable jobs and poverty wages
absence of basic property rights
66
New cards
relative poverty
when a person is poor compared to others in society
67
New cards
relative poverty figure
below 60% of median household income
68
New cards
reasons for a fall in relative poverty
increase of age of leaving school from 16 to 18
furlough scheme
more uni students
lower unemployment
furlough scheme
more uni students
lower unemployment
69
New cards
reasons for a rise in relative poverty
economic consequences of brexit
wages not rising in proportion to inflation
increase in tuiton fees
increase in zero hour contracts
increase in automation
austerity
wages not rising in proportion to inflation
increase in tuiton fees
increase in zero hour contracts
increase in automation
austerity
70
New cards
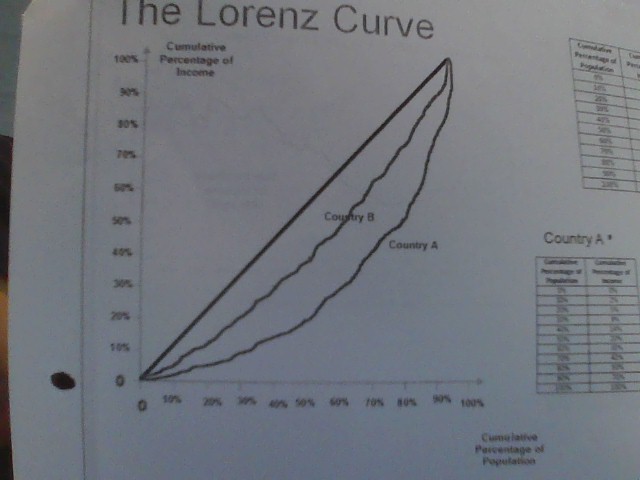
lorenz curve
used to compare inequality between countries
71
New cards
gini coefficient
A/A+B
value of 0 is total equality (line of perfect equality)
value of 1 is total inequality
higher the gini coefficient the more unequal
value of 0 is total equality (line of perfect equality)
value of 1 is total inequality
higher the gini coefficient the more unequal
72
New cards
causes of inequality for a developed economy
austerity
automation
access to higher education
unemployment
deindustrialisation (lack of secondary sector)
inheritance tax
automation
access to higher education
unemployment
deindustrialisation (lack of secondary sector)
inheritance tax
73
New cards
causes of inequality for a developing economy
corruption
access to finance
property laws
TNCs (monopsony power to set wages)
access to primary/secondary education
prevalence of subsistence farming
savings gap
access to finance
property laws
TNCs (monopsony power to set wages)
access to primary/secondary education
prevalence of subsistence farming
savings gap
74
New cards
causes of inequality
war/conflict
tax system
social protection (pensions + benefits)
trade unions
healthcare
globalisation
tax system
social protection (pensions + benefits)
trade unions
healthcare
globalisation
75
New cards
austerity
deliberate cuts to government spending
rises in taxes to reduce national debts
rises in taxes to reduce national debts
76
New cards
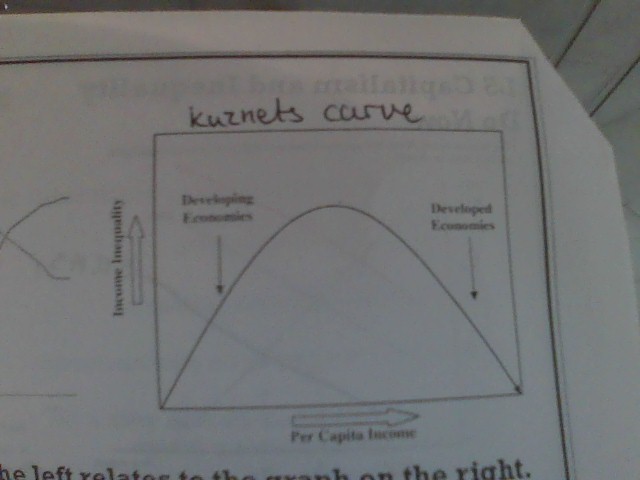
kuznets curve
as income per capita increases in a developing economy then income inequality increases
as income per capita increases in a developed economy then income inequality decreases
as income per capita increases in a developed economy then income inequality decreases
77
New cards
human development index (HDI)
measurement of how developed an economy is
78
New cards
Human development indicator
life expectancy index - long and healthy life - life expectancy at birth
education index - knowledge - expected years of schooling and mean years of schooling
GNI index - decent standard of living - GNI per capita
education index - knowledge - expected years of schooling and mean years of schooling
GNI index - decent standard of living - GNI per capita
79
New cards
advantages of HDI
takes into account remittances
80
New cards
disadvantages of HDI
doesnt take into account
\-distribution of income
\-gender equality
there is a risk of missing data
\-distribution of income
\-gender equality
there is a risk of missing data
81
New cards
primary product dependence (PPD)
when an economy main exporter is primary product
82
New cards
extreme price fluctuations (PPD) COR
primary products experience high levels of price volatility
PED inelastic (neccessity)
PES inelastic (havest once a year)
large fluctuations in price
uncertainty about revenue
lack of investment in capital good
lower productivity
lower growth
PED inelastic (neccessity)
PES inelastic (havest once a year)
large fluctuations in price
uncertainty about revenue
lack of investment in capital good
lower productivity
lower growth
83
New cards
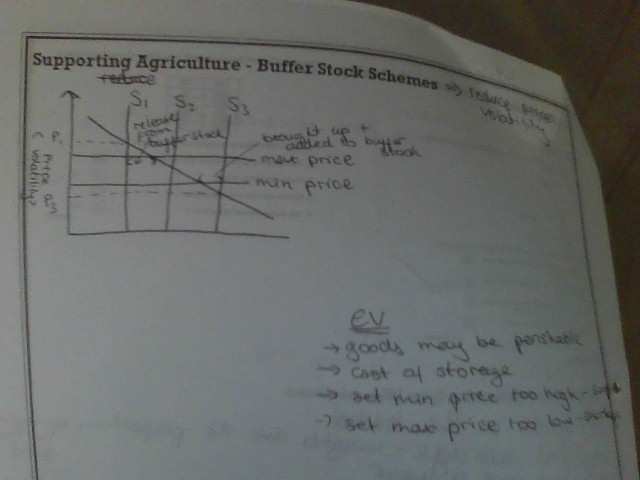
extreme price fluctuations (PPD) EV
buffer stock scheme to reduce price volatility
when there is a good harvest and the supply is high the government buys up the stock to increase the price
when there is a bad harvest and the supply is low the government releases the stock to decrease the price
when there is a good harvest and the supply is high the government buys up the stock to increase the price
when there is a bad harvest and the supply is low the government releases the stock to decrease the price
84
New cards
fluctuations in foreign exchange (PPD) COR
PPD price fluctuations
export revenue fluctuates
fluctuates in foreign exchange
hard to import capital goods
limits growth of secondary sector
lower productivity
lower growth
export revenue fluctuates
fluctuates in foreign exchange
hard to import capital goods
limits growth of secondary sector
lower productivity
lower growth
85
New cards
fluctuations in foreign exchange (PPD) EV
countries like saudi arabia have successfully used export revenue from oil to diversify their economy into sectors such as tourism
86
New cards
natural resource curse (PPD) COR
countries with high reserves of commodities
and have weak legal institutions (due to colonialism)
have a high risk of corruption
can lead to rent seeking govt officials that retain oil revenue for themselves
this increases corruption levels
makes it harder for the govt to enact supply side policies
lower growth and economic development
and have weak legal institutions (due to colonialism)
have a high risk of corruption
can lead to rent seeking govt officials that retain oil revenue for themselves
this increases corruption levels
makes it harder for the govt to enact supply side policies
lower growth and economic development
87
New cards
natural resource curse (PPD) EV
legal institutions can be strengthened through IMF or world bank reforms
88
New cards
prebisch singer hypothesis (PPD) COR
demand and price of primary product rises slower relative to the demand and price of secondary products
this means the terms of trade for PPD countries fall
which makes it challenging for the country to import capital goods
this constraints the growth of the secondary sector
which limits economic growth
this means the terms of trade for PPD countries fall
which makes it challenging for the country to import capital goods
this constraints the growth of the secondary sector
which limits economic growth
89
New cards
prebisch singer hypothesis (PPD) EV
some countries have successfully specialised in cash crops which have seen an increase in demand so TOT would not fall
90
New cards
dutch disease (PPD) COR
discovery of natural resources
more exports of that good
more demand for that currency
appreciation
makes non mining exports more expensive
less competitive so countries stay reliant on primary sector
low growth
more exports of that good
more demand for that currency
appreciation
makes non mining exports more expensive
less competitive so countries stay reliant on primary sector
low growth
91
New cards
dutch disease (PPD) EV
the growth of the primary sector can attract FDI which can provide funds for diversitification
92
New cards
barriers to household form accessing financial services
lack of education
lack of assets
costs
travel distance
lack of assets
costs
travel distance
93
New cards
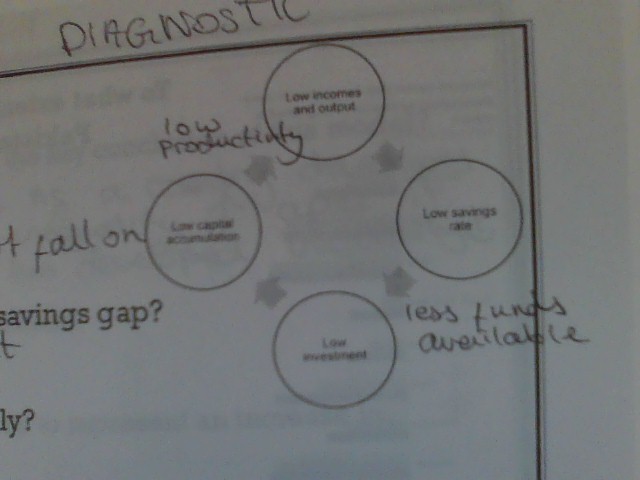
the harrod domar model (savings gap)
low incomes
low savings rate
less funds available
low investment
low capital accumulation
low productivity
low income and output
low savings rate
less funds available
low investment
low capital accumulation
low productivity
low income and output
94
New cards
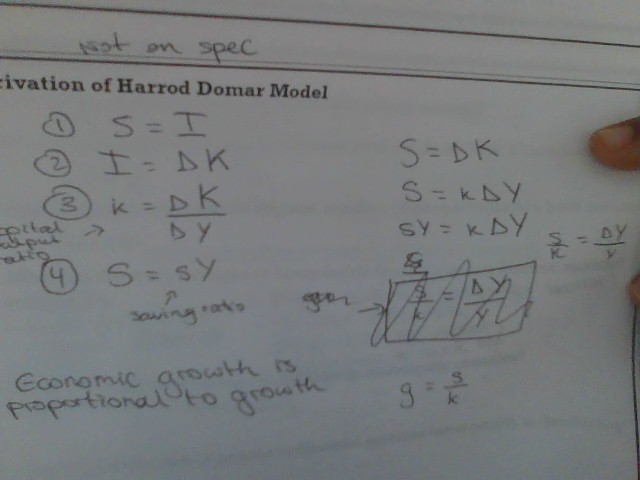
harrod domar model equation
growth rate = savings ratio / capital output ratio
g=s/k
g=s/k
95
New cards
fixing the savings gap
attract FDI to boost investment
use aid to boost income
use aid to boost income
96
New cards
challenges to accessing a good quality education in a developing country
cost of education
infrastructure
lack of teachers
needing children to work or care for siblings
gender inequality
information gap
quality of education
infrastructure
lack of teachers
needing children to work or care for siblings
gender inequality
information gap
quality of education
97
New cards
corruption : lack of legal institutions
government officials may be rent seeking
results in an inefficient allocation of resources
can increase the cost of doing business (bribs)
results in an inefficient allocation of resources
can increase the cost of doing business (bribs)
98
New cards
transfer pricing (tax avoidance) : lack of legal institutions
TNC artificially records profits as being made in a tax haven
subsidiary company trade and sell at a low price to a subsidiary company in a tax haven
then they would sell at a high price to other countries
the resources are never transported to the tax haven
subsidiary company trade and sell at a low price to a subsidiary company in a tax haven
then they would sell at a high price to other countries
the resources are never transported to the tax haven
99
New cards
property rights : lack of legal institutions
intellectual property rights (patents) - lack of enforcement so less innovation
assets (land and housing) - cant use this for collateral so they struggle to access financial services
assets (land and housing) - cant use this for collateral so they struggle to access financial services
100
New cards
informal lender : lack of financial institution
''loan sharks''
IR becomes very high leading to more debt
lack of regulation
IR becomes very high leading to more debt
lack of regulation