BAFI 355 final
1/71
There's no tags or description
Looks like no tags are added yet.
Name | Mastery | Learn | Test | Matching | Spaced | Call with Kai |
|---|
No analytics yet
Send a link to your students to track their progress
72 Terms
Revenue Recognition Principle
Revenue is recorded when it is earned, not when cash is received. “Earned” usually means the company has delivered goods or provided services. Prevents firms from inflating revenues by recording them early
Expense Matching Principle
Expenses must be recorded in the same period as the revenues they helped generate. Core idea of accrual accounting. Prevents firms from shifting expenses into different periods to manipulate earnings
Conservatism Principle
When in doubt, choose the accounting method that understates assets and income rather than overstates them. Record losses when they are probable. Record gains only when they are realized or virtually certain. Purpose: avoid overly optimistic financial reporting.
Cash conversion cycle
attempts to measure how long (in days) each net input dollar is tied up in the production and sales process before it gets converted into cash received. The shorter the cash conversion cycle, the better the company is at selling inventories and recovering cash from these sales while paying suppliers
DSO
number of days, on average, it takes a company to collect its receivables
DIO
the number of days, on average, it takes a company to turn its inventory into sales
DPO
the number of days, on average, it takes a company to pay back its payables
GAAP cash flow
used for regulatory financial reporting and compliance purposes
Unlevered Free Cash Flow
used largely for valuation and project evaluation purposes
EBITDA
Earnings before interest, taxes, depreciation, and amortization. A proxy for cash flow, used for valuation purposes and for credit analysis. Some, including Warren Buffett, call EBITDA meaningless because it omits capital costs
Returns to shareholders
Return on equity is one of the most comprehensive financial accounting measures of the “success” of the “business cycle”, where Return on Equity (ROE) = Net Income / Shareholders’ Equity,
Profitability
what’s left for shareholders after everyone else is “paid”
Productivity
how many sales dollars result from a dollar investment in net assets
Leverage
the net assets “levered” by owners’ equity
Elements of financial planning
Investment in new assets – determined by capital budgeting decisions
Degree of financial leverage – determined by capital structure decisions
Cash paid to shareholders – determined by dividend policy decisions
Liquidity requirements – determined by net working capital decisions
Role of financial planning
Examine interactions – help management see the interactions between decisions
Explore options – give management a systematic framework for exploring its opportunities
Avoid surprises – help management identify possible outcomes and plan accordingly
Ensure feasibility and internal consistency – help management determine if goals can be accomplished and if the various stated (and unstated) goals of the firm are consistent with one another
Pro forma statement
setting up the plan using projected financial statements allows for consistency and ease of interpretation
pro forma statement applications
assessing financial (funding) needs, valuation purposes
pro forma Income statement % of sales
Costs may vary directly with sales – if this is the case, then the profit margin is constant. Depreciation and interest expense may not vary directly with sales – if this is the case, then the profit margin is not constant. Dividends are a management decision and generally do not vary directly with sales – this influences additions to retained earnings
Pro forma balance sheet % of sales
Initially, assume all assets, including fixed, vary directly with sales. Accounts payable will also normally vary directly with sales. Notes payable, long-term debt, and equity generally do not vary directly with sales because they depend on management decisions about capital structure. The change in the retained earnings portion of equity will come from the dividend decision.
perfect positive correlation
both the return on security A and the return on security B are high than average at the same time and lower at the same time
Perfect negative correlation
security A has a higher than average return when security B has a lower than average return, and vice versa
zero correlation
the return on secutirty A is completly unrelated to the return on security B
Why to diversify
The standard deviation of the portfolio is lower than the weighted average standard deviation because of correlation → The key benefit of diversification. Reduces risk
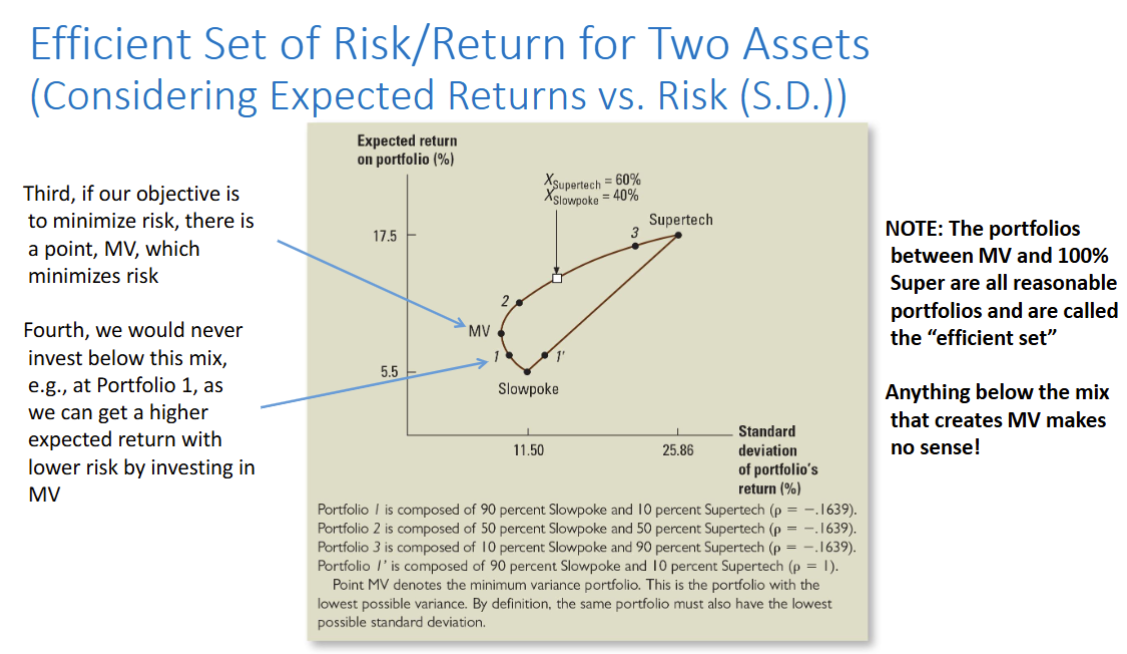
Efficient set of risk/return for two assets
Anything lower than MV (minimum variance) is inefficient, The minimum variance portfolio is the point on the efficient frontier with the lowest possible risk. It does not use expected returns at all — only variances and correlation. If correlation is low (especially negative), MV weight shifts away from the riskier asset
Actual returns
function of both what was expected (E(R)) and what was a surprise (or unexpected) There are “surprises” (events that investors were not expecting)
Systematic risk
those that influence all stocks
Unsystematic risk
those that influence a specific stock; or idiosyncratic risk, As a portfolio manager, trying to reduce/avoid unsystematic risk, can’t do anything about systematic risk reall
Benefits of diversification
can diversify away unsystematic risk, Average level of risk is 20%, sweet spot/average# of stocks is 30
Initial Public Offering (IPO)
An IPO refers to the process of offering shares of a private corporation to the public in a new stock issuance for the first time. An IPO allows a company to raise equity capital from public investors. IPO S1 form
Primary vs Secondary Markets
Primary market refers to share sales by the company (like in an IPO), Secondary market refers to the selling/trading of those shares between investors (after the company has already sold them). This occurs in the stock market
Absolute (Intrinsic) Valuation
models attempt to find the intrinsic or "true" value of an investment based only on fundamentals (dividends, cash flow, growth rate, etc.). We focus on the company in question only. Models that apply: Dividend discount model, Discounted cash flow model, Residual income model, Asset-based mode.
Relative Valuation
models, in contrast, operate by comparing the company in question to other similar companies. These methods involve calculating multiples and ratios. Comparables and multiples
Valuation multiples
This is the most widely-used approach to value a stock. The concept is that the current price is a “multiple” of cash flow or earnings per share, such as: Price = Target or benchmark multiple * EPS, Note that in this approach we’re really using historical results (historical earnings per share) rather than a forward looking metrics, so keep that in mind (valuations should really be forward-looking). Two of the most widely used multiples are PE and EV/EBITDA. Let’s explore them in more detail in the next few slide
P/E ratio
Analysts consider the trailing P/E as a kind of price tag on earnings, Generally, a high P/E ratio means that investors are anticipating higher growth in the future, thus why they give the company a higher valuation, Lower PE ratio means that you’re paying less for the same level of earnings, Companies that are losing money do not have a P/E ratio. Also, companies that just recently turned a profit will have meaningless PE ratios
Enterprise value
measure of a company's total value. This is a theoretical takeover price if a company were to be bought. We use this concept in our DCF calculation when we want to calculate the per share value of the stock we’re analyzing
Enterprise Value/EBITDA
used to compare the entire value of a business with the amount of EBITDA it earns on an annual basis. This ratio tells investors how many times EBITDA they would have to pay if they were to acquire the entire business
Why EBITDA multiples
EBITDA is a “proxy” for cash flow because it adds back the largest non-cash charges (Depreciation and Amortization). The information is readily available from a company’s financial statements The drawback of using EBITDA? EBITDA doesn’t reflect how much debt a company utilizes (EBIT is a metric before we have paid Interest Expenses, therefore it’s not influenced by debt), On the other hand, PE ratio does better reflect the level of debt of a firm since it uses Earnings in its denominator (and earnings is a metric that we get after we pay our Interest Expenses
WACC
weighted average cost of capital, discount rate
What is cost of capital
The discount rate is the rate used to bring the future calculated cash flows to the present. In finance we use the cost of capital, or WACC, as our discount rate. It is the required after-tax return on all capital deployed (debt and equity). Sometimes also referred to as the “hurdle rate” (minimum rate of return on a project or investment required by a company or investor), Individual projects, differentiated by risk, Divisions, differentiated by risk, Overall enterprise, The focus of this lecture will be on the overall enterprise
What is WACC used for
Evaluating projects (go/no go), Remember IRR and selecting projects that were above the hurdle rate? Determining whether divisions or overall company is generating sufficient earnings relative to capital deployed, Whether stock price is fairly valued, Put simply, it’s the underpinning of determining the appropriate discount rate in valuation models
Market value of equity
is share price times the number of fully diluted shares (also called market capitalization or market value)
Cost of debt (Rd)
The cost of debt can be observed in the marketplace, Most practitioners use the yield-to-maturity for an intermediate term bond (say, 10 years)
Yield to maturity approach
The yield to maturity (YTM) is the rate at which the current market price of the bond is equal to the present value of all the cash flows from the bond. 1) Calculate the YTM of all publicly traded company debt (sometimes this is available with a Bloomberg terminal or Morningstar database), 2) Calculate the weighted average of all debt instruments
Estimation Based on Interest Rate
Very widely used but it has its drawbacks:
the cost of debt calculated this way will remain the same regardless of market conditions (boom or recession) since the company is obligated to make the same interest rate payments regardless. This is inaccurate as the existing market value of the debt will change under certain market conditions, This approach should be used if the previous approaches are not feasible, The approach is simple: Divide the interest expense by the firm’s debt obligations (Short + Long Term Debt)
Capital Asset Pricing Model (CAPM)
CAPM describes the measure of systematic risk (the volatility) of the asset relative to the market. NOT idiosyncratic risk
Beta
measure of systematic risk, forward looking estimate
A measure of volatility of a security compared to the market as a whole (usually the S&P 500, which has a beta of 1.0). Stocks with betas higher than 1.0 are interpreted as more volatile than the S&P 500.
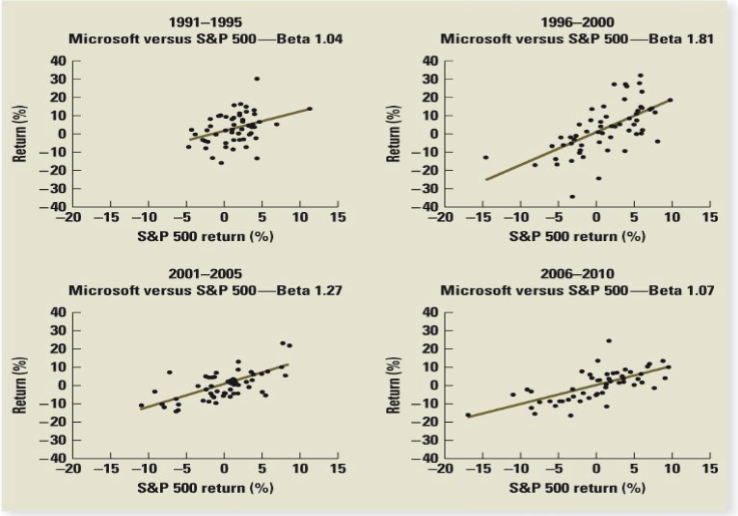
Beta as a slope
the more flat the line, the less volatile
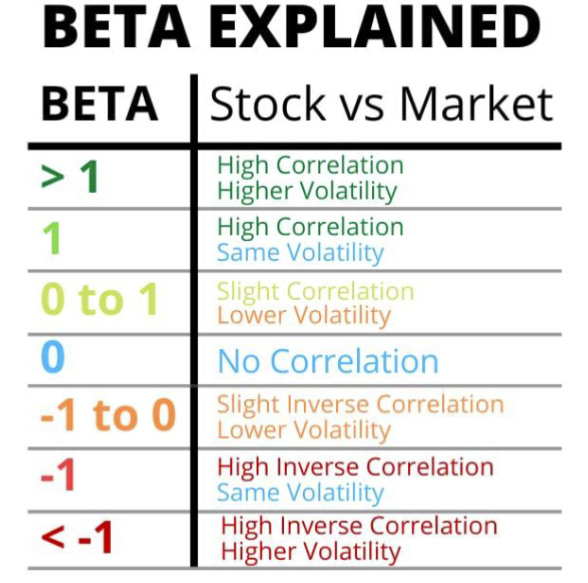
Beta values explained
β > 1 = more volatile than the market.
β < 1 = less volatile.
β = 1 = moves with market
Beta approach #1
Get your beta from a financial source such as Bloomberg, Yahoo Finance, etc. It’s fast and easy, but we would be blindly using a number without understanding if there’s any potential extreme outliers that are throwing off my beta (remember our in-class example of GameStop?)
Beta Approach #2 (Preferred over #1)
regression beta, Calculate it yourself by running a regression on the returns vs a benchmark. Note that this should get us to about the same answer as approach #1, but you will be able to control the variables (weekly vs monthly returns, time period, etc.), Remember that sometimes 1 extreme outlier could throw off our results, in which case you should apply your judgment and potentially remove some outliers
Calculate: The β of the market as a whole is 1 (if we plot returns of the market vs. itself, the slope will be 1) Also, by definition, if we take the weighted average of individual β’s across the whole market, these will also add to 1. In general we use monthly prices for the last 5 years, Calculate monthly returns, Use the SLOPE() function to calculate the slope of the curve.
Approach #3 – Bottom Up Beta (if time allows)
Bottom-Up Beta: beta for a company calculated from the ground up rather than by using a regression analysis. This bottom-up beta is derived from the regression beta of the industry based on the business we’re in and the leverage rate our company has chosen.
Beta as a measure of risk
not a perfect measure of risk: it has a high standard error
Issues with CAPM beta
It has a high standard of error. This means that the beta coefficient could be wrong,It reflects the firm's business mix over the period of the regression, not the current mix, It reflects the firm's average financial leverage over the period rather than the current leverage, Even regressions that look good could be misleading, How you set up the regression will impact beta
Levered beta
measures the risk of a firm (with debt and equity in its capital structure) to the volatility of the market. A regression beta is basically a “levered beta.” Approaches #1 and #2 calculate the levered beta since we haven’t made any adjustments to subtract the company’s debt.
Unlevered beta
removes any beneficial or detrimental effects gained by adding debt to the firm's capital structure. In other words, it represents the risk of an unlevered company relative to the market. It includes business risk but does not include leverage risk. This requires manual calculations
Advantages of Bottom Up Beta vs Regression Beta
A regression beta has a high standard error, but by calculating an industry beta and then deriving the company beta, the bottom-up beta will have a lower standard error than the regression beta, This is because of the law of large numbers. When calculating the beta for the industry, some of the betas of those individual companies are overestimated, and some are underestimated. When you average them out, you average out the “mistakes” and get to a more precise beta., You can use bottom-up beta for a relatively new public company that has little historical data, for a private company, or even for divisions of companies
Disadvantages of Bottom Up Beta vs Regression Beta
Cumbersome to calculate and time-consuming, Could be hard to identify a larger set of comparable companies that operate in the industries where our company operates in order to calculate a representative industry beta
Terminal value
the value of a business/project beyond the forecasted period when future cash flows can be estimated. It assumes the company will reach a mature stage of development where its operations will stabilize and grow at a set growth rate forever after the forecast period
Interest rate formula
interest expense / (current maturities + long term debt)
Tax rate formula
tax expense / pre tax income
Cash plug formula
total liabilities and equity - (accounts receivable + inventory + other current assets+ net ppe)
Net ppe formula
last years net ppe + capital expenditures - depreciation
Owners equity formula
last years owners equity + forecasted net profit
Negative sign when calculating change
account receivable, inventory, current assets
EBIT formula
operating profit
Terminal value formula
UFCFS ( of terminal year) * (1+ terminal growth rate)/ (discount rate - terminal growth rate)
Implied enterprise value formula
PV of terminal value + sum of present value of UFCFS
Implied equity value formula
implied enterprise value - total debt + cash and cash equivalents
Implied share price formula
implied equity value/shares outstanding
Cash from operations formula
net income + depreciation + change in net working capital
Change in cash formula
cash from operations - cash used in investing + cash used in financing (if negative)