Statistics - Effect Size & Power
1/51
Earn XP
Name | Mastery | Learn | Test | Matching | Spaced | Call with Kai |
|---|
No analytics yet
Send a link to your students to track their progress
52 Terms
Level of significance
⍺ level
Probability of committing a type I error.
Type 1 error
Reject null and accept alt hypothesis.
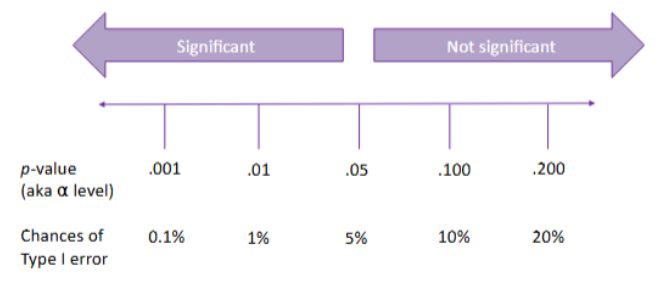
Significance level
Significance level (i.e., p-value) is the likelihood of observing a trend in the sample (H1) if there is not a trend in the population (H0).
True or false: Significant results are always meaningful results.
False: With a sufficiently large sample, a statistical test will almost always return a significant result.
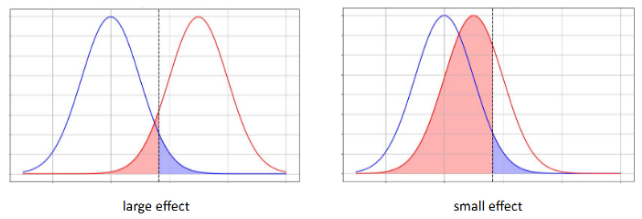
Effect size (3 points)
A measure of the magnitude/strength of a difference or relationship.
It is independent of sample size.
Helps quantify practical significance (i.e., importance) – can be compared across studies.
Common effect size measures
Cohen’s d for t-tests
(Partial) Eta squared for ANOVAs
Pearson’s r for correlations
Cramer’s V for Chi-square
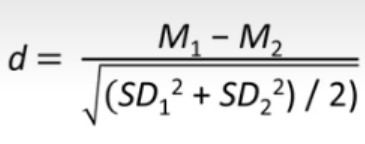
Cohen’s d
Measure of effect size when comparing two groups (i.e., t-tests): Standardised mean difference.
Cohen’s d - ≥.20
Small effect
Cohen’s d - ≥.50
Medium effect
Cohen’s d - ≥.80
Large effect
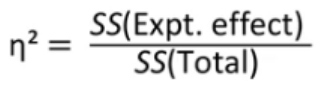
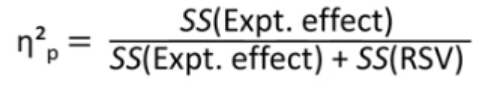
(Partial) Eta Squared
Measure of effect size for ANOVAs: Proportion of variance explained.
Eta Squared - one-way ANOVA formula
Partial eta Squared - two-way ANOVA formula
η2/η2p - ≥.01
Small effect
η2/η2p - ≥.06
Medium effect
η2/η2p - ≥.13
Large effect
Sample size - when should one stop testing?
Consider a smaller difference between participant mean scores to reach significance for a small effect.
Consider more variance - less participants for a small effect.
Consider a more important effect
Resource constraints: Limited resources constrain how many participants can be tested.
Sample size of previous research: Can expect that the same participant number from significant previous research would give the same result.
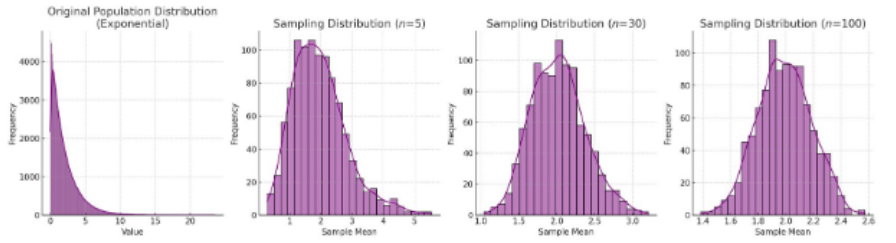
Central limit theory
Central limit theorem (3 points)
Says that the distribution of sample approximates a normal distribution as sample size gets larger.
Sufficiently larger sample sizes can predict the characteristics of a population more accurately.
Sample size equal to or greater than 30: considered sufficient for theorem to hold.
Priori power analysis (2 points)
Works out how many participants are needed to reliably detect an effect of a certain size or larger.
A priori because it is conducted before data collection.
β level
The probability of making a Type II error (usually set at .200).
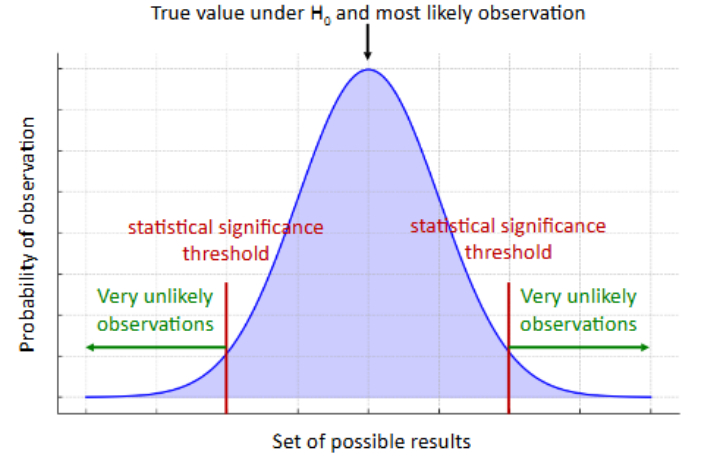
Graph - hypotheses, levels, power
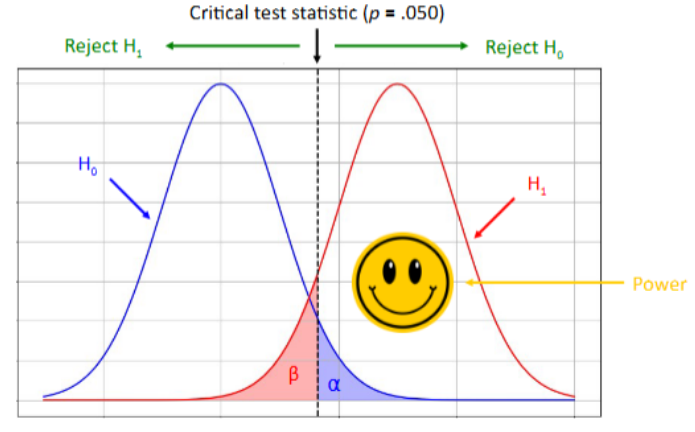
Power (3 points)
The ability to detect a significant effect if H1 is true.
Power = 1 - β
Power helps us make sense of results that are not significant or results that are statistically but not practically significant.
If we set β at .20, power will be…
.80 (80%)
Power = 1 - β
.80 = 1 - .20
The power of a statistical test depends on 4 parameters…
⍺ (aka significance level)
Effect size
Sample size
Power (1 - β)
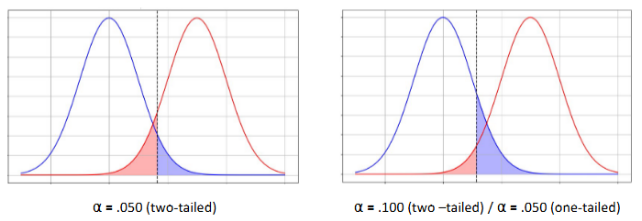
Power and ⍺ (2 points)
Smaller β = Increased power.
More lenient ⍺, the more statistical power a test will have.
Power and effect size (2 points)
The larger the effect, the more likely that the effect will be detected.
Small effect = Increased β = Decrease in power
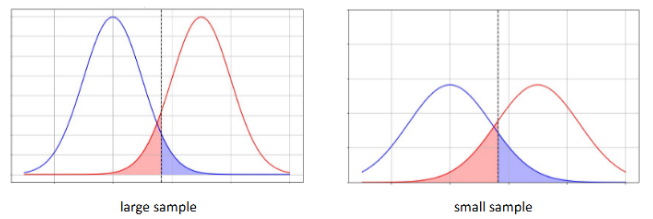
Power and sample size (3 points)
The larger the sample size, the more likely that the effect will be detected.
Increased β = Decreased power
Larger the sample size, higher the power.
Ways to increase power of a test (5 points)
Set a less stringent significance level (but not usually done in Psychology) or consider a one-tailed test (but this should be based on theory / previous research).
Increase effect size by:
Increase the predicted difference between population means
Decrease the population standard deviation - more controlled environments? Clear procedures?
Increase sample size
Given any 3 parameters of power analysis, we can…
Estimate the 4th
Post-hoc power analysis (3 points)
Determines the power of a test by looking at significance level, effect size and sample size.
We can look at whether a non-significant result is likely to be due to a lack of power.
Post-hoc because it is conducted after data collection.
Effect size for priori power analysis (5 points)
Based on a previous / pilot study
Exact effect size from a previous / pilot study.
Assumes the conditions to be similar enough to your study.
Based on general benchmarks
Effect size benchmarks (i.e., small, medium, and large).
Helpful when previous studies do not provide a consistent effect size.
F test in G*Power
ANOVA
How to use G*Power (9 steps)
Select the test you used from test family.
Select the statistical test you used.
Choose the type of power analysis you want to use.
Select the tailedness you want to use.
Input the effect size if you have it - if not, click the determine button. Input the means and standard deviations, and click calculate.
Make sure alpha level is at .05.
Input sample sizes.
Click calculate in the bottom right hand corner.
Power given in power (1-beta err prob).
How to G*Power - t-test post hoc (9 steps)
Select t-test from test family.
Select Means: difference between two independent means (two groups) under statistical tests.
Select post hoc in type of power analysis.
Select tailedness.
If you don’t have the effect size, click the determine button and select n1 = n2. Input the means and standard deviations, and click calculate.
Make sure alpha level is at .05.
Input sample sizes for both groups.
Click calculate in the bottom right hand corner.
Power given in power (1-beta err prob).
Power under .8
The test is non-significant - should not conclude that there was no difference, but that there was not sufficient power to detect a difference.
How to G*Power - paired/t-test priori analysis (9 steps)
Select t-test from test family.
Select Means: difference between two independent means (two groups) under statistical tests / Paired: Means: difference between two dependent means (two groups) under statistical tests.
Select priori in type of power analysis.
Select tailedness.
If you don’t know effect size, click the determine button and select n1 = n2. Input the means and standard deviations, and click calculate.
Make sure alpha level is at .05.
Put power as .8.
Put allocation as 1.
Click calculate in the bottom right hand corner.
Statistical tests in G*Power (2 points)
Top 3 mean options - parametric tests.
Bottom 3 mean options - non-parametric tests.
Sample sizes through priori power analysis
Tell you how many participants you need to get the same effect size as in the original study.
Effect Size for ANOVAs in G*Power
G*Power does not use η2 as the effect size for ANOVAs. It uses a measure that is named f (not to confuse with F!).
f - ≥.10
Small effect
f - ≥.25
Medium effect
f - ≥.40
Large effect
How to G*Power - one-way ANOVA post hoc (10 steps)
Select F tests from test family.
For a one-way ANOVA, choose 'ANOVA: fixed effects, omnibus, one-way' under statistical tests.
Choose post hoc under type of power analysis.
If you don’t know effect size, click determine, choose 'effect size from variance' under select procedure, click direct.
Input η2p, which is .13??
Click calculate and transfer to main window.
Set alpha level to .05.
Input total sample size.
Input number of groups.
Select calculate in bottom right hand corner. If there's a pop-up, just click okay.
How to G*Power - one-way ANOVA priori analysis (11 steps)
Select F tests from test family.
For a one-way ANOVA, choose 'ANOVA: fixed effects, omnibus, one-way' under statistical tests.
Choose priori under type of power analysis.
If you don’t know effect size, click determine, choose 'effect size from variance' under select procedure, click direct.
Input η2p, which is .13??
Click calculate and transfer to main window.
Set alpha level to .05.
Input total sample size.
Input number of groups.
Put power as .8.
Select calculate in bottom right hand corner. If there's a pop-up, just click okay.
How to G*Power - two-way ANOVA post hoc (11 steps)
Select F tests from test family.
For a two-way ANOVA, choose 'ANOVA: fixed effects, special, main effects and interactions' under statistical tests.
Choose post hoc under type of power analysis.
If you don’t know effect size, click determine, choose 'effect size from variance' under select procedure, click direct.
Input η2p, which is .13??
Click calculate and transfer to main window.
Set alpha level to .05.
Input total sample size.
Input number of groups (experimental conditions).
Input df of experimental component.
Select calculate in bottom right hand corner. If there's a pop-up, just click okay.
How to G*Power - two-way ANOVA priori analysis (11 steps)
Select F tests from test family.
For a two-way ANOVA, choose 'ANOVA: fixed effects, special, main effects and interactions' under statistical tests.
Choose priori under type of power analysis.
If you don’t know effect size, click determine, choose 'effect size from variance' under select procedure, click direct.
Input η2p, which is .13??
Click calculate and transfer to main window.
Set alpha level to .05.
Input total sample size.
Input number of groups.
Put power as .8.
Select calculate in bottom right hand corner. If there's a pop-up, just click okay.
When G*Power priori analysis presents multiple sample sizes…
Choose the largest sample size to ensure that the power for all experimental components is at least .80.
Reporting results - post hoc power analysis (4 steps)
Results of statistical test
Power level (for each effect)
Tailedness (for t-tests only)
Interpretation of power level
Reporting results - 1. Results of statistical test
An t-test/ANOVA revealed that [DV] did not differ between [G1] (M = XX.XX, SD = XX.XX) and [G2] (M = XX.XX, SD = XX.XX; t(XX) = XX.XX, p = .XXX, d = XX.XX).
"An independent t-test revealed that the scores on the Intolerance of Uncertainty Scale did not differ between adults with anorexia nervosa (M = 12.21, SD = 1.25) and healthy adults (M = 11.52, SD = 1.15; t(40) = 1.86, p = .070, d = 0.58)."
Reporting results - 2. Power level (for each effect)
The observed power of the analysis was .XX (one/two-tailed), suggesting that the study was over/underpowered.
“The observed power of the analysis was .44 (two-tailed), suggesting that the study was underpowered.”
Note: This is technically part of 3. Tailedness (for t-tests only) and 4. Interpretation of power level
Reporting Results – A Priori Power Analysis (7 steps)
Introduction of test used
"An a priori power analysis was used to determine the appropriate sample size for the study."
How effect size was chosen
"A previous study yielded a medium effect size (d = 0.57)."
Chosen significance level
"To detect the same effect at the conventional .050 significance level"
Chosen power level
"...with a power of .80"
Chosen statistical test
"...using an independent t-test"
Tailedness (for t-tests only)
"...(two-tailed)"
Required sample size
"...a sample of 98 (49 participants per group) was required."