Section 3: Business Analytics
1/23
There's no tags or description
Looks like no tags are added yet.
Name | Mastery | Learn | Test | Matching | Spaced |
|---|
No study sessions yet.
24 Terms
What are potential data sources for an organization?
Transactional data (POS systems, online sales, purchases)
Behavioral data (website clicks, app usage)
Demographic data (customer profiles, census)
Sensor/IoT data (machines, vehicles)
Social media & review platforms (sentiment, engagement)
Internal systems (CRM, ERP)
Why do we say online systems would give organizations more insights than traditional transaction processing systems?
Collect richer, real-time and behavioral and contextual data at every user interaction not just at checkout.
Full customer journey (search, clicks, cart)
Personalization and segmentation
A/B testing
Dynamic pricing and recommendation engines
What is business analytics? Why has business intelligence become so popular nowadays?
Using data to predict future trends based on data visualization, statistical modeling, and sophisticated data analysis for organizational decision making.
Understand the past and present + predict the future
Growth of digital data, cloud computing, and demand for real-time insights.
What is predictive analytics?
Automated search in large databases for non-obvious patterns and relationships to anticipate or predict outcomes. There is no pre-defined outcome variable.
What will happen?
How does predictive analytics differ from descriptive analytics? How does prescriptive analytics differ from predictive analytics?
Descriptive: what happened? (past)
Predictive: what will happen? (forecast outcomes)
Prescriptive: how to make it happen? (causal inference and reinforcement learning)
What is unsupervised learning and what is supervised learning? How do these two differ from
each other?
Unsupervised learning (what is the outcome?) - drawing inferences from datasets where there is no predefined outcome variable
Have customer data and don’t know who buys what / group customers in similar habits similar
Supervised learning (given outcome) - draw inferences from datasets in which outcome variable of interest is known and the algorithm is to learn to predict this value with new records where the outcome variable is unknown
Given a house + price / can predict the price of a new house
What is association detection? What are the key metrics to look at when you decide the best association rule?
Association detection - determine which behaviors or outcomes go together
“People who buy x also buy y”
P(A,B)/P(A)
x (antecedent) → y (consequent)
Look at the confidence (what rate consequents will be found given that the antecedent has occurred)
Lift ratio - comparison of whether an association is useful
For association detection, what does lift ratio indicate? What does a lift ratio less than 1 imply? What does confidence indicate? What does support count indicate? Suppose you plan to launch a cross-selling campaign and are given a set of selling strategies (deriving from association rules), be able to identify and argue which strategy you would go with.
Lift ratio - how much people are to buy y given they bought x, compared to just buying y (is the association useful)
Confidence / Probability of y
People who buy peanut butter at 1.75x more likely to also buy jelly, compared to just buying jelly
Lift = 1 → x and y independent; Lift > 1 → x increases the likelihood of y; Lift < 1 → x decreases the likelihood of y
Confidence - rate at which the consequent will be found given antecedent is already found
There is a 70% chance that jelly is bought when peanut butter is
support count - raw number of times itemset appears in dataset (divide by total transactions)
Need a mixture of all three of these things
What is clustering? What is the difference between classification and clustering?
Similar records are grouped together based on certain characteristics. The labels are not known.
Classification - the labels are known and other is a prediction of labels or categories for new data based on labeled training data. Learns from examples where the answer is known.
How can clustering be applied in different business areas?
Market segmentation: Groups customers with similar buying patterns to tailor marketing strategies.
Finance: Clusters investment options based on similar financial performance metrics.
Industry analysis: Identifies similar firms by comparing growth, profitability, and market size
Understand the basic idea of k-Means algorithm. (unsupervised, non-parametric)
Specify a number of cluster and then assign each case to each one of the k clusters
Each step the record is reassigned to the cluster with closest centroid
Groups similar things in k clusters by finding the center of each group and assigning each item to the nearest center
For supervised learning, why do we need to partition data into training data, validation data, and testing data?
Training data - used to build the models
Validation data - used to adjust the models
Testing data - used to evaluate the models
New Data - used to predict/classify using the final model
Helps to learn, generalize, and perform in real life.
What are the differences between parametric methods and non-parametric methods?
Parametric - estimation of parameters in function form (linear, non linear). Form of model doesn’t change based on how much data. Faster to train and predict and may underfit if the assumptions are wrong.
Faster and more consistent
Non-parametric - Does not involve the estimation of parameters and let’s the data speak for itself. No strong assumptions about function form (can capture complex relationships)
Malleable but does take more computational power
Understand the basic idea of k-NN algorithm (supervised, non-parametric)
k-NN predicts an outcome for a new point by averaging or voting among the k closest training points.
Binary - return the most common class label among k neighbors (3 neighbors, the new data finds the 3 neighbors and then gives the according outcome)
Numeric - return the average of the values (3 neighbors, take the average of their outcomes)
K closer to 1 - low bias (fits the training data closely); high variance (sensitive to noise) —> overfits (tiny details)
K = N - high bias (oversimplifies); low varaivle (very stable) —> underfits (too vague)
Understand the basic idea of decision trees (supervised, non-parametric)
Used for both binary and numeric outcome variables
Classification = binary/categorical (terminal node = leaf note/end point of the tree, decision node = internal node/ decision)
Regression trees = numeric outcome variable - this is supervised and parametric
Understand how to interpret a classification tree, i.e., be able to describe how you would make predictions when given a classification tree
If yes, go left
If no, go right
For model performance evaluation metrics for binary outcomes, understand how to calculate accuracy, precision, and recall when given a confusion matrix
Accuracy - proportions of total predcitons it got right
True positive - model said yes, and it was actually yes
True negative - model said no, and it was actually no
False positive - model said yes, and it was actually no
False negative - model said no, and it was actually yes
Precision (positive predictive) - out of all the predicted positives, how many were positive (TP/ TP + FP)
Useful for when false positives are costly (spam detection) - cost a lot to label as yes, when actually no
Recall (sensitivity to true positive rate) - of all the positives, how many did the model identify correctly (TP/ TP + FN)
Mean absolute error - average of absolute differences between predicted and actual values
mean squared error - average of squared differences between predicted and actual values
root mean squared error - square root of the MSE
R² - proportion of variance in the target variable that is explained by the model
When given a real-world problem, be able to propose various data mining techniques to solve
the problem.
Data mining - processes to analyze the data
Customer churn - classification (end variable are they leaving or no)
Product bundling - lift, confidence (association rules)
Fraud detection - detect abnormally frauds (K-nn neighbors)
Segmentation - use the clustering
Price optimization - regression
Be able to understand the difference between correlation and causation
Correlation - association without control
Causation - one variable directly affects another
When given an example, be able to evaluate if the results should be interpreted as causal relationships or correlational relationships
Causal - A/B testing, random assignment, removes bias, ruling out other factors (confounders)
Observational data = correlation only
Based on the Uber case, be able to describe the major phases of product development funnel
as well as how different methods should be used to generate information during the innovation
process.
Ideation
Prototype and Algorithm - built an MVP + modified the just in time dispatch algorithm
Simulation - ran trip parties to review the simulated trips
User testing - sent servers to ask how much customers were willing to walk/wait
Pilot launch - tested this express in SF and Boston
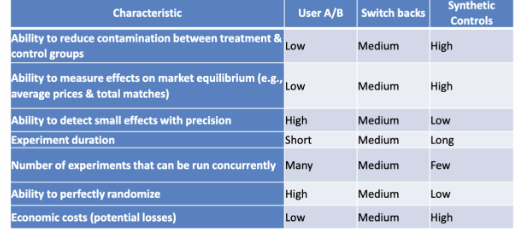
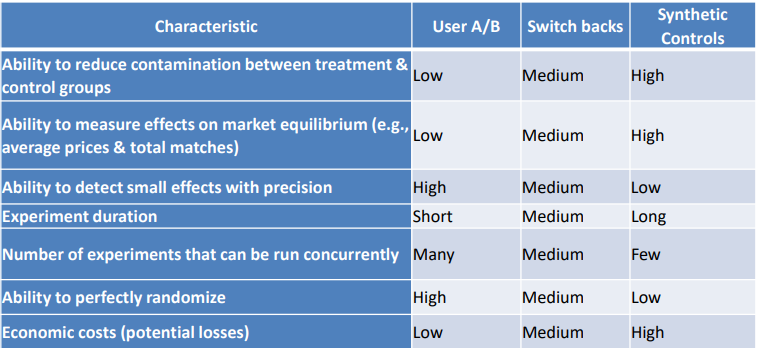
What are the differences among A/B experiments, switchback experiments, and synthetic
control experiments?
A/B - randomly assigned to the treatment and control groups
Switchback experiments - compare differences in behavior among users at different points in times (small amount of time is when they are exposed)
Synthetic control - create experimental groups from entire cities (do it from one city compared to the others)
For Uber, although the switchback experiment showed some promising results of using 5- minute wait time, why did the company decide not to increase the match wait times from 2 to 5 minutes in the six treatment cities of the launch experiment?
Uber chose to keep the 2-minute wait time in the 6 treatment cities because they wanted to protect the validity of the ongoing launch experiment. While the Boston switchback showed promising cost savings from a 5-minute wait, applying that change mid-experiment could have invalidated causal conclusions, and the Boston data wasn’t reliable enough to generalize to other markets. Uber prioritized long-term strategic learning over short-term financial gain.
When given a question, be able to apply different experimental methods and design an
experiment to address the question
A/B: good for digital platforms, low risk
Switchback: for platform-level changes
Synthetic control: when system-wide effects matter
Ensure control of confounders and clean measurement